Meet the next generation of infographics
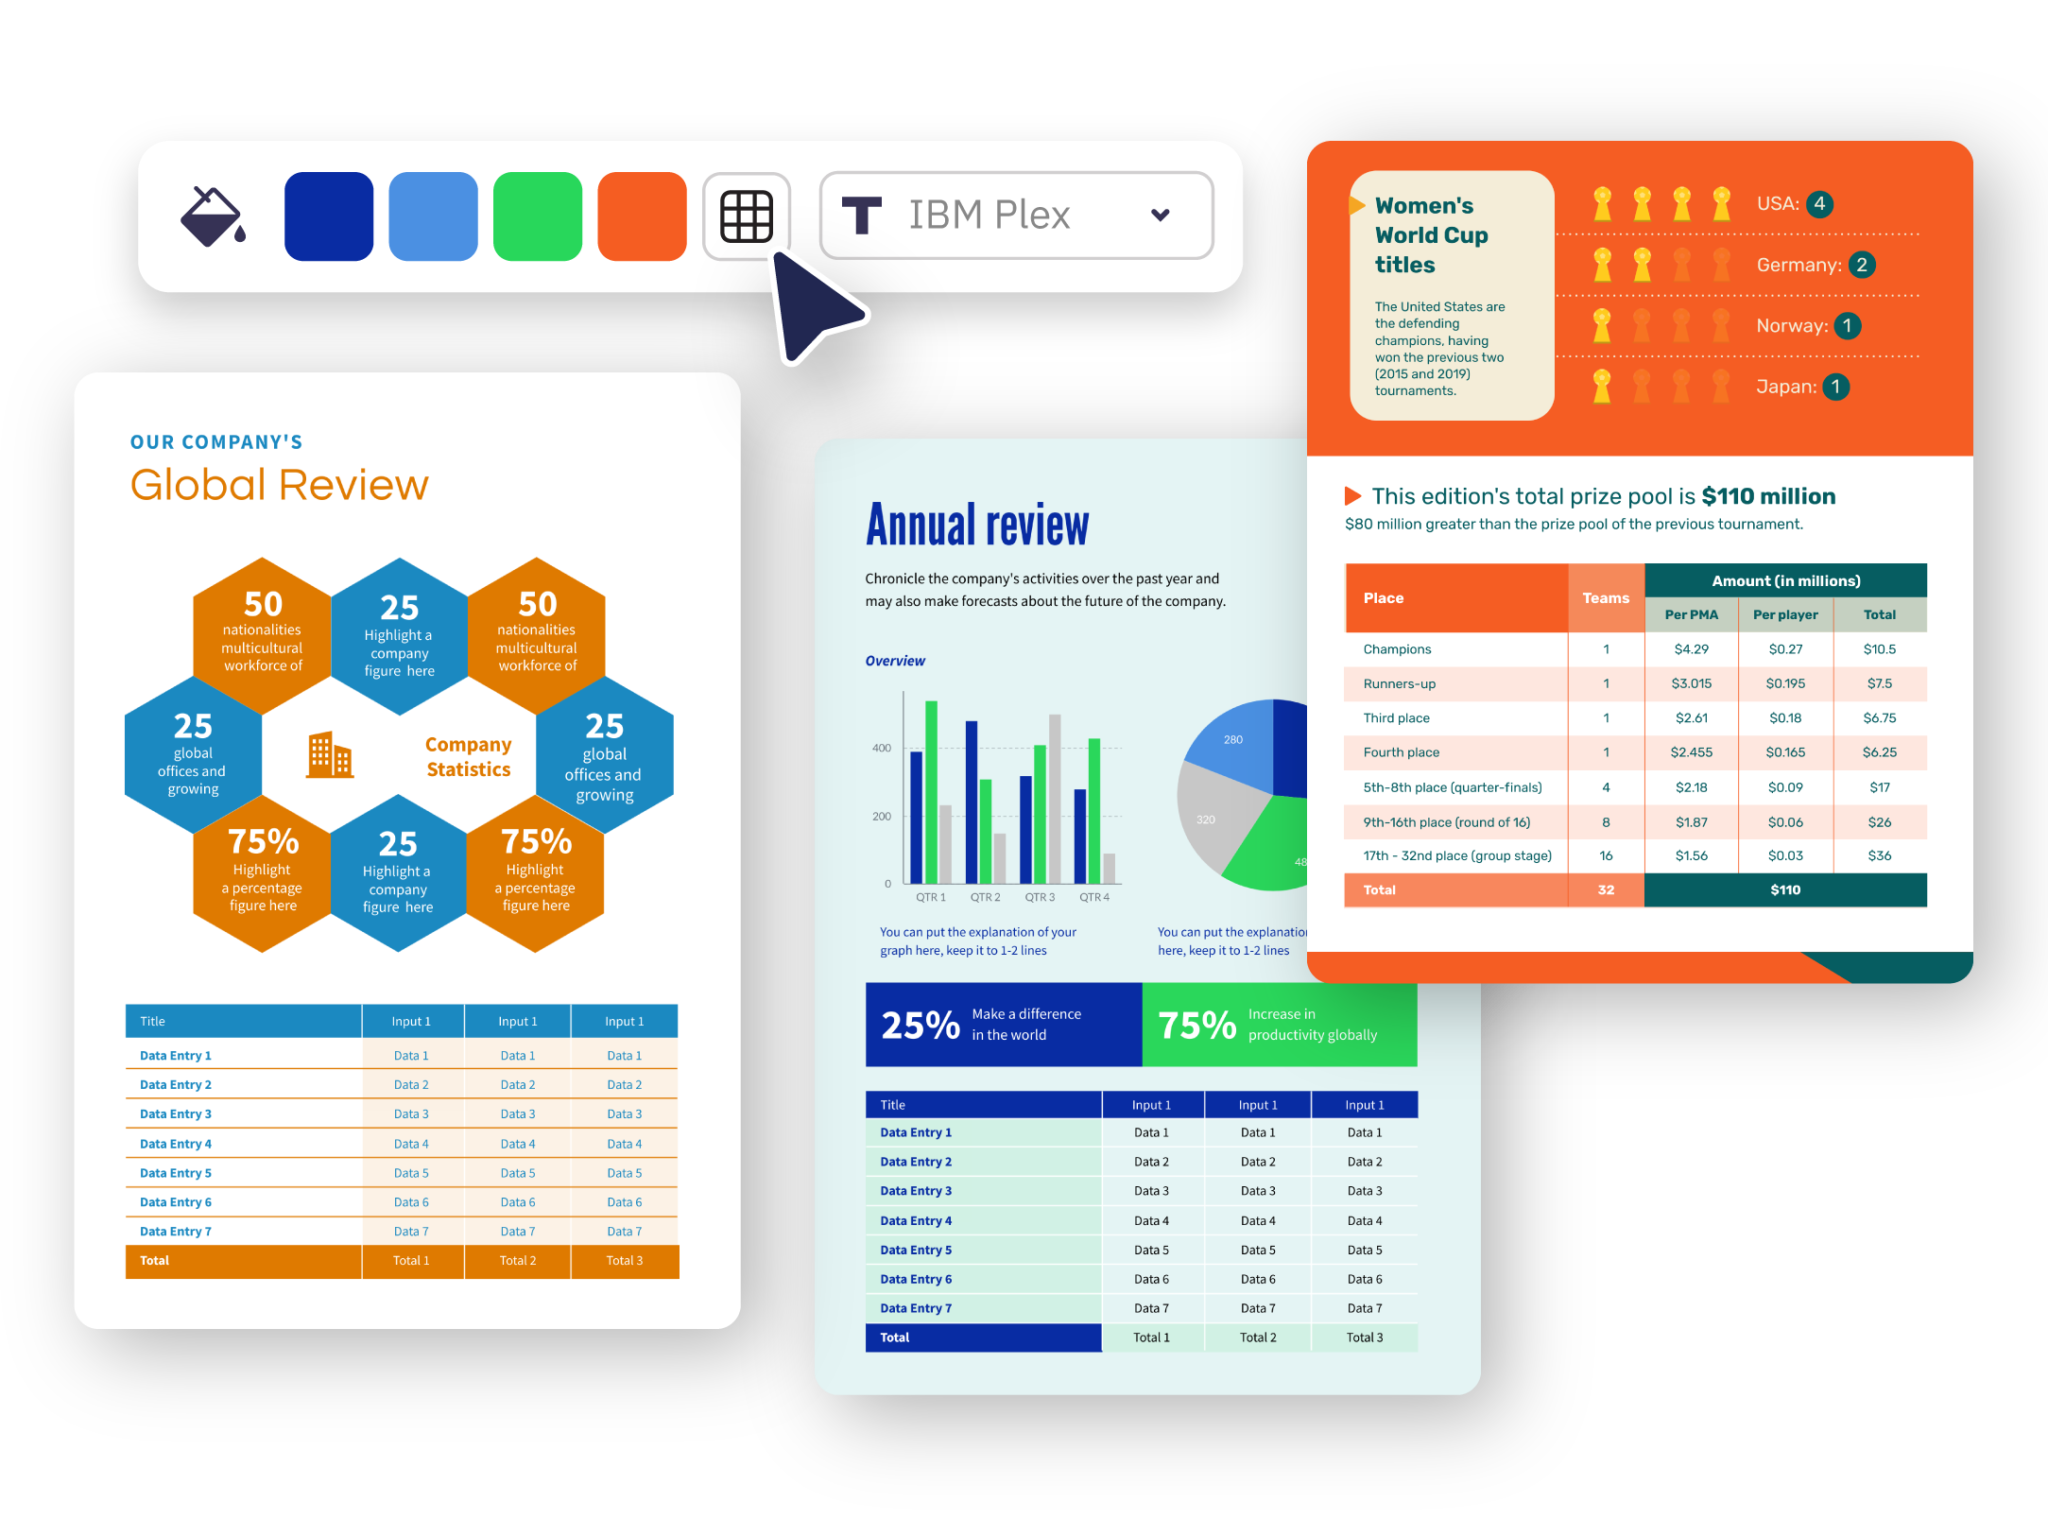
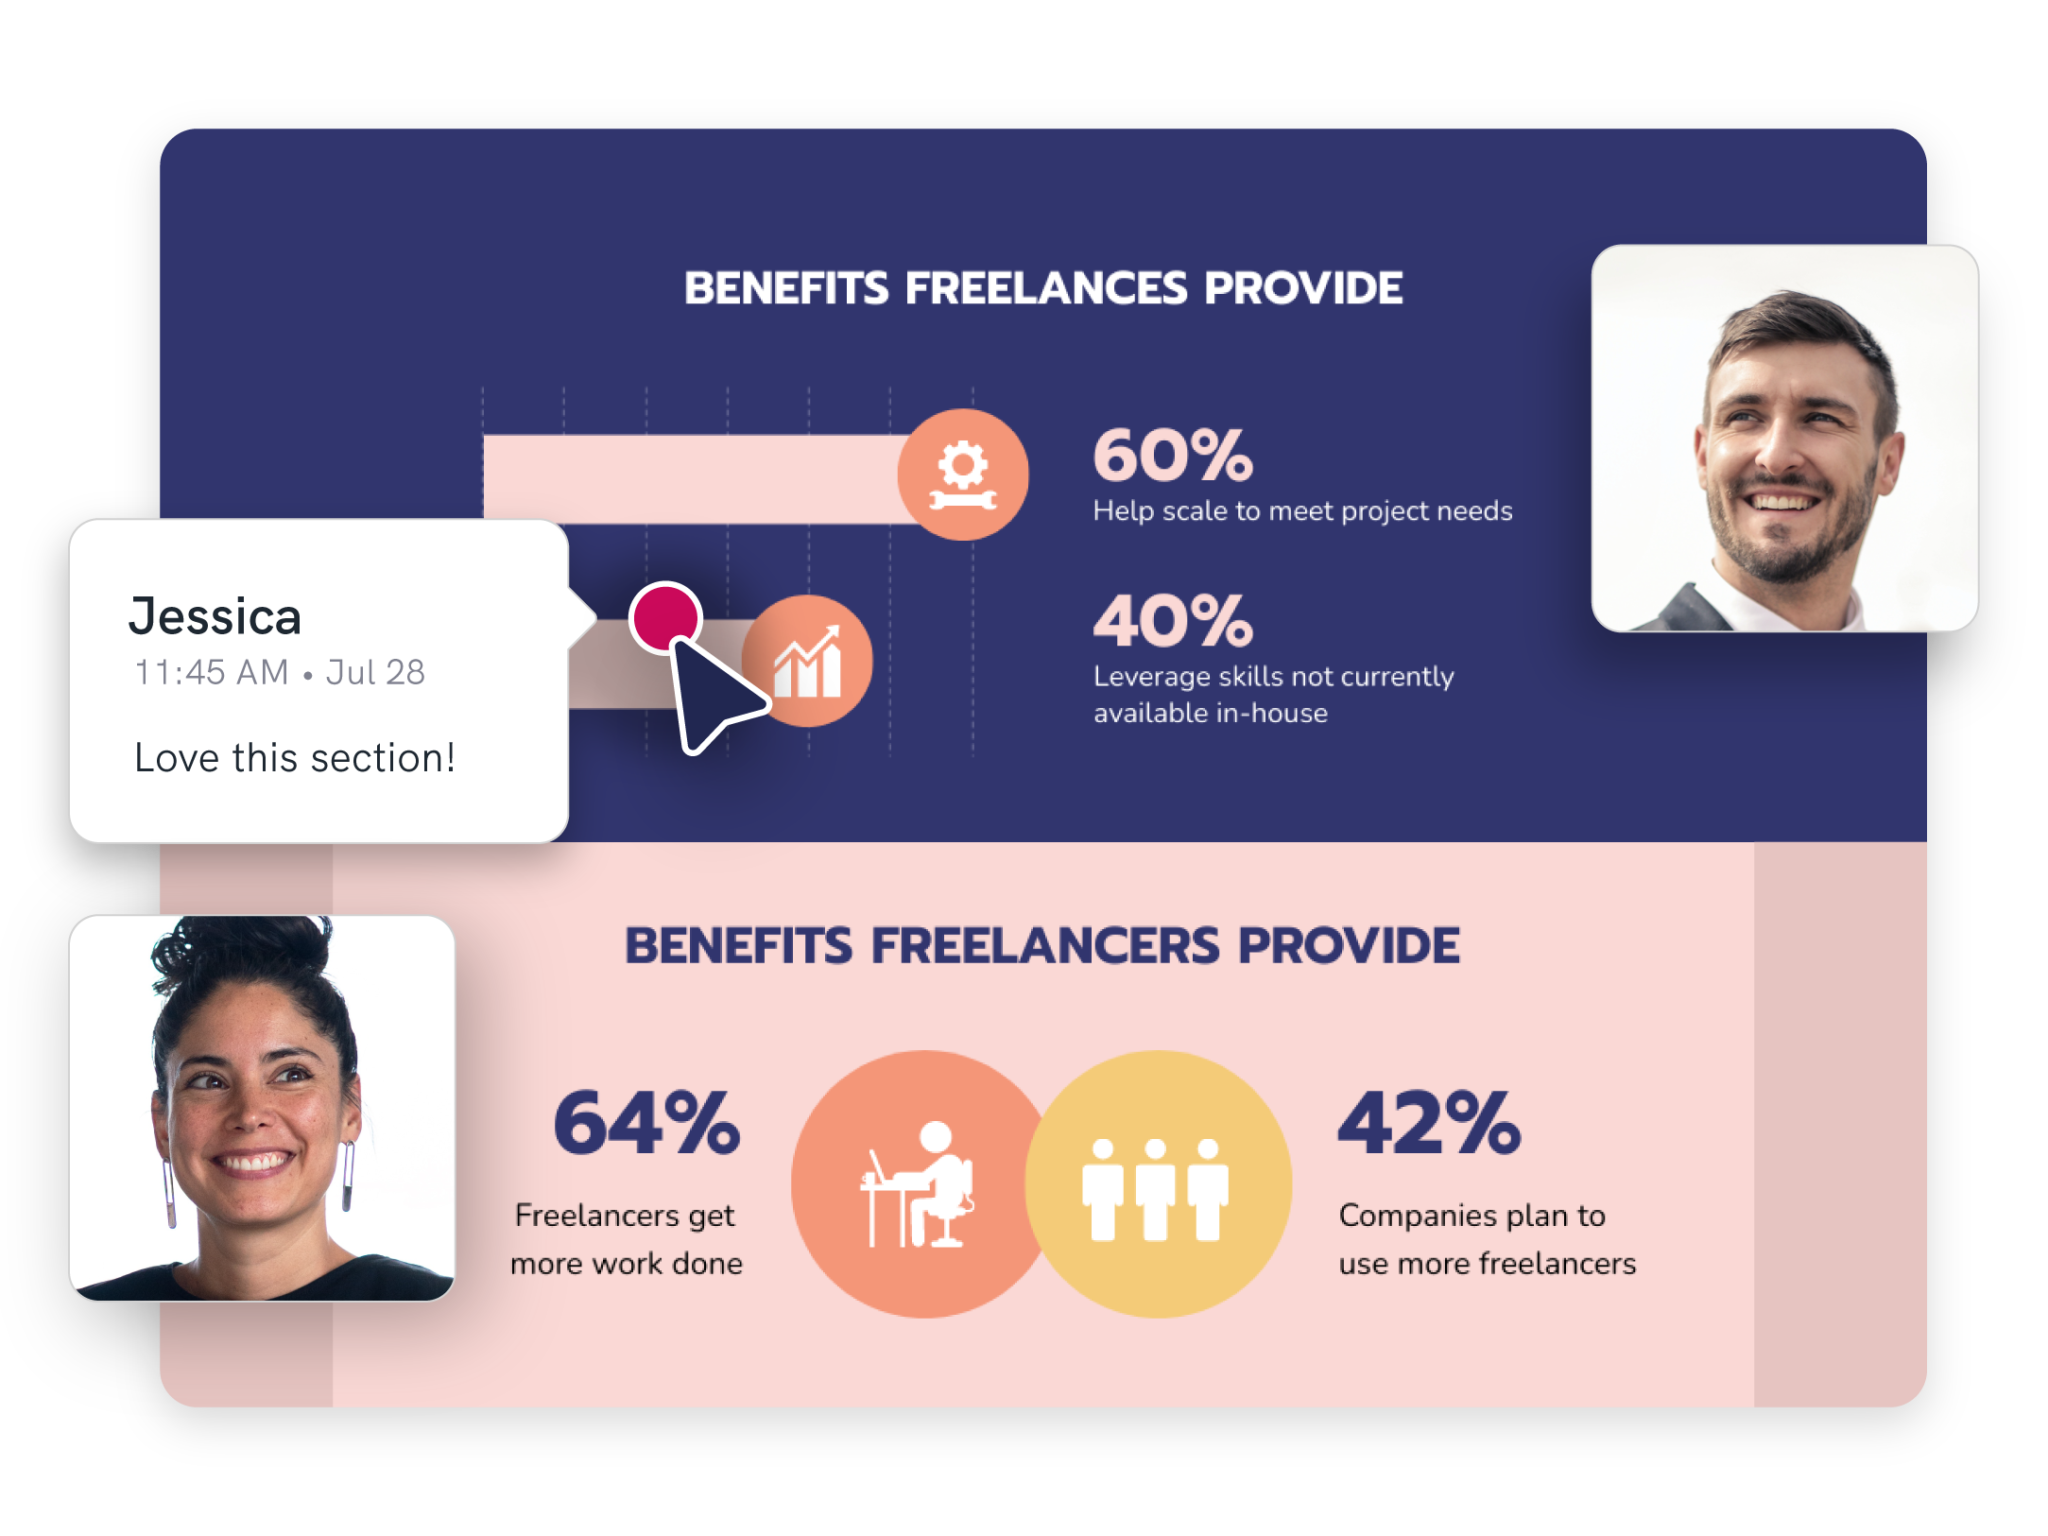
Transform complex ideas into captivating visuals that inform and engage your audience. With Piktochart AI, you can create stunning infographics, reports, and presentations in seconds, perfectly aligned with your brand. No design experience required.
Loved by millions of creators, teams and businesses worldwide


What our users think of us

“We were paying a lot of money to get this caliber of graphic support prior to Piktochart. Now we’ve eliminated all that cost and a fraction of the time.”

“Our community benefits when they can understand what's happening in the corrections system. Visuals make that possible.”

“What I find with Piktochart is it helps with the aesthetics. It helps me look like I have some sort of graphic design background. It makes what I create look good. That's what I needed. And it was a perfect tool at the perfect time for me.”

“I think I can do things in a way that just seems so easy, especially when I think back as a kid growing up trying to make presentations on PowerPoint. The features that are embedded in Piktochart take the sort of the grid locking to it for me to like a different level. So, I love that because I'm all about the symmetry as much as possible.”

“A lot of the time if you've started down one road, you're sort of boxed in. With Piktochart, I can customize block sizes and suddenly it's exactly what I needed. I love that.”

“It's really a no-brainer to use, I would say. People have told me to try another infographics design platform that is very world-renowned, but I tried it before and I didn't really like the feel and the way it works. Despite several attempts to try to pull me away, I always come back to Piktochart. I think it goes back to the great design of Piktochart.”

“If I don't have Piktochart, I have to go back to Photoshop or Illustrator and it will take me a longer time just to put a photo into a particular shape and frame.”

“I did a lot of research on different platforms, and Piktochart stood out because it offered just as many features as others but at the right price—more for less.”

“We started The Bright Millennial just to market ourselves online. Now, we've grown to 300,000 followers, and it's become our full-time business.”

“We didn't pay for any design work on The Brilliant Box because we used Piktochart to do it ourselves. I guess that was the most cost-effective product because we sell it. It's got a good margin on it, and it didn't actually cost us. It's only cost us the production fees.”

“Instead of paying for 10 different programs, we just pay for one… Because if you're using four different things, you can't be great at four things as opposed to just one you're awesome at.”

“I think that we can say honestly that Piktochart is one of the reasons why that has been more successful because it's helping to create more engaging content.”

“We will continue using Piktochart to grow our brand presence and to help educate people about a more sustainable lifestyle every single day.”

“Now we have a project database where everything is logged and represented visually, so that people can click and see infographics that provide an easy to understand overview.”

“If you’re working on a long format guide and you can offer your client to re-purpose it into a beautiful whitepaper, lead magnet, or even a course, you will give them a feeling that they are maximizing every cent they spend with you.”