Free Infographic Maker
Make infographics for free with no design experience. Trusted by 14 million users, Piktochart is easy and fast. Customize an infographic template and create infographics in minutes. Watermark-free.

Our infographic maker is chosen by professionals and educators worldwide


Ease of use with no design skills needed
Create an Infographic Online
Engaging infographics are the perfect data visualization tool if you need to create presentations, explain a process, visualize data, or present information in a more understandable way.
With Piktochart’s free infographic maker, designing your own custom infographic is easy. Start with a free template, update your information, replace images, or change the style with just a few clicks.
Or get started with our latest Piktochart AI. From concept to canvas in seconds, Piktochart AI creates quality infographics from any prompt.
Try for yourself how easy AI infographic is

Free pre-made templates
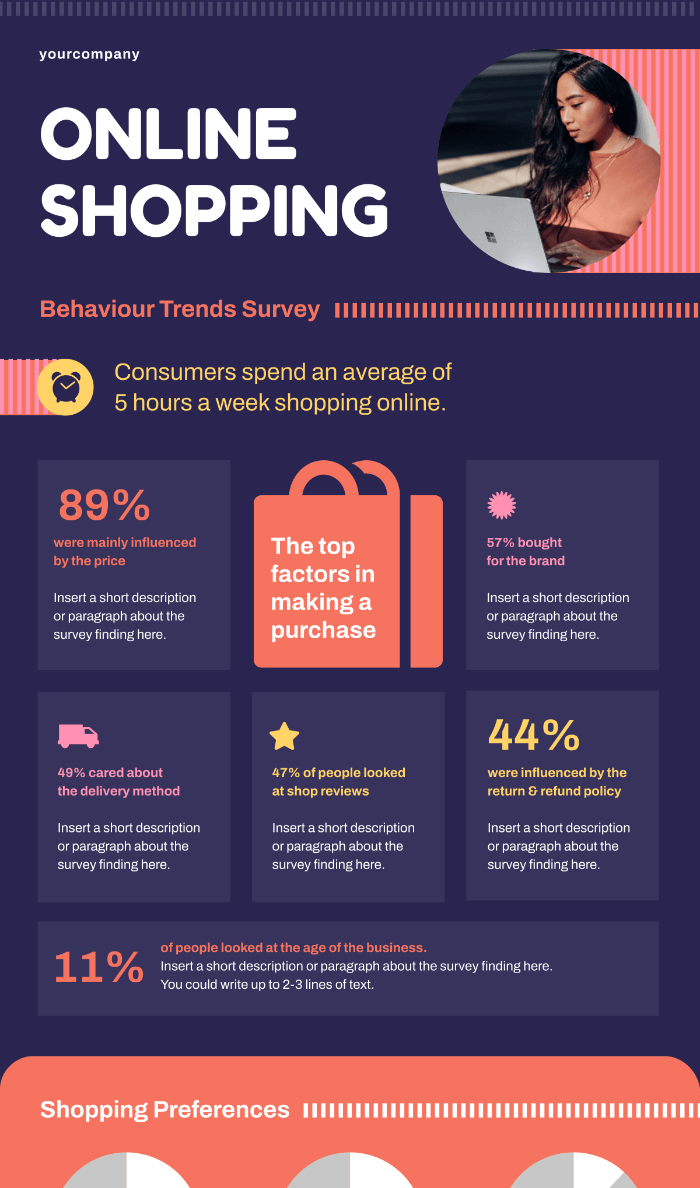
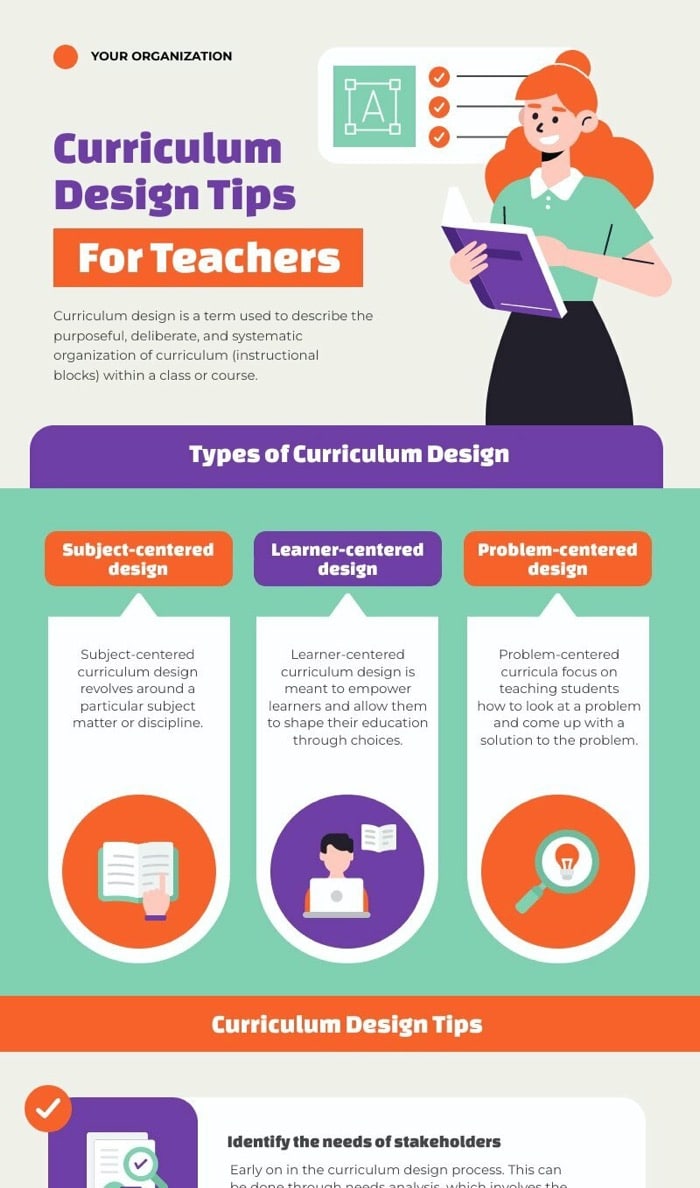
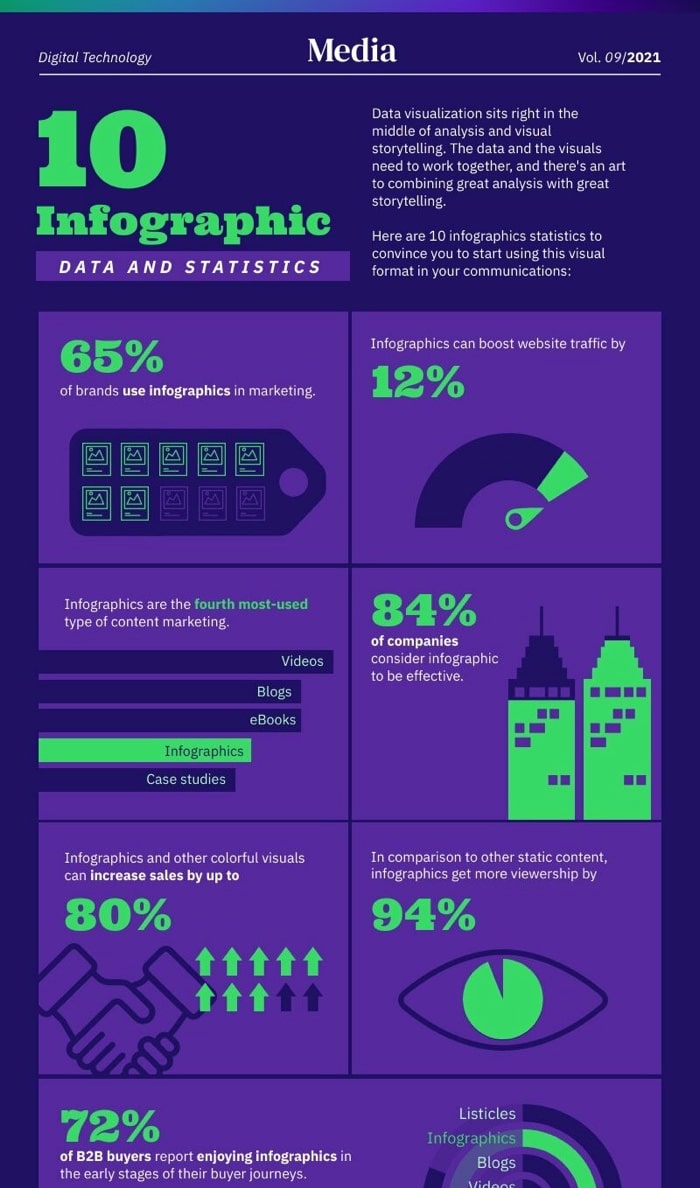
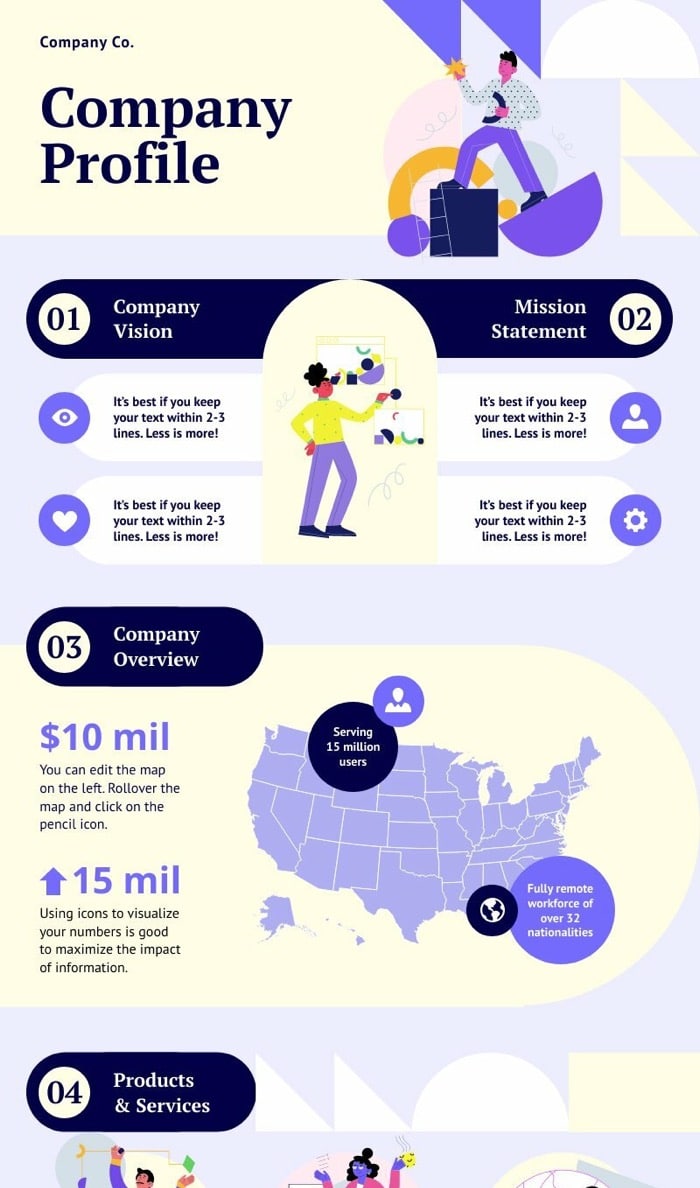
Choose From 230+ Professionally Designed Infographic Templates
Get inspired by our gallery of 230+ unique infographic templates. At Piktochart, we value quality over quantity. Each infographic template was carefully crafted by one of our experienced communication designers. Our designers ensure that the templates you find on Piktochart’s online infographic maker are based on proper research and accurate data and follow the latest information design trends. Once you select the template you like, you can make a good infographic by customizing it with the perfect photo, illustration, or icon found in the graphics library within the editor.
From timeline infographics to comparison infographics, survey results to health research, Piktochart offers professional infographic templates that help you save time and allow you to become a pro infographic creator.
Create a free account
Turn Complex Data Into a Clear, Catchy Infographic Design
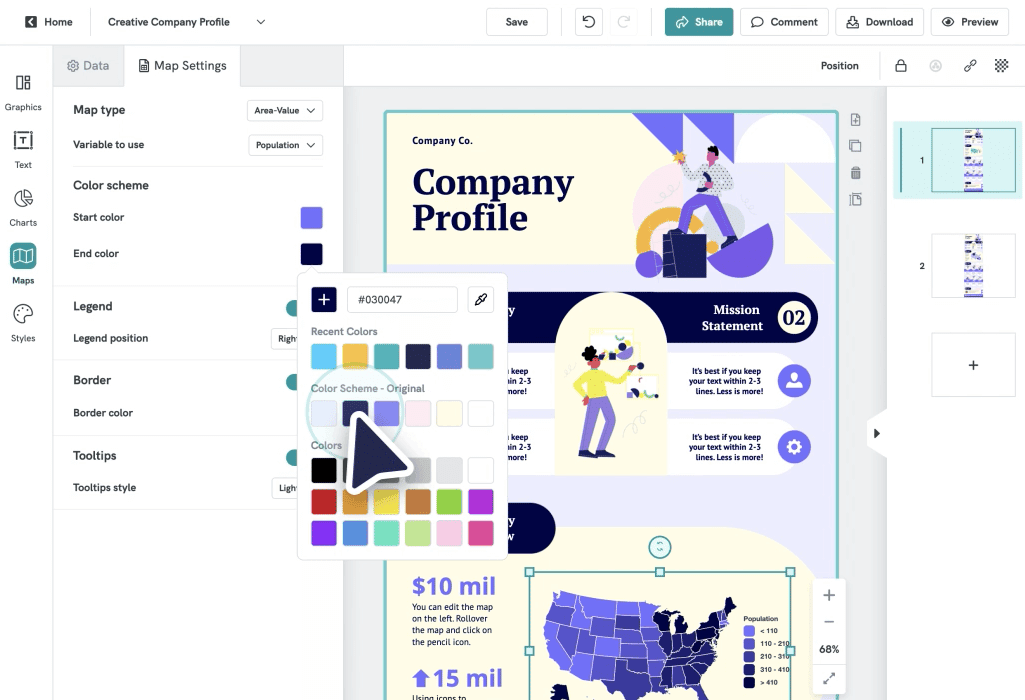
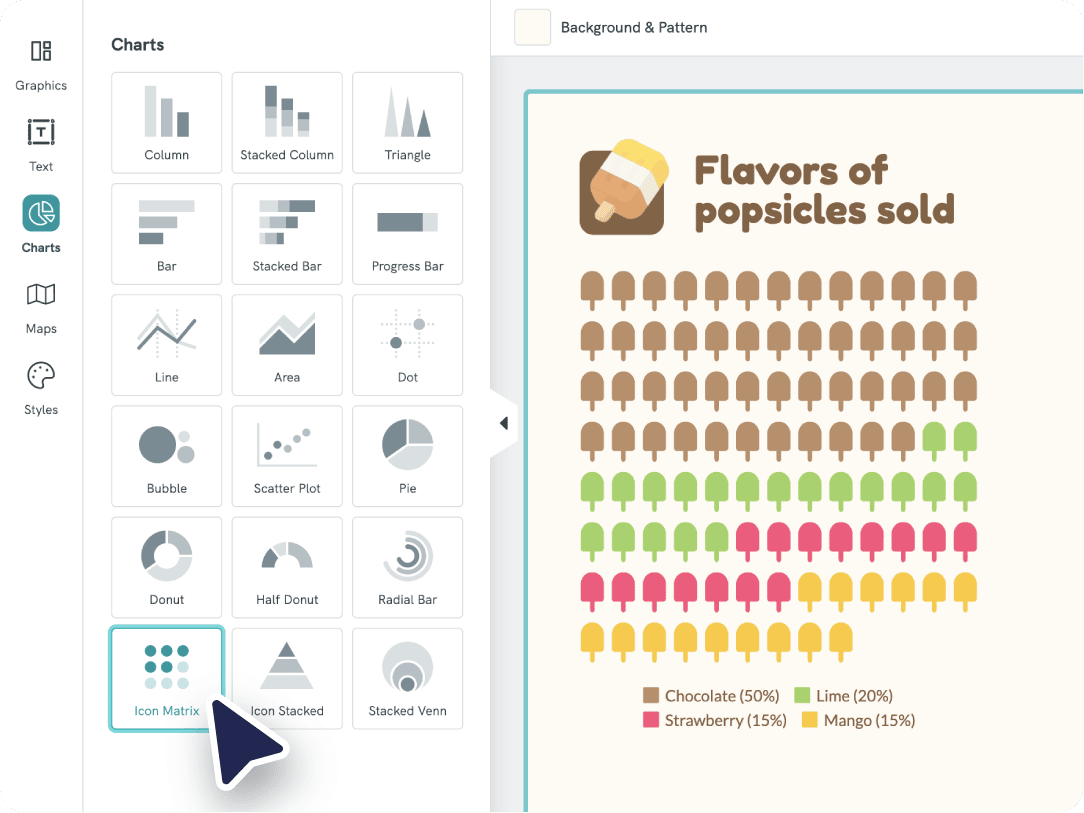
Infographic creation or visualizing data and information doesn’t have to be complex. Copy-paste your data into our graph maker, upload a CSV, or Excel file, or link up a Google sheet. Turn complex data into a clear data visualization presented as your own infographic. Choose between charts, graphs, and interactive maps to present your data clearly and understandably. Showcase a timeline, list, process, or data comparison. You can even create interactive infographics to engage your target audience!
The free infographic maker from Piktochart grants you access to all types of charts: pie charts, bar charts, pictographs, and more to create infographics for all your needs.
Visualize your data with Piktochart

Branding and your own content
Customize Infographics to Your Brand in Seconds
With Piktochart’s brand assets feature, your content is always on-brand. Using our free infographic maker, simply drag and drop your logo or a screenshot of your website to extract the brand colors for your infographic design magically. Do you want to use your company fonts?
Upgrade your free plan and in three clicks you can create beautiful infographics with your own images, marketing materials, ideas, and more.
Your custom color palette and uploaded fonts will be added to the editor so that you or your team can easily design by applying them to any new project. Create an infographic with all the flexibility you need.
Learn more about Brand Assets
“Infographics created with Piktochart have helped me during important meetings with administrators at school districts or foundations in the community. Without Piktochart, we would not be able to secure funding to support our work.”
Dr. Aaron FischerDee Endowed Professor of School Psychology at University of Utah

“Piktochart is a no-brainer to use. People have told me to try another infographics design platform that is very world-renowned, but I tried it before, and I was not too fond of it. I think it goes back to the great design of Piktochart.”
Deborah Tan-PinkSenior Communications Manager, Revolut
Why Non-designers and Designers Create an Infographic With Piktochart

Marketers & Sales Professionals
- Visualize results
- Explain the benefits of a product
- Make content more engaging through a good infographic
- Introduce buyer personas and increase brand awareness
- Drive traffic and leads with custom visuals

HR & Communications Professionals
- Report on the hiring process
- Employee onboarding (images, icons, stock photos, interactive maps can be easily added to visuals with drag and drop)
- Build employer branding on social media
- Communicate values and describe the culture through visuals created with an infographic maker

Nonprofits & Healthcare Professionals
- Explain a process and save time
- Inform and educate the public through professional visuals, without having design skills
- Explain a cause through infographic design

Teachers & Educators
- Foster independent learning
- Make learning more engaging by making infographics and encouraging students to create their own content
- Develop analytical thinking skills
- Simplify science-related topics
How to Create an Infographic
1. Log into your Piktochart account
Log into Piktochart (or create an account for the Free plan if you don’t have one already) and go to the dashboard. Once you’re there, go to the sidebar to the left and click infographics. You’ll find our infographic maker.
2. Pick an infographic template
Unless you’re a professional designer and prefer to start with a blank canvas, infographic templates are the way to go. Our high-quality templates save you time and make your infographics look as good as they can. Find one you like by using the search bar at the top and create an infographic fast.
3. Customize the infographic
Once you pick an infographic template, adjust the colors, change the fonts, and add in your own text. Add your company colors to make your visual content fit your brand. With a premium account, you can have custom fonts and custom brand color schemes.
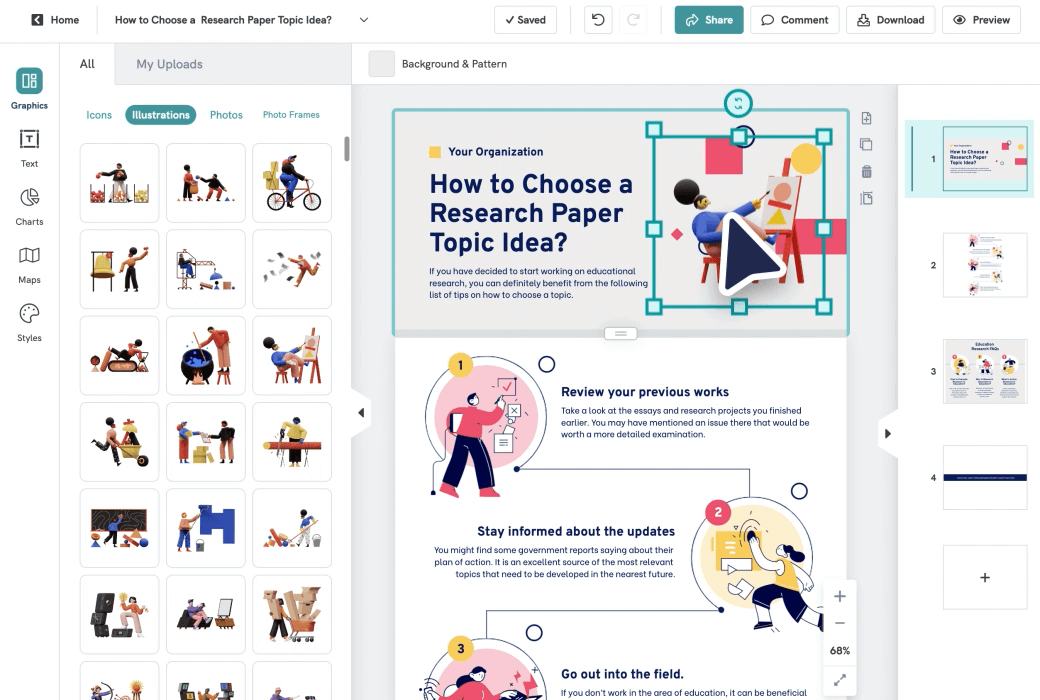
4. Add images, icons, and other assets to the infographic creator
Make engaging infographics by adding images, icons, illustrations, and gifs with the drag and drop editor. Pick from a library of free images and visual assets to create an infographic that stands out or upload your own images into our free infographic maker.
5. Download and share
Once you’re done visualizing data and customizing your visual, download it as a JPG, PNG (with the free account), or PDF (with the paid plans). Email it to your colleagues and manager, or embed it on your website.
Edit One of Our Premade Templates to Create an Infographic


Free templates are available for all categories
From Data Visualization to Storytelling: Understanding the Different Types of Infographics
Business Communications Infographic
Create infographics to promote your product, explain a feature, and present any other type of information for your business or department. You have access to a vast library of icons, free images, text styles, and illustrations to make an infographic online.
Enhancing School Presentations
Make school presentations stand out by including your own infographics. From historic events to science projects, any topic is more interesting with a visual. With Piktochart, infographic creation is easy and fast. Start editing one of the free templates.
Timeline Infographic
Tell a story through a timeline infographic. Describe a process, illustrate your company’s history, or create human resources visuals. Try Piktochart’s timeline maker for free.
Social Media Infographic
Drive engagement on social media with beautiful infographics. Make creative visuals for a marketing campaign or drive brand awareness using an infographic maker.
Medical Infographic
Explain health risks, educate about medical topics, create visuals for summits, and inform the public through professional medical infographics. Professionals working in the healthcare industry use our infographic maker to create visuals without having design skills.
Ready to create beautiful infographics?
Join more than 14 million people who already design information with Piktochart’s free infographic maker.
FAQs
- Piktochart
- Snappa
- Infogram
- Freepic
- Canva
- Venngage
- Visme
- Adobe Creative Cloud Express
- Easel.ly
1. Use a premade template to ensure quality design and be faster.
2. Define your target audience.
3. Thoroughly research your topic and choose the most relevant information.
4. Include data from trusted sources, as recent as possible.
5. Choose a design that allows white space and is not too crowded. The goal is to make information easy to read. You can choose a Piktochart free template and customize it.
6. Download your visual as a PNG or PDF and promote it on all relevant channels; your website, social media, and dedicated infographic submission websites.
- Communicating a message or data in an interesting way. Visuals have higher potential than text to draw attention, and infographics are one of the best ways to visualize information.
- Educating an audience on a topic, for external or internal communication (product features, instructions, health, onboarding, etc.)
- Promoting a business or a campaign.
- Driving brand awareness and creating engagement (especially on social media).
- Acquiring leads by gating the visual and requiring a form to download the resource.
- Include it in a relevant blog post or a newsletter as an image.
- Share it on a social media post or a story. Keep in mind the size for each channel (Facebook, LinkedIn, Twitter, Instagram, Quora, etc.). Depending on their limit, you might need to share a smaller image and include a link to the infographic.
- Gate it on a landing page as a downloadable PDF.
- Send it to an infographic submission website to get it published by a third party.
Step 1: Log into Piktochart.
Step 2: Pick a pre-made template or start from scratch.
Step 3: Design in a web browser by using the drag-and-drop editor to add stock photos or your own images. Write your text and visualize data through graphs and charts.
Step 4: Download your visual or share it online.
Step 1: Log into Piktochart’s free infographic maker.
Step 2: Pick an infographic template or start from a blank canvas.
Step 3: Drag-and-drop images, icons, and illustrations.
Step 4: Customize to your brand; upload your company font, choose the color palette, add your company fonts.
Step 5: Share online or download your visual.
With desktop-based design software like Adobe Illustrator, you will need to install it and pay for the license.
With a cloud-based free infographic maker like Piktochart, Canva, or Venngage, you only need to create an account online. For Piktochart, you can make an infographic without any design experience
Create an account for the Free plan, log in, pick a template or start from scratch, and make an infographic.
The visuals you create can be shared online or downloaded.