Revolutionize the way you visualize data and concepts


Fast & Efficient
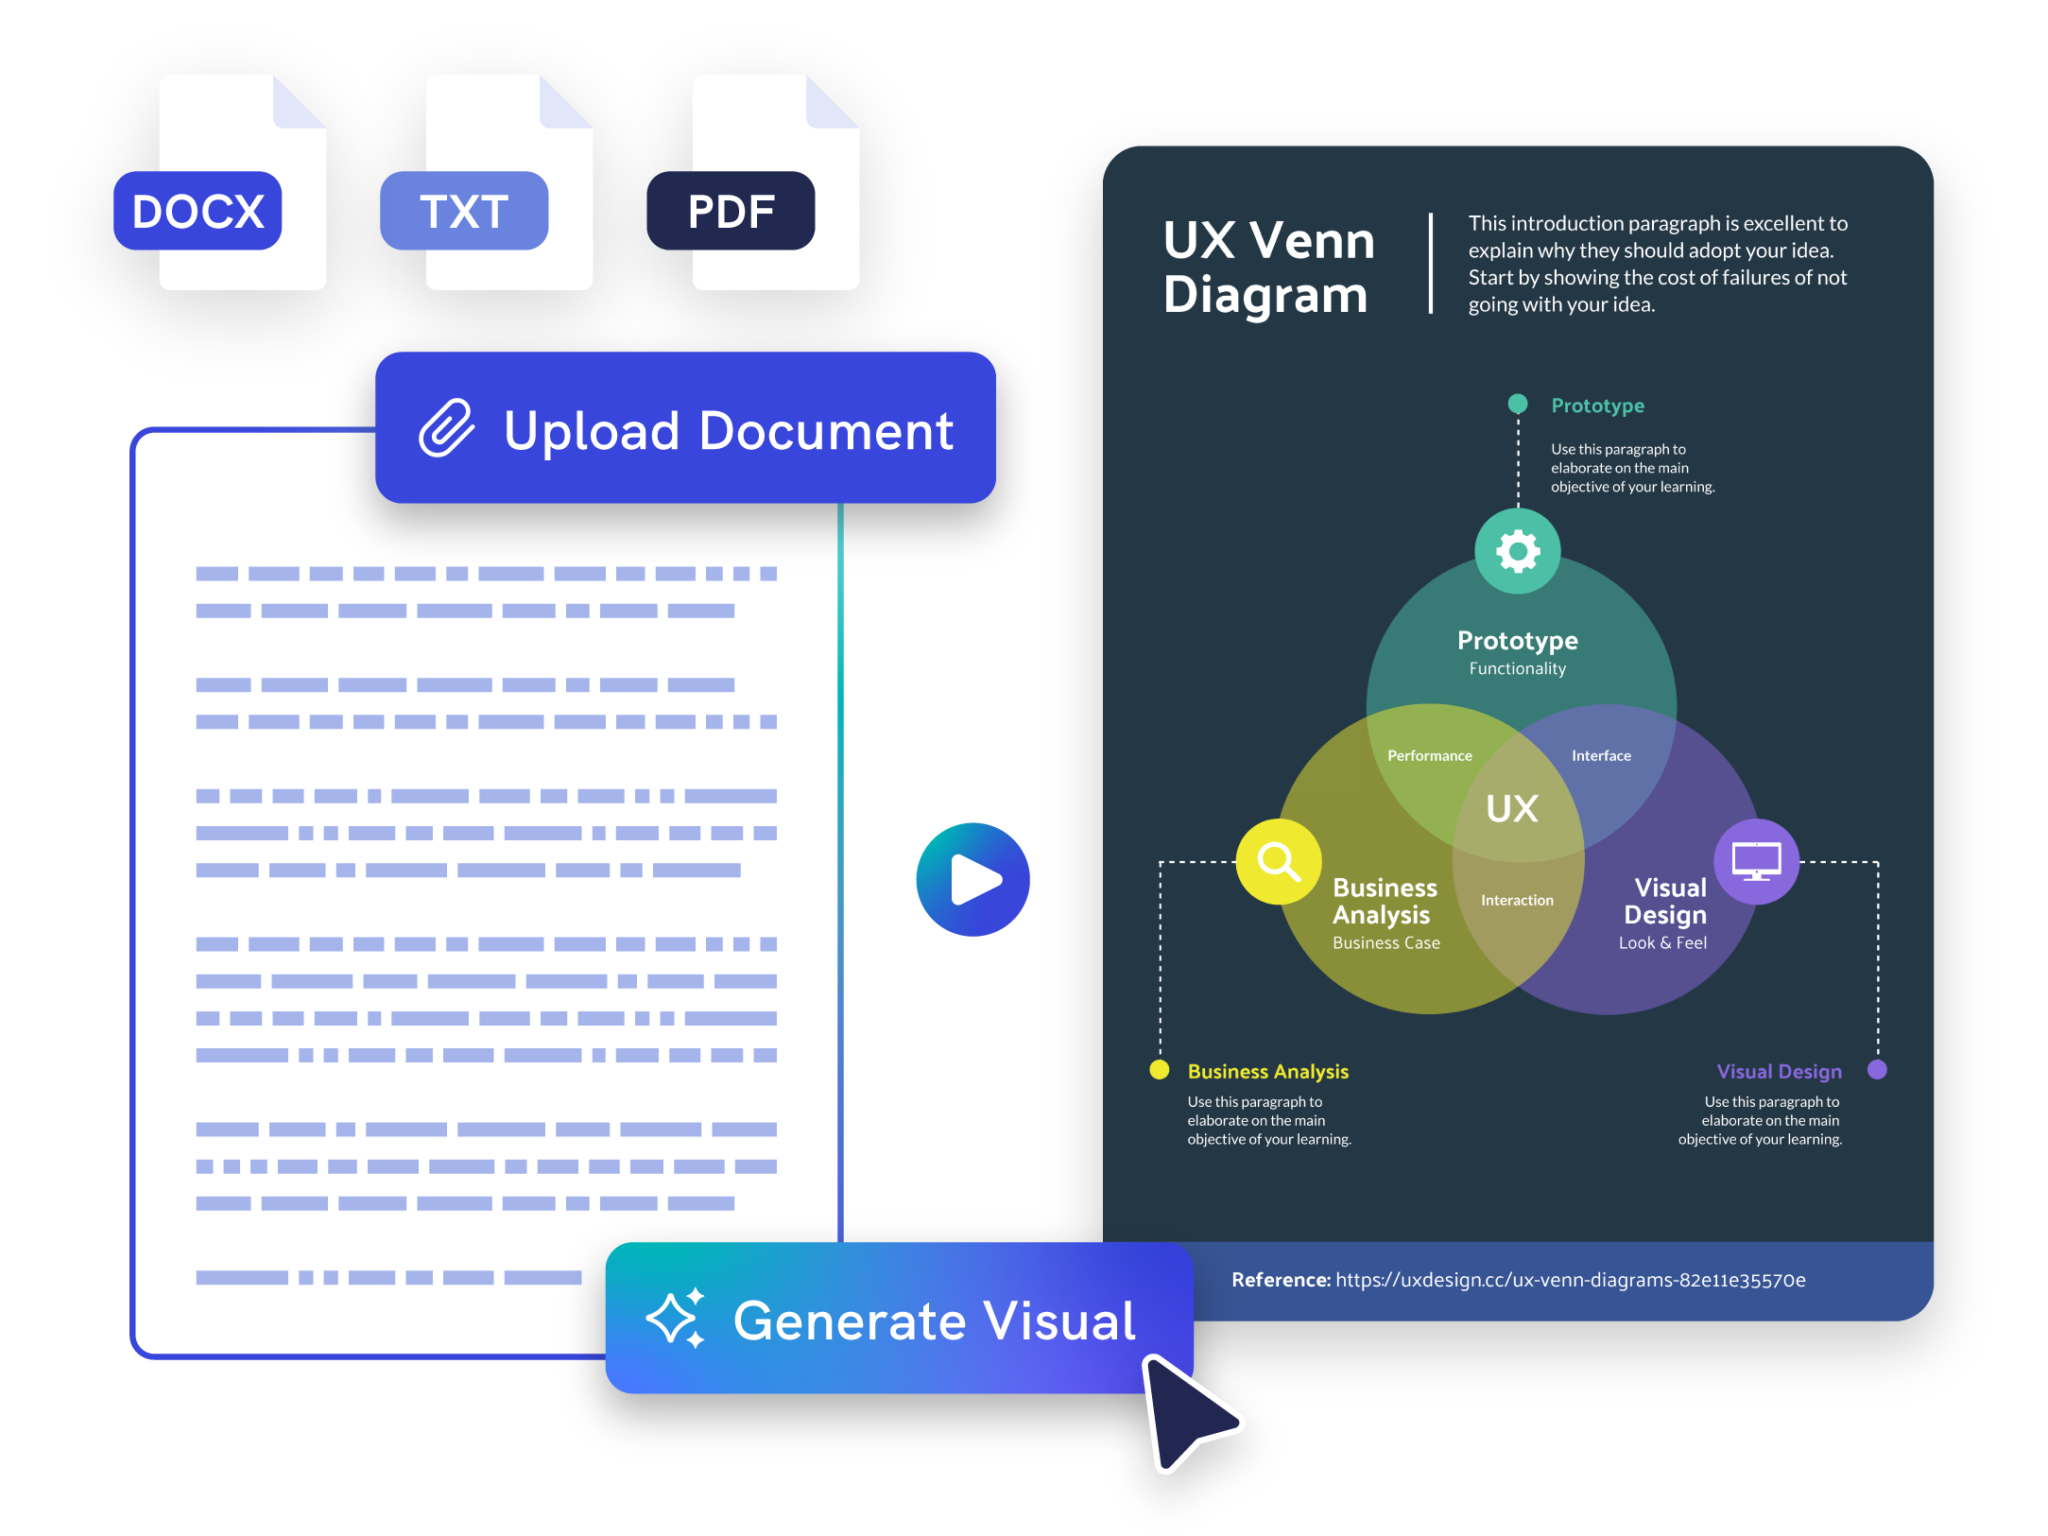
Create diagrams from a prompt
Describe the process, workflow, system, or concept you need to explain, and Piktochart AI creates an editable visual diagram draft.

Fully Customizable
Turn complex relationships into a clearer structure
Use AI to organize steps, branches, categories, and relationships into a diagram that is easier to understand and share.
Effortless Data Stories
Edit every label and visual element
Refine shapes, labels, icons, colors, fonts, spacing, and layout in Piktochart so the diagram fits your brand, class, or workflow.
Trusted by Industry Leaders

Marketers
- To present complex data in an easy-to-understand format, helping to illustrate key metrics and trends for informed decision-making and clear communication with stakeholders.
- To map out and organize marketing strategies and workflows, ensuring smooth execution and alignment across teams.
- Simplify and visualize concepts, processes, and ideas in content and presentations, making it easier for audiences to grasp and retain information.

HR and Learning and Development
- HR uses organizational charts to depict the company structure and reporting relationships, helping employees understand roles and manage workforce changes.
- L&D professionals use flowcharts to outline training procedures and processes, providing clear guidance for effective and consistent training delivery.
- HR and L&D use competency models to define required skills and attributes for various roles, aiding in job expectations, development plans, and career advancement.

NGOs and Government Organizations
- Present complex data clearly in reports and briefings, making information more understandable for stakeholders and the public.
- Diagrams assist in strategic planning, tracking progress, and managing resources, ensuring efficient project management and alignment with objectives.
- Communicate key issues and impacts, enhancing public awareness and engagement through clear and compelling visuals.

Teachers and Educators
- Diagrams simplify and clarify complex ideas, helping students grasp difficult topics more easily.
- To enhance lesson planning by organizing and tracking lesson plans and curriculum, ensuring structured and effective teaching.
- To make learning materials interactive and engaging, aiding in student understanding and participation.
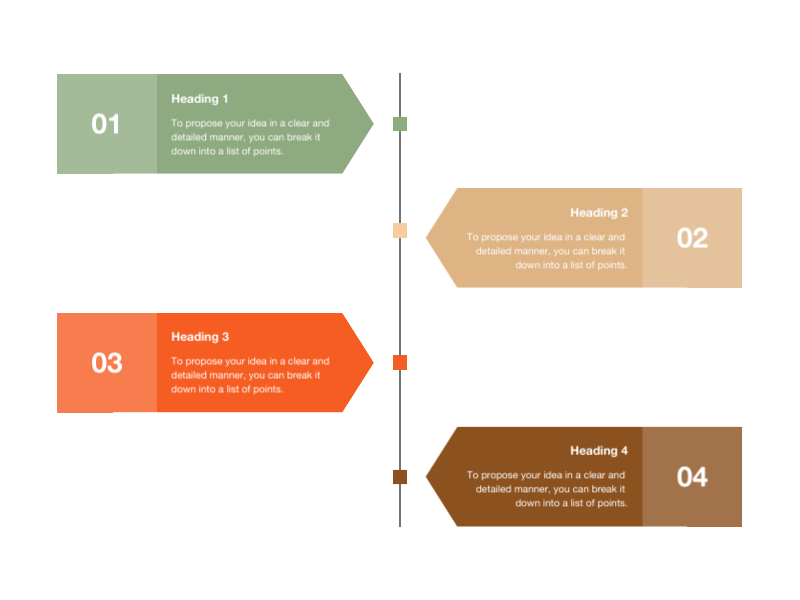
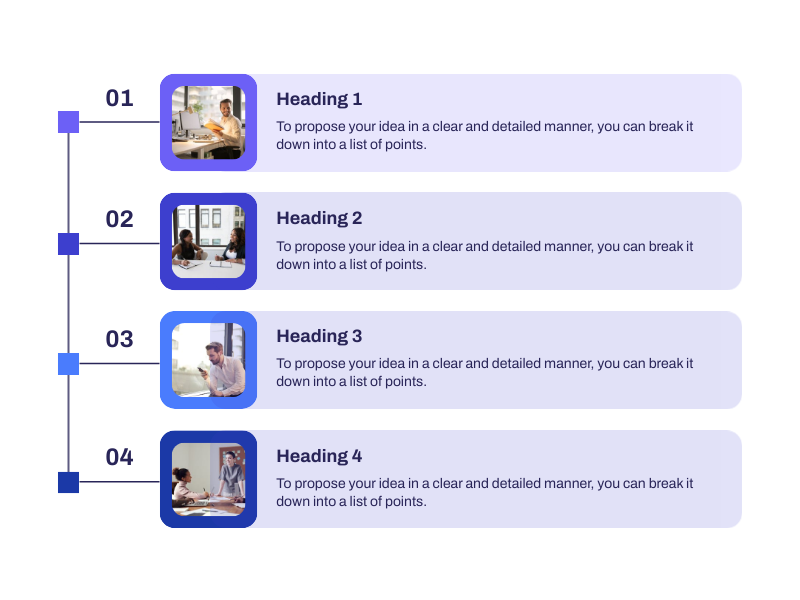
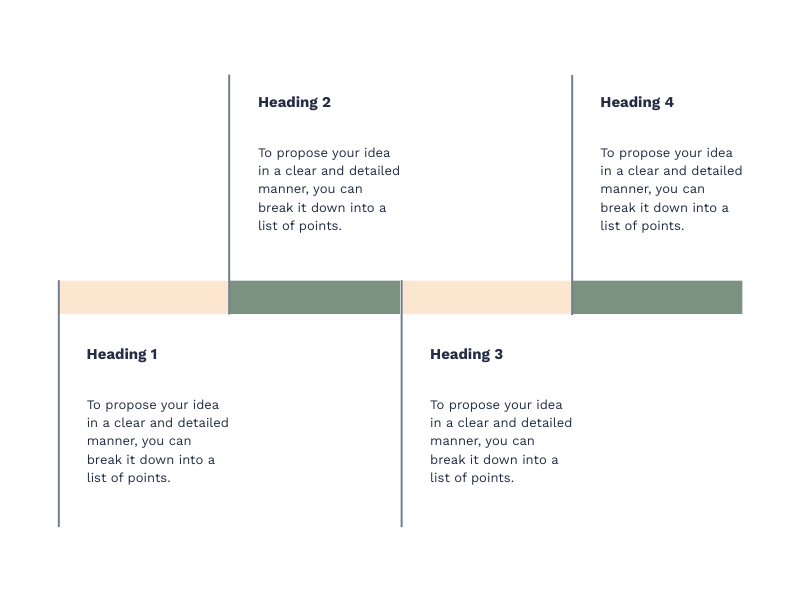
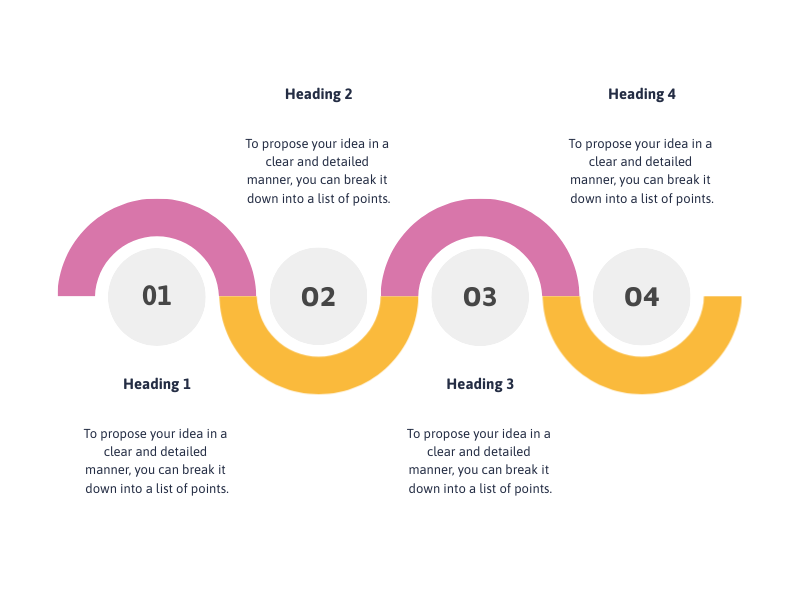
Diagrams created using Piktochart’s AI-powered diagram generator
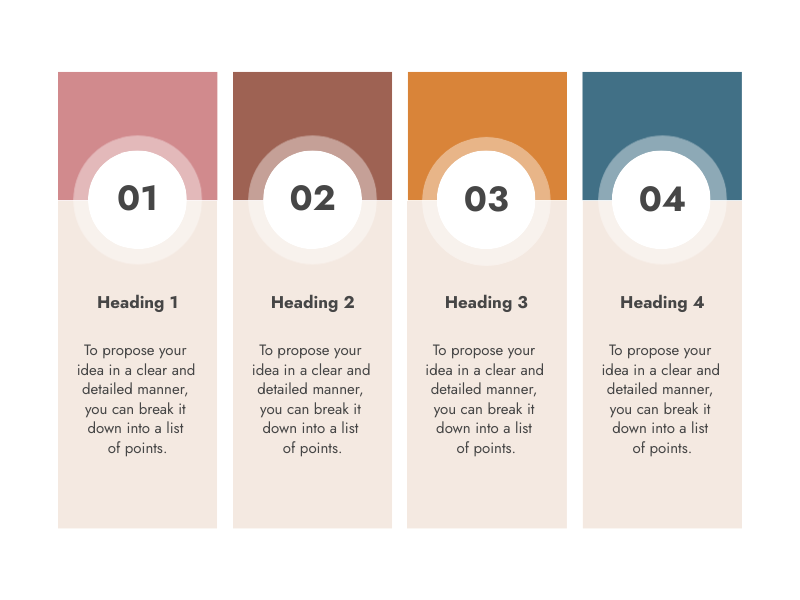
How to create a diagram with AI
1. Describe your diagram
Start with a process, system, workflow, relationship map, lesson concept, or uploaded notes. Add the audience, purpose, tone, and must-have details so Piktochart AI can create a useful first draft.
2. Generate the first visual draft
Piktochart AI turns your prompt or content into an editable diagram with a clear structure and visual direction.
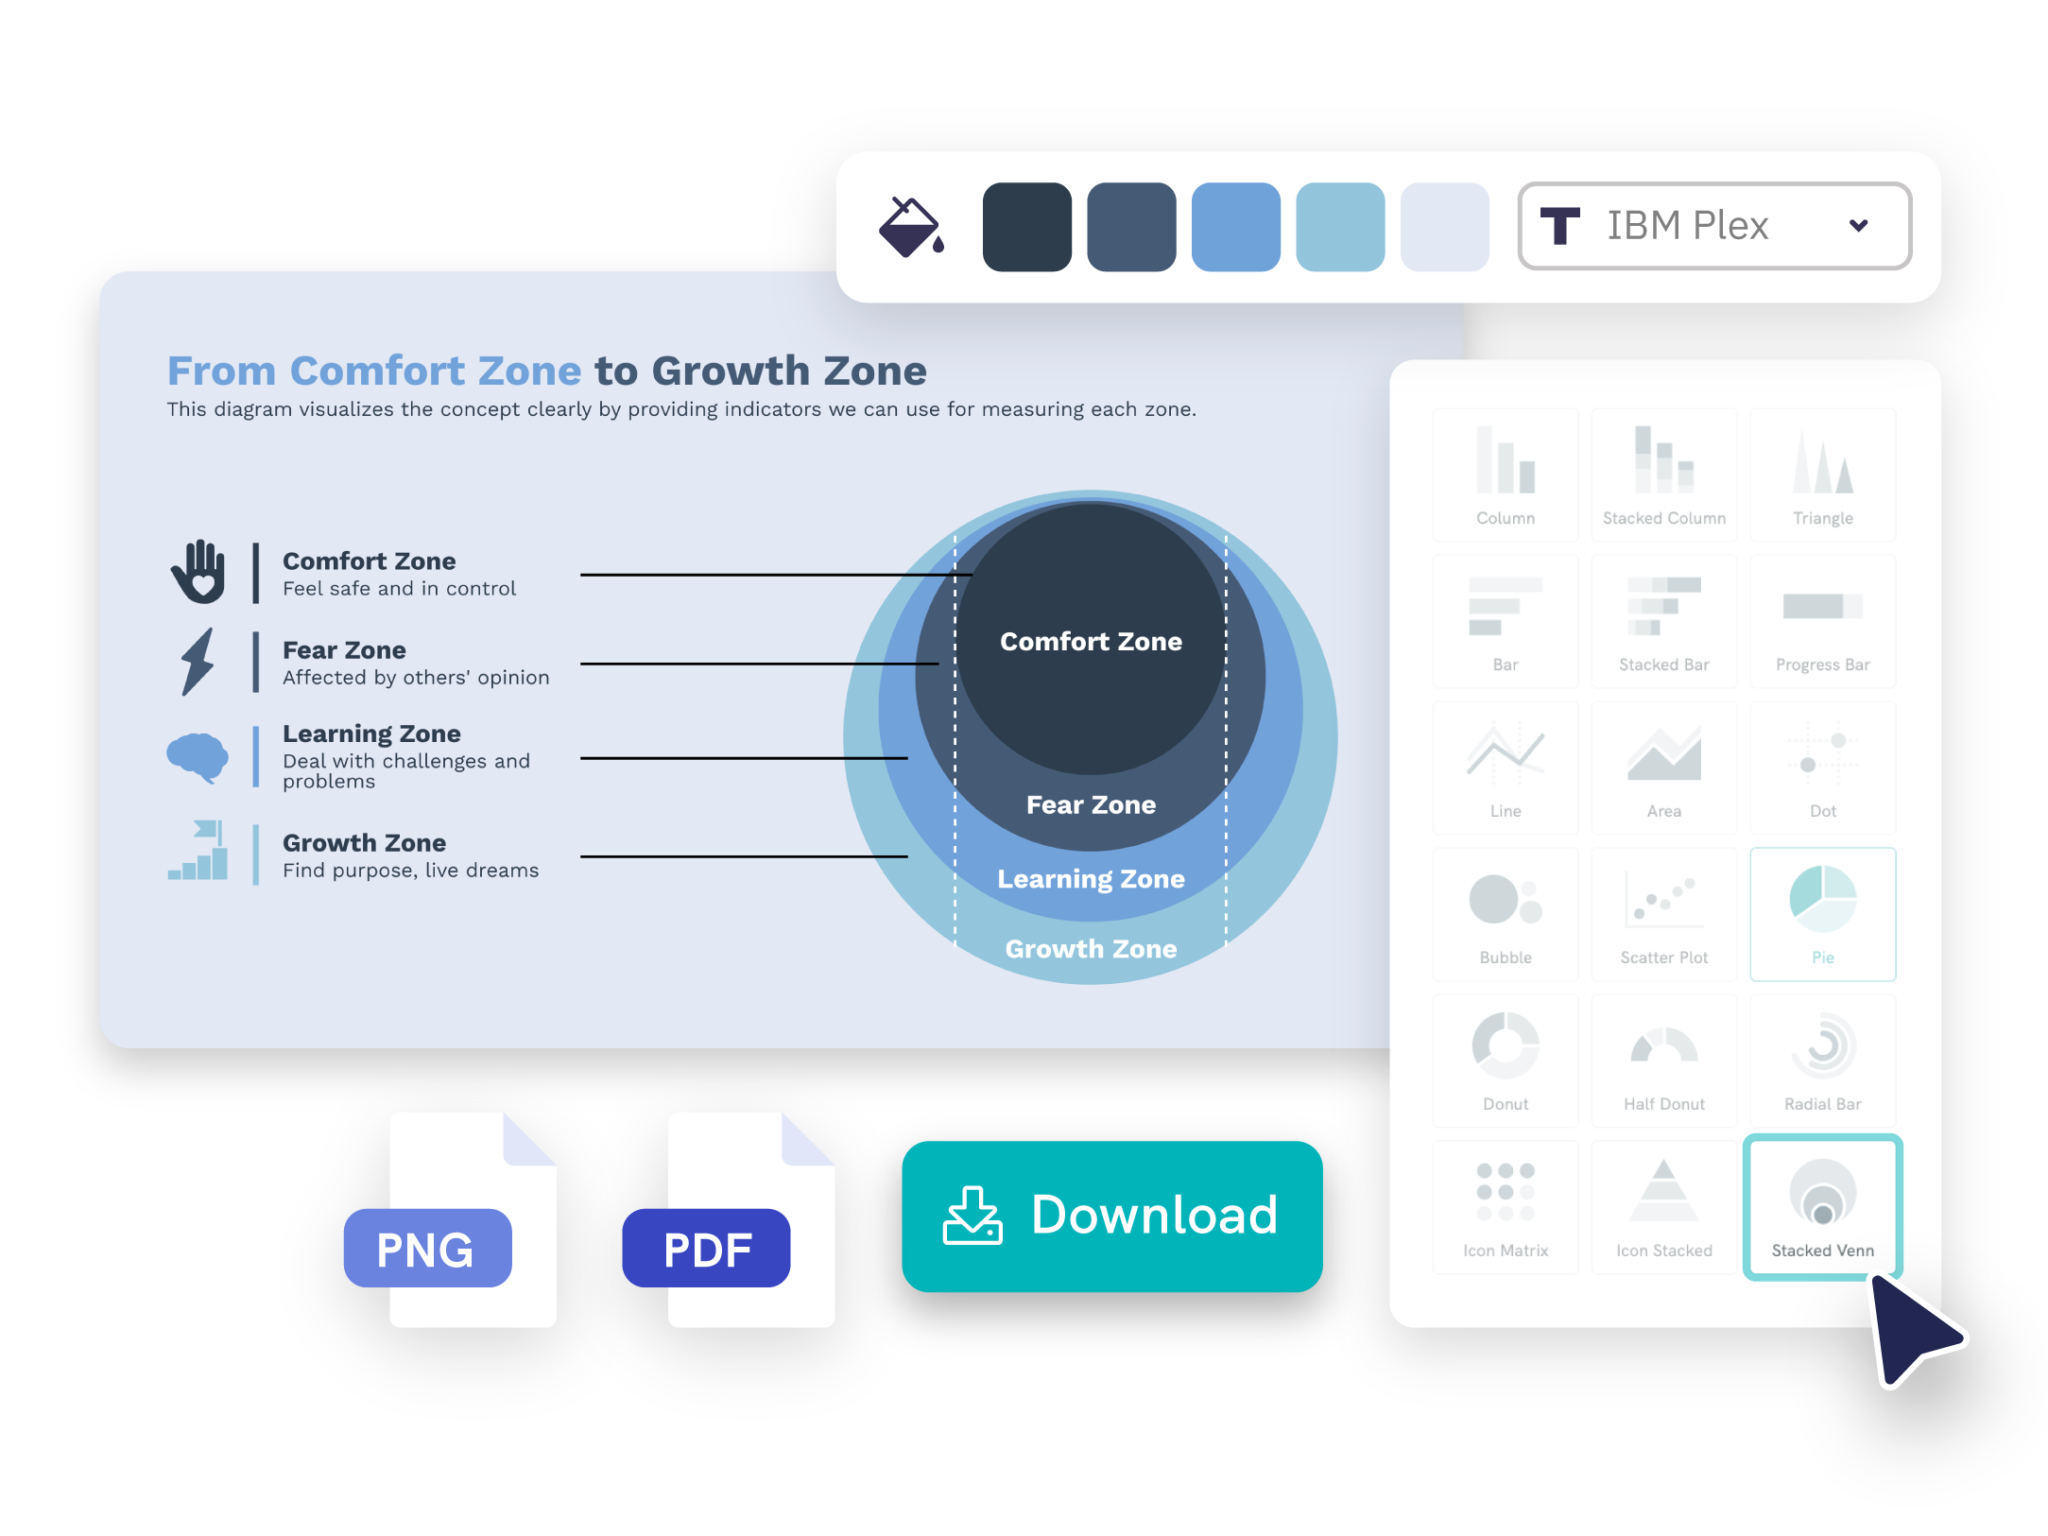
3. Customize the design
Edit copy, colors, fonts, icons, images, sections, and brand details in Piktochart’s editor. Every generated visual remains editable.
4. Share or download
Use the finished diagram in campaigns, presentations, reports, classes, proposals, or team updates. Free accounts include 60 AI credits every month.
What can you create with an AI diagram generator?
Piktochart AI helps you create flowcharts, concept maps, process diagrams, comparison diagrams, learning diagrams, and workflow visuals without starting from a blank canvas.
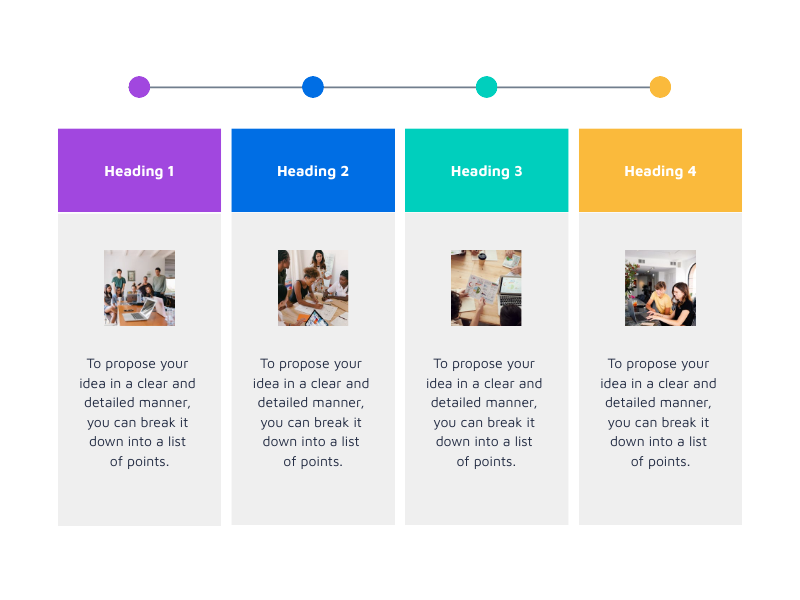
Flowcharts
Generate a first draft for flowcharts from a short prompt, then customize the content, layout, and visuals in Piktochart’s editor.
Concept Maps
Generate a first draft for concept maps from a short prompt, then customize the content, layout, and visuals in Piktochart’s editor.
Process Diagrams
Generate a first draft for process diagrams from a short prompt, then customize the content, layout, and visuals in Piktochart’s editor.
Comparison Diagrams
Generate a first draft for comparison diagrams from a short prompt, then customize the content, layout, and visuals in Piktochart’s editor.
Ready to create diagrams with AI?
Join more than 14 million people who already use Piktochart to turn information into clearer visuals.