Online graph maker to create a graph in minutes
Make a graph for free with no design experience. Trusted by 14 million users, Piktochart is easy and fast. Use a pre-made template to create graphs and charts online without design experience.

14 million people worldwide use Piktochart


Make a Graph and Connect It to Google Sheets
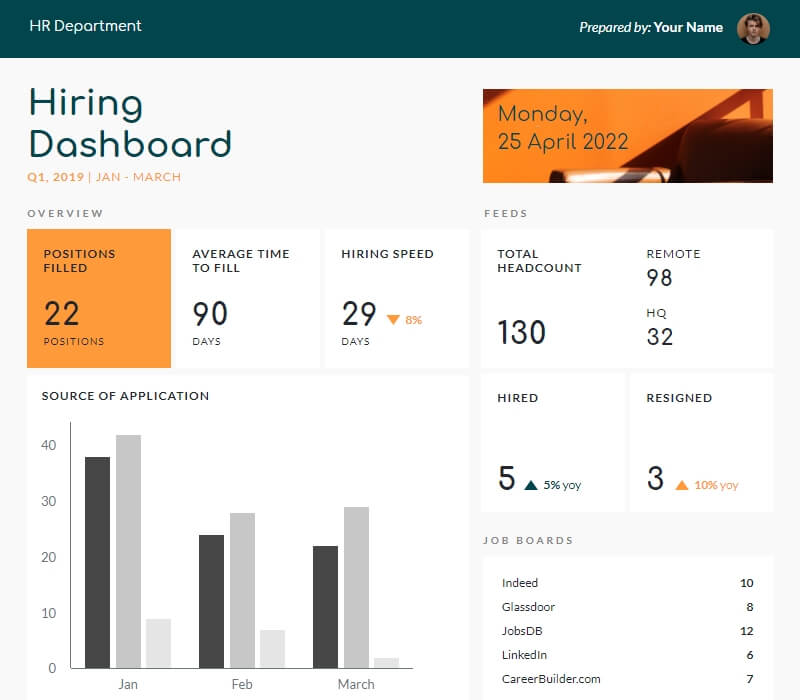
From raw data, you can make a graph online using Piktochart and save time. Link your Excel file or Google spreadsheet to easily create charts that automatically update when your data does. Combine various charts into one page to create a professionally-looking, interactive dashboard ready to be shared with your stakeholders.
Choose from multiple formats, chart types, and free templates that turn a non-designer into a pro.
Create a free account
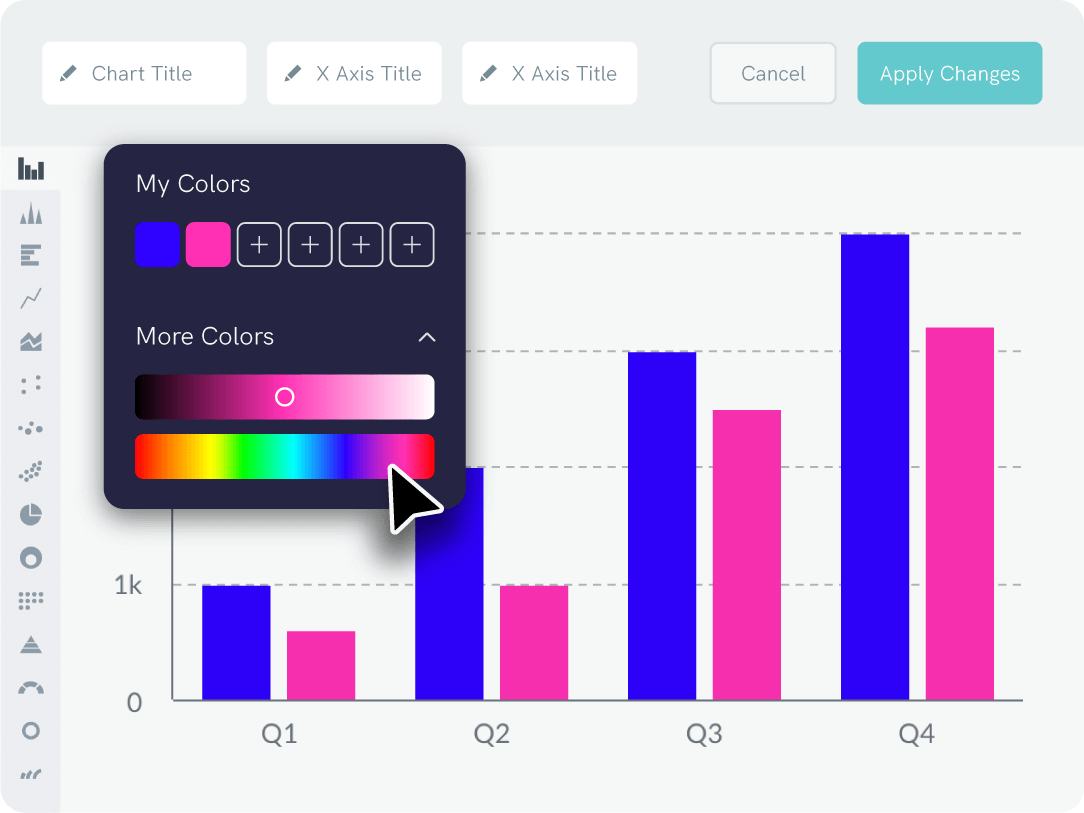
Keep Your Graphs On-brand
Upload, then drag and drop your logo or a screenshot of your website to auto-magically extract your brand colors. Do you want to use your brand fonts? No problem. Your custom color palette and uploaded fonts will always be accessible in the editor.
All graph types have many customization options to make your graphs look how you want. bar graphs, pie charts, diagrams – the gallery includes professionally designed templates for beautiful data visualizations.
Explore Piktochart now
Charts, graphs, and diagrams
Easily Switch Between Different Chart Types
Whether you need diagrams, a line chart, bar chart, pie chart, or any other chart type, the Piktochart gallery has pre-made templates for any format. Enter your data series once and see how your data visualization looks using different charts. If you come back and decide you want to use a different type of chart, you can use our graph maker to change it again.
Sign up for free
Content creation with free templates
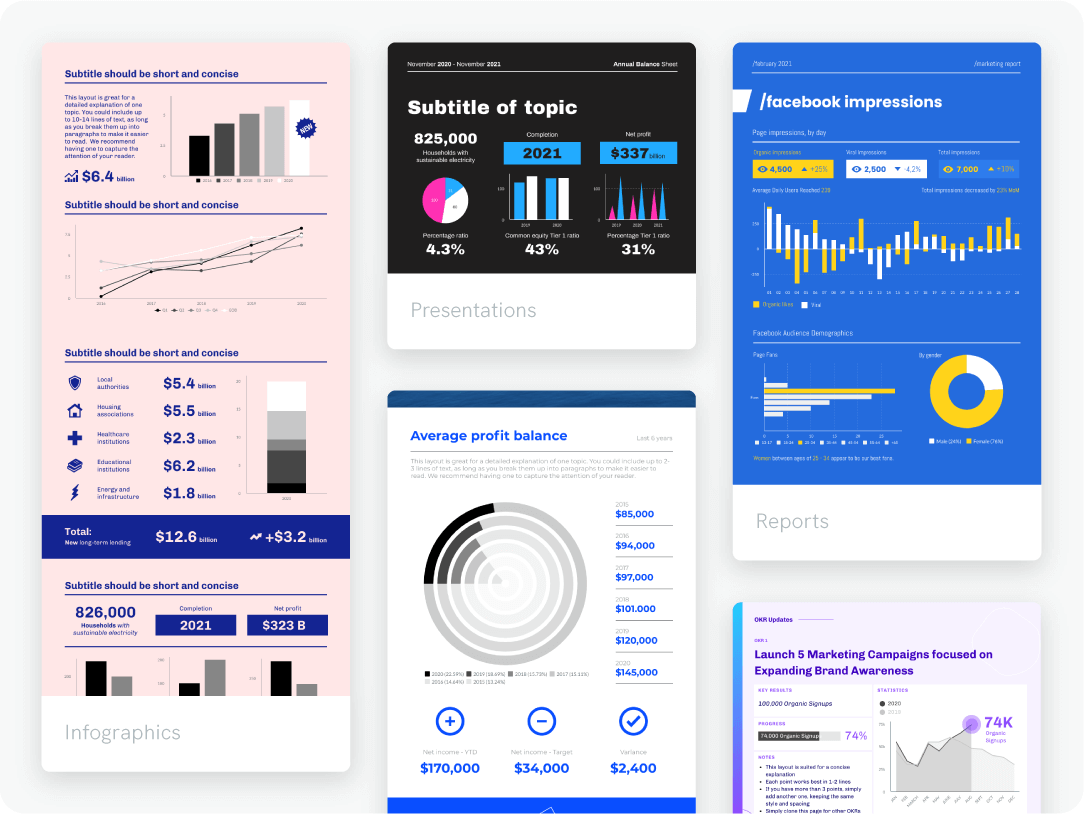
Add Your Graph to Any Format
With our online graph creator, you can easily create reports, presentations, infographics (and more) that will impress your peers. Piktochart is so simple that you can immediately use it without training. Edit a graph template designed by experts or create a graphic from scratch.
Design with the help of a free library of graphics, icons, fonts, and chart templates, upload your own images, and create visuals effortlessly. You can simply add a pie chart, bar chart, or another type of graph to your slides.
Try it now
Create Once, Use Forever
With a team account, there’s no need to spend hours re-creating the same report or chart every week or month. Organize your templates and past projects in folders. Make it easy for anyone on your team to repurpose content on the fly, ultimately saving their time.
Create nowAdd your custom graphs to any template


Testimonials
“Piktochart is my go-to tool when I’m looking for a way to summarize data that is easy for our upper management to review. Piktochart provides me with the tools to display data in a creative, visually appealing way.”
“Piktochart has allowed me to change the style of my company’s communications. The campaigns are more visual, modern and attractive thanks to the templates that always serve as inspiration. Now even my colleagues use it! Piktochart helped me to engage, increase participation in events, add value to internal campaigns and to reinforce the culture and communication flow of my business.”
“As an HR Assistant, I have to find new and creative ways to engage our employees and effectively communicate across a large organization. Piktochart has tremendously helped me in achieving this.”
“Piktochart helps me translate often dry financial policies and accounting standards to easy to understand and concise one-pager visuals for management.”
How to Make a Graph Online
1. Log in
Sign up for the Free plan or log into your Piktochart account.
2. Pick a free template
Pick a graph template made by designers or start from scratch. With our variety of types of graph, we’ve got you well covered.
3. Open the graph maker
Go to Tools and open up Piktochart’s chart maker. You’ll be able to make a graph online.
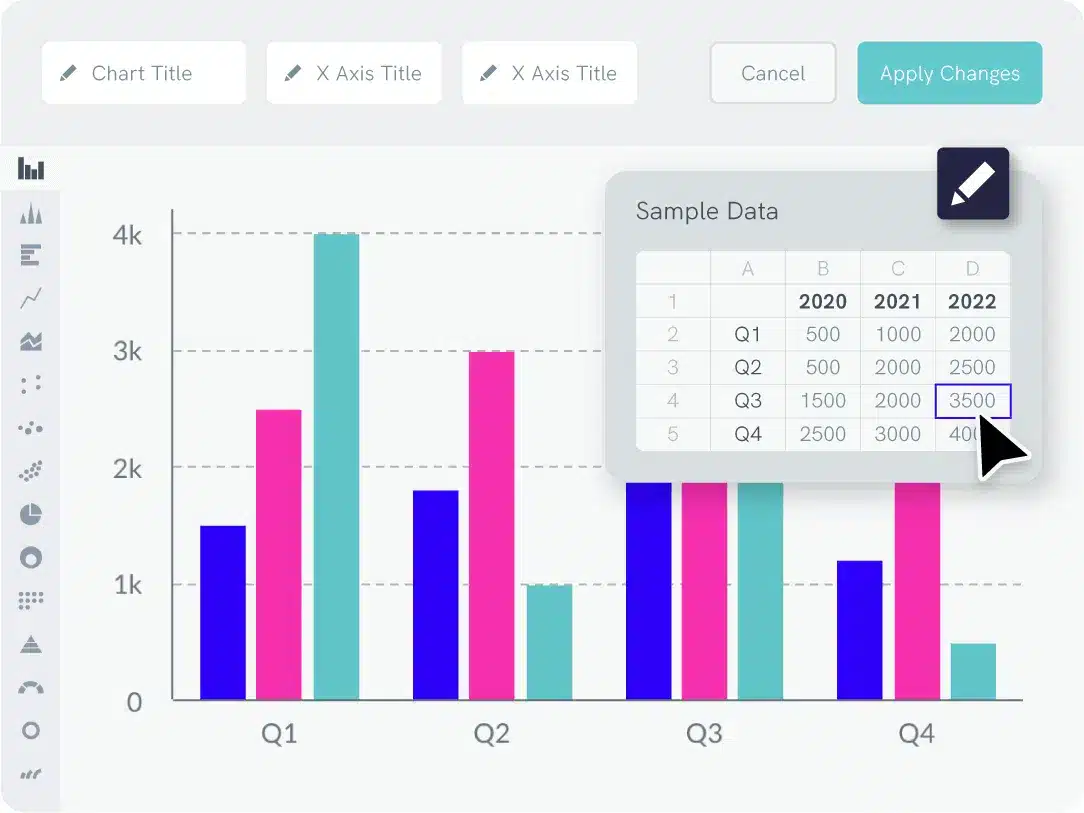
4. Enter your data set
Copy-paste your raw data points into our graph maker, or upload an Excel or CSV file. You can link a Google Sheet to have the data in the graph updated automatically.
5. Customize
Edit one of the templates (choose from different graph types or diagrams) and adjust data labels, x-axis, y-axis, graph title, background color, and more.
6. Download the custom chart or share
Download your graphic as a jpg, png, or pdf file. Alternatively, share your chart online.
Explore More Templates


Visualizing Data With Different Types of Graphs
Line Graph Maker
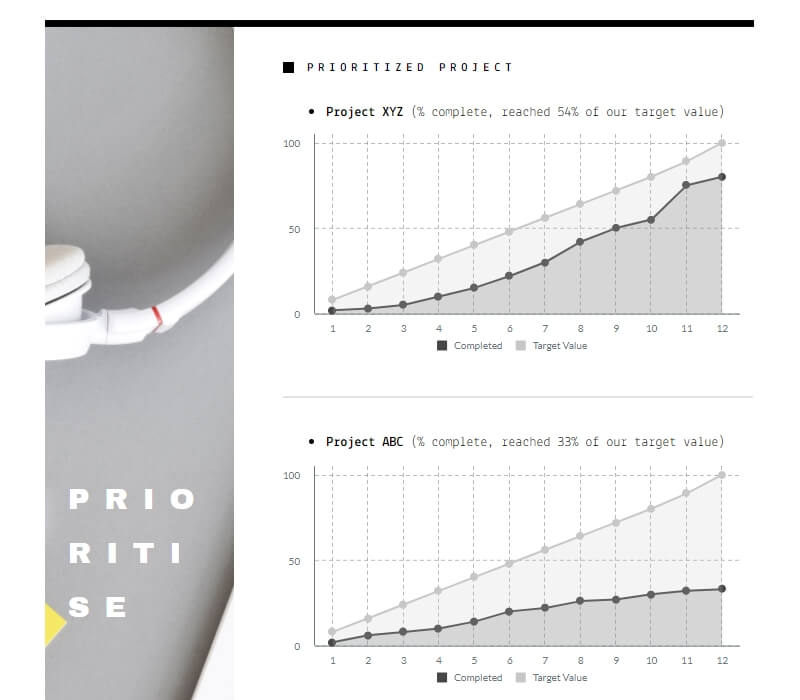
Create line graphs to illustrate information that changes over time. With Piktochart’s graph maker, you can visualize data in seconds. Choose from the gallery of templates, icons, fonts, and images to customize.
Donut Chart Maker
Link up your Excel file or Google Sheet to create donut charts that automatically update in Piktochart. Use different charts in one presentation by using our online graph maker.
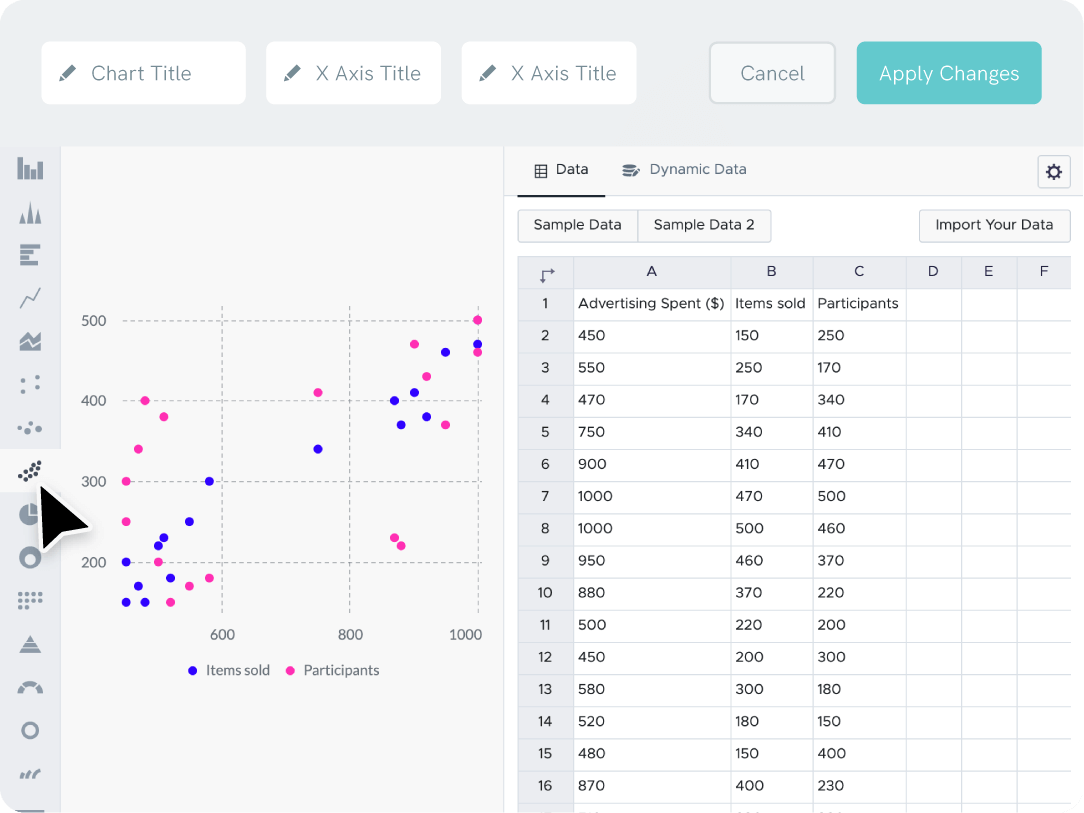
Scatter Plot Maker
Include a scatter plot in your dashboard to translate a data set into a visual story that will grasp your audience’s attention. Add icons and images to chart templates to create professional graphics, and download your work when it’s ready.
Pie Chart Maker
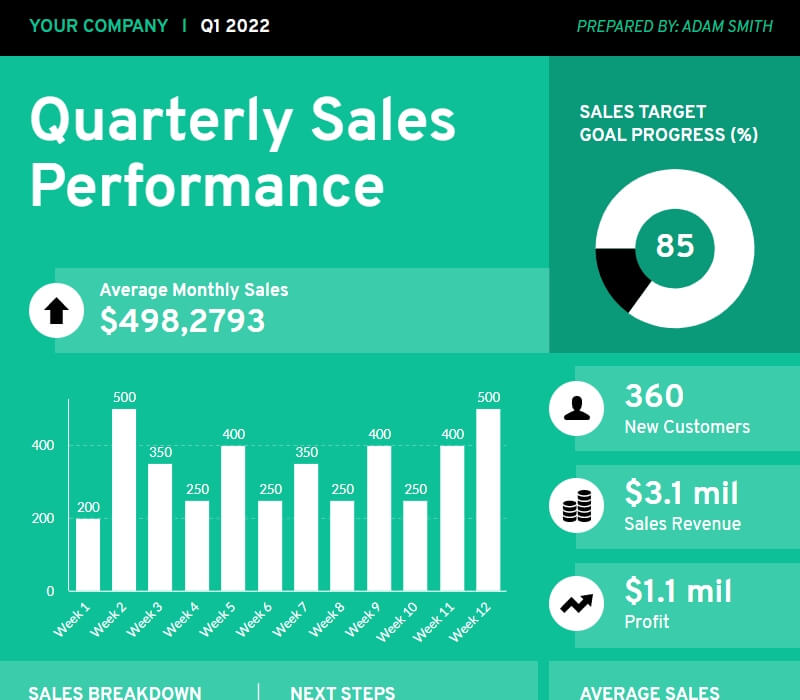
Build a professional, interactive dashboard ready to be shared with your stakeholders, and add a pie chart in your brand colors. You can access free graphs and charts templates that make all your visuals and pie charts beautiful.
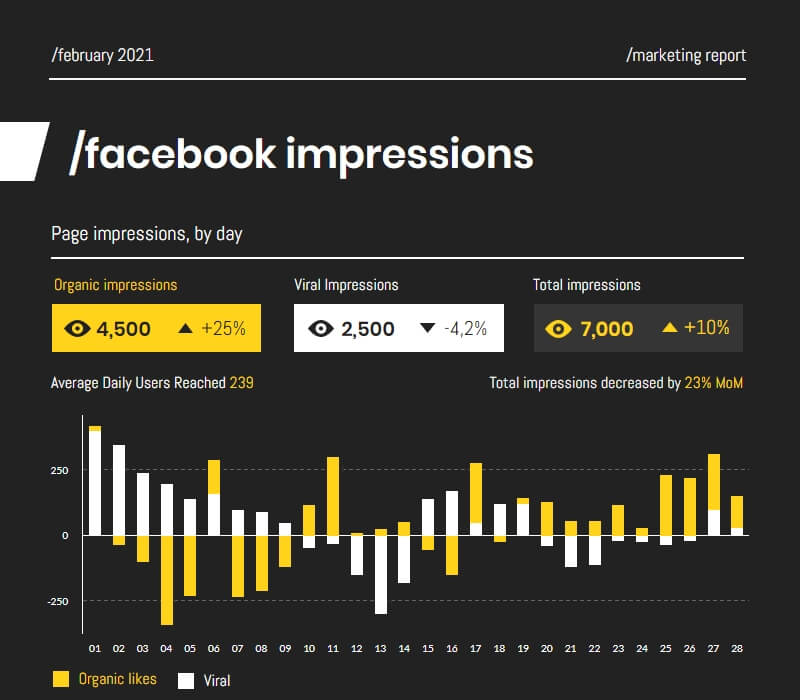
Bar Graph Maker
With Piktochart, you can create reports, presentations and infographics that impress. Use the graph maker to present data in these visuals with no effort.
Comparison Chart Maker
Compare two products or highlight a subject’s pros and cons of a topic with a comparison chart in Piktochart. Choose the colors you prefer and design your visual fast. With our drag-and-drop editor, you’ll make a graph in minutes.
Ready to create graphs in minutes?
Join more than 14 million people who already use Piktochart’s free graph maker.
FAQs
- Bar graphs
- Scatter plots
- Comparison charts
- Line graphs
- Pictograms
- The features offered. The more complex it is, the more flexibility you will have to make a graph.
- Freedom to test the tool by creating custom charts with a trial or free plan.
- Resources to learn the tool and ease of use.
- Value for money. What you get for your paid plan. Graph makers like Piktochart offer storage, downloads, and access to many features. In addition, it does not force its watermark on the visuals users create.