Piktochart Templates Infographics / Data Visualization
Data Visualization Infographics
Design eye-catching infographics effortlessly using our free, customizable templates. No design experience needed – start visualizing your data today!
Create Stunning Data Vizualization Infographics with Piktochart
 Data Visualization
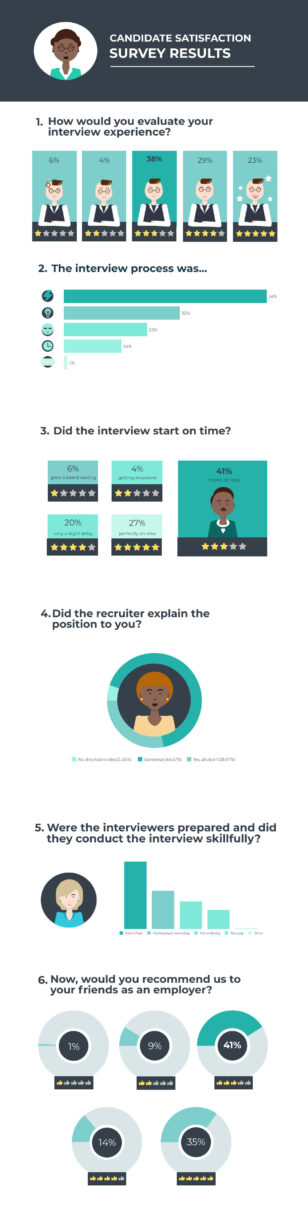
Candidate Experience Survey
Data Visualization
Candidate Experience Survey
 Data Visualization
Social Connection
Data Visualization
Social Connection
 Data Visualization
Scientific Poster
Data Visualization
Scientific Poster
 Data Visualization
Cafe Aesthetic
Data Visualization
Cafe Aesthetic
 Data Visualization
Let me explain
Data Visualization
Let me explain
 Data Visualization
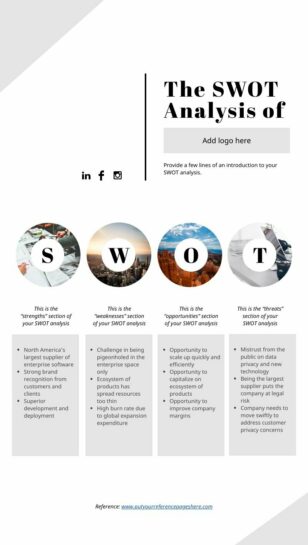
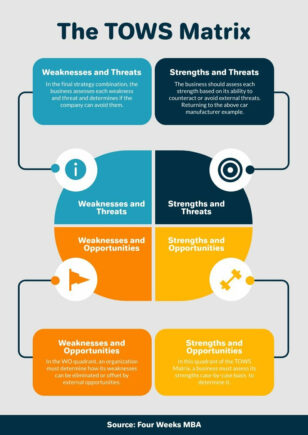
Company SWOT Analysis
Data Visualization
Company SWOT Analysis
 Data Visualization
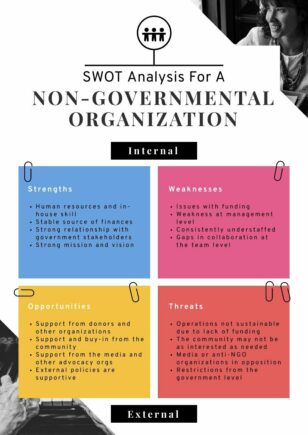
NGO SWOT Analysis
Data Visualization
NGO SWOT Analysis
 Data Visualization
Process Map
Data Visualization
Process Map
 Data Visualization
Healthy Lifestyle Tips
Data Visualization
Healthy Lifestyle Tips
 Data Visualization
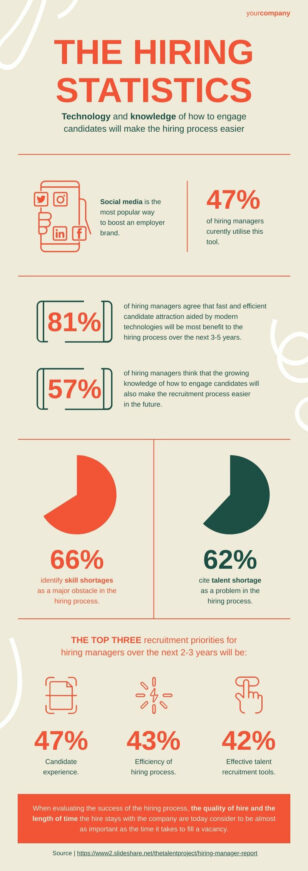
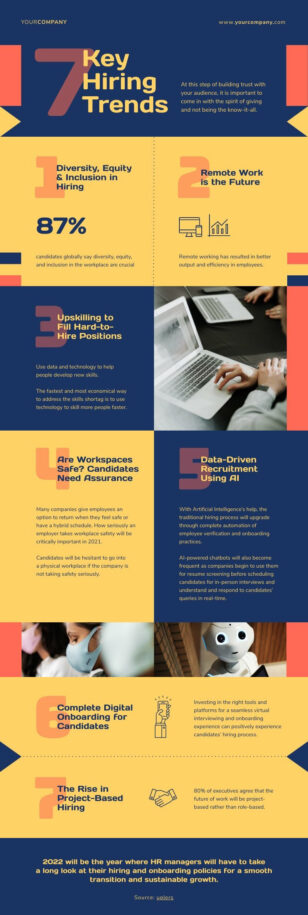
Recruitment Statistics
Data Visualization
Recruitment Statistics
 Data Visualization
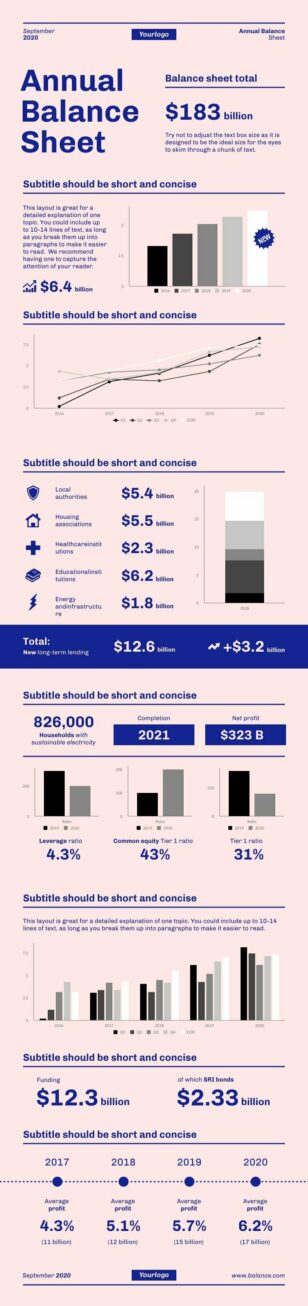
Annual Balance Sheet
Data Visualization
Annual Balance Sheet
 Data Visualization
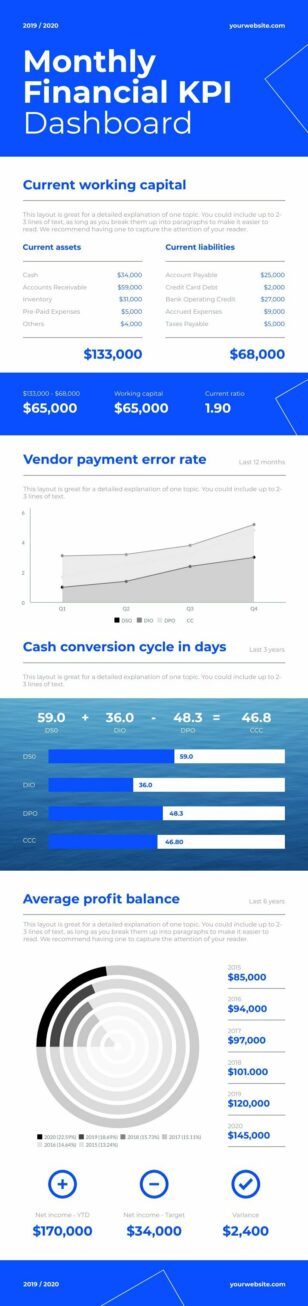
Financial KPI Dashboard
Data Visualization
Financial KPI Dashboard
 Data Visualization
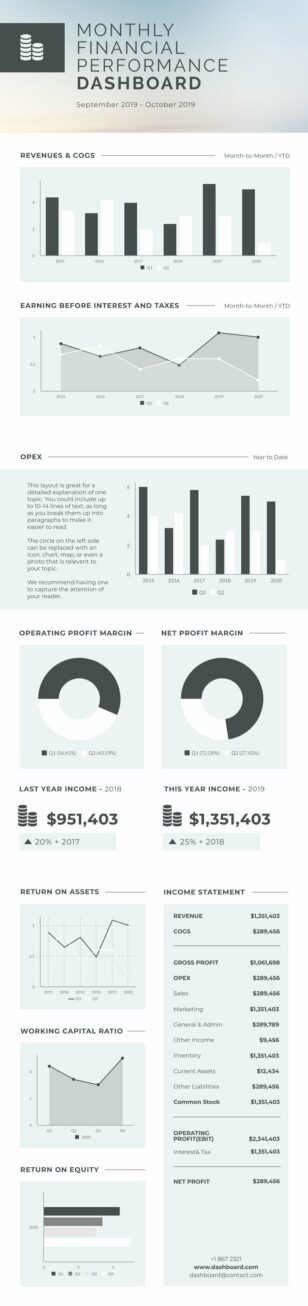
Financial Dashboard
Data Visualization
Financial Dashboard
 Data Visualization
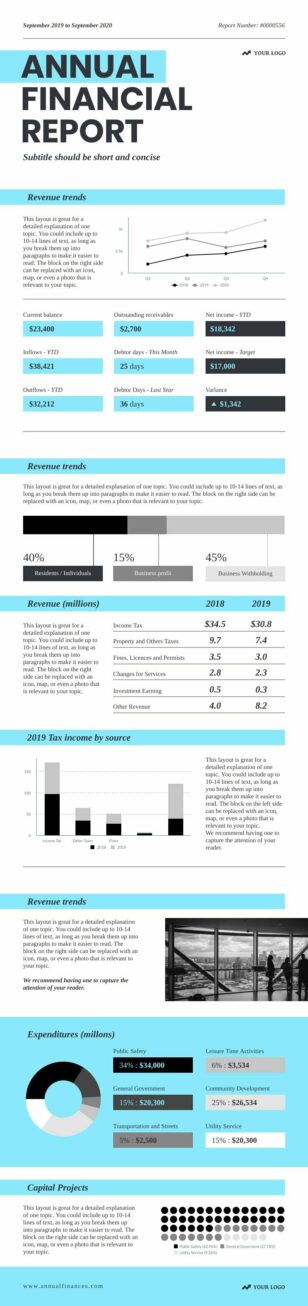
Annual Financial Report
Data Visualization
Annual Financial Report
 Data Visualization
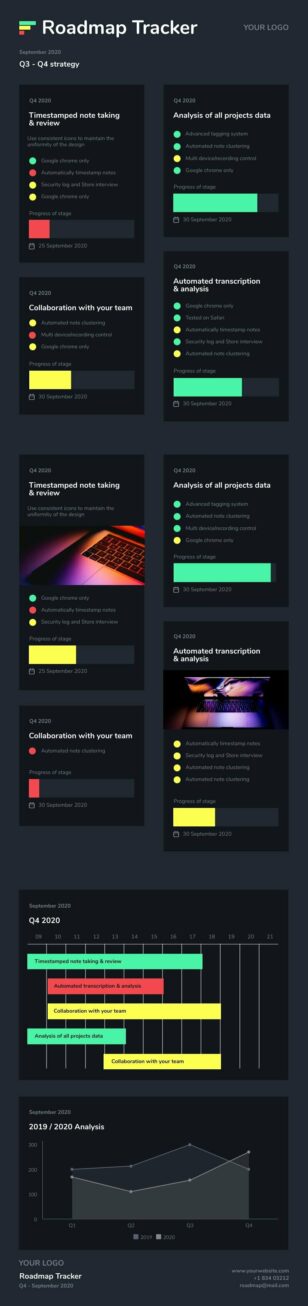
Product Roadmap
Data Visualization
Product Roadmap
 Data Visualization
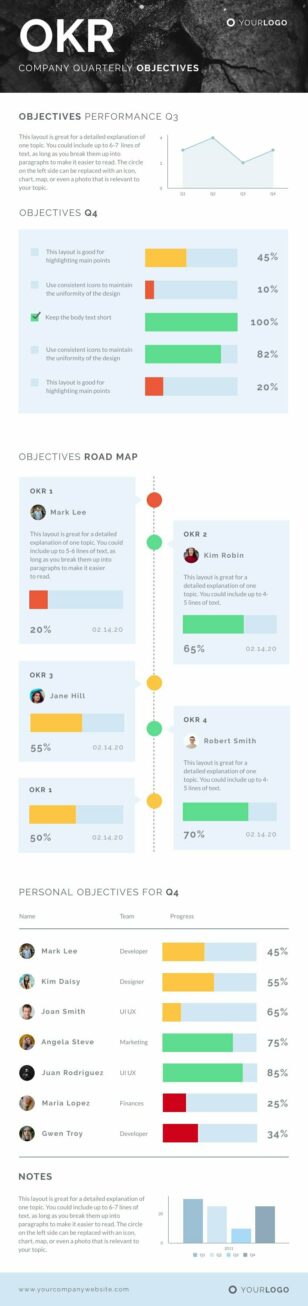
OKR
Data Visualization
OKR
 Data Visualization
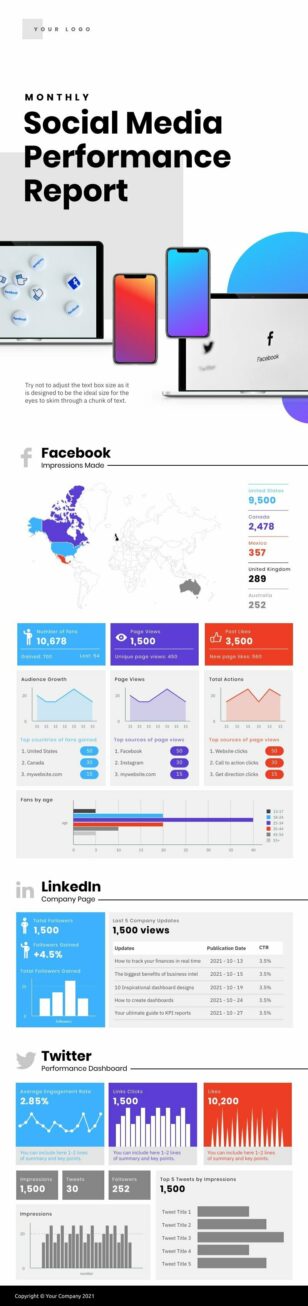
Social Media Performance Report
Data Visualization
Social Media Performance Report
 Data Visualization
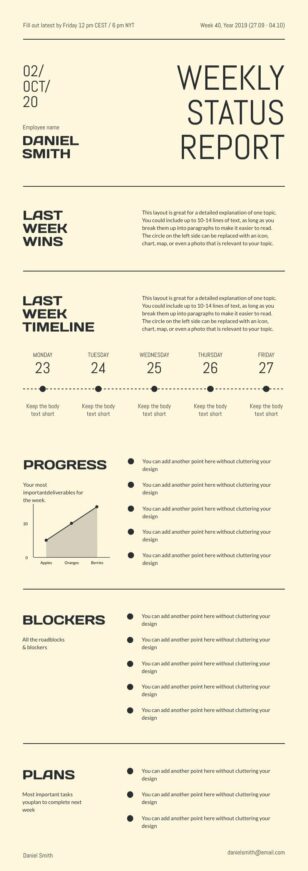
Weekly Status Report
Data Visualization
Weekly Status Report
 Data Visualization
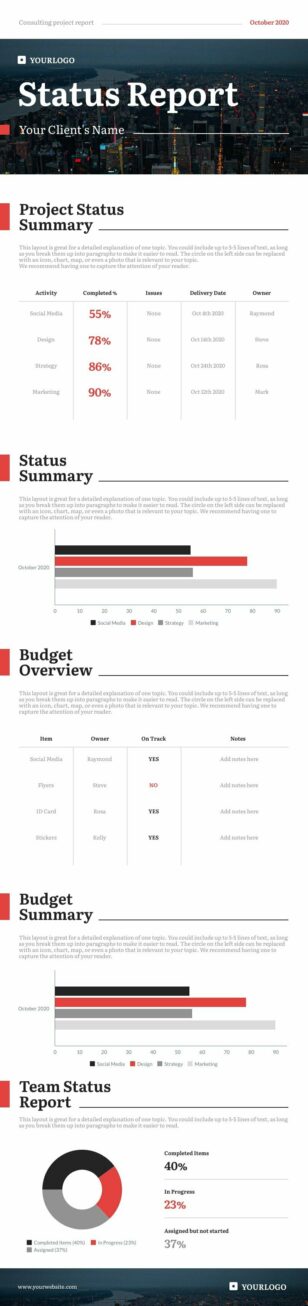
Consulting Report
Data Visualization
Consulting Report
 Data Visualization
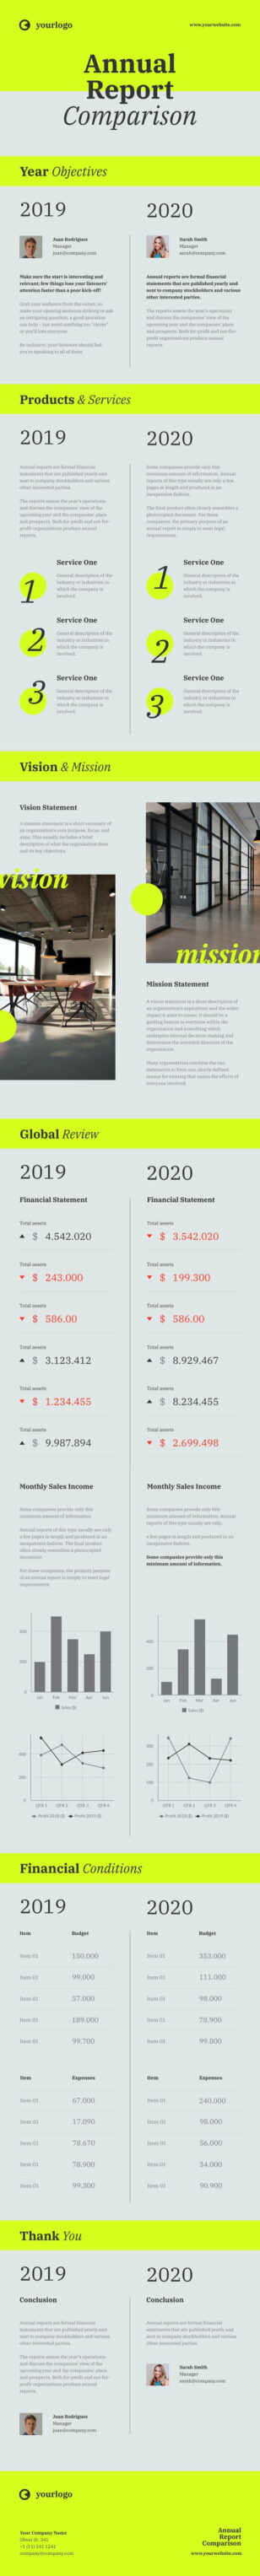
Annual Report Comparison
Data Visualization
Annual Report Comparison
 Data Visualization
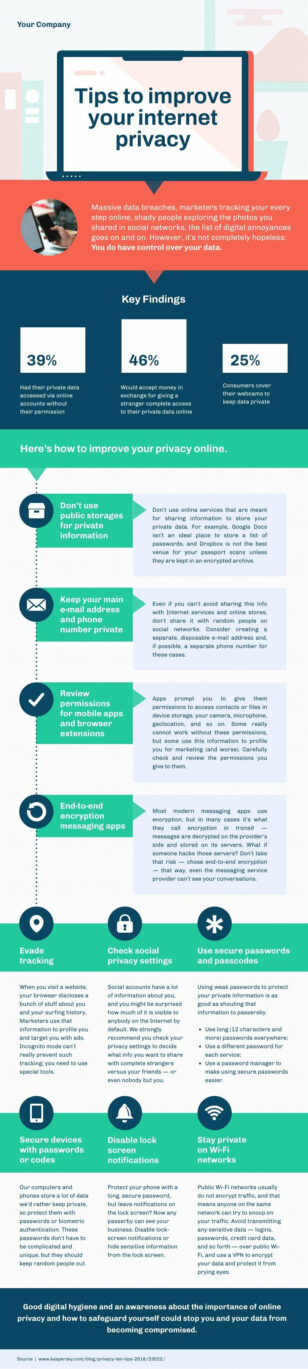
Protect Personal Information
Data Visualization
Protect Personal Information
 Data Visualization
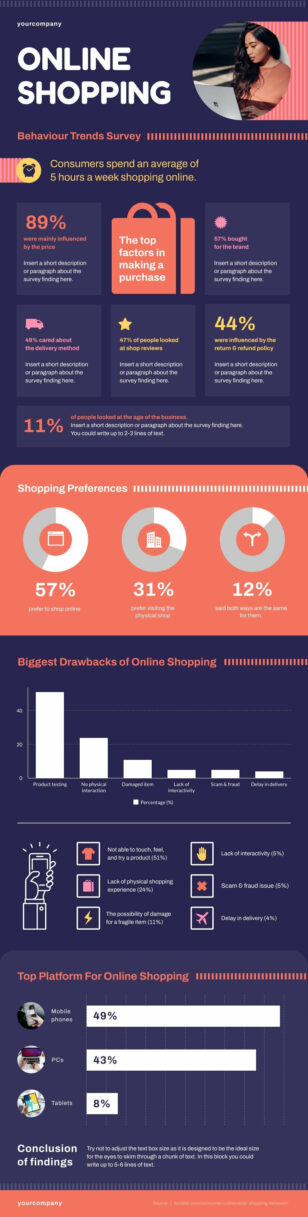
Online Shopping Survey
Data Visualization
Online Shopping Survey
 Data Visualization
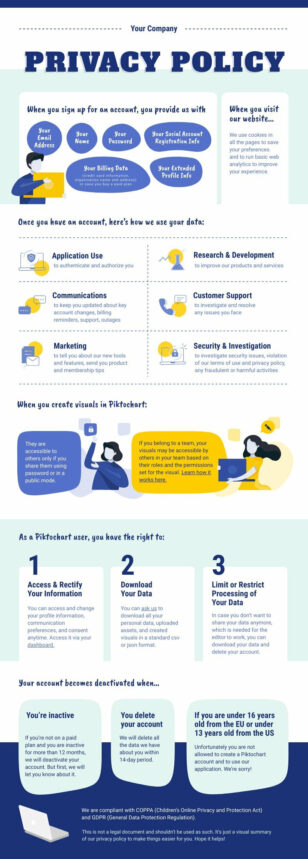
Privacy Protocol
Data Visualization
Privacy Protocol
 Data Visualization
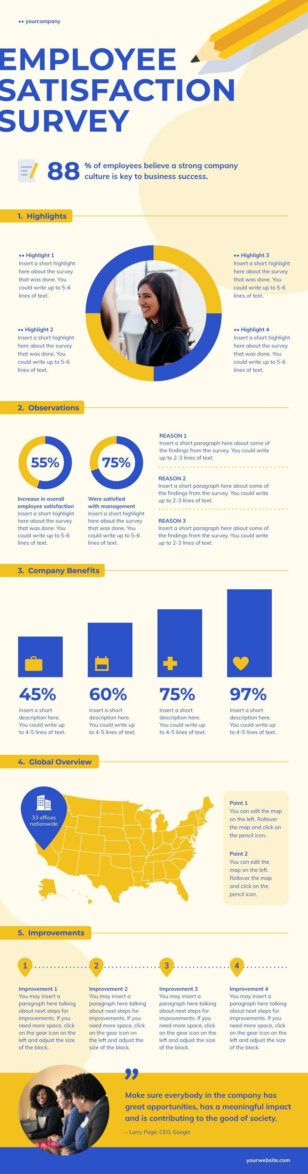
Employee Satisfaction Survey
Data Visualization
Employee Satisfaction Survey
 Data Visualization
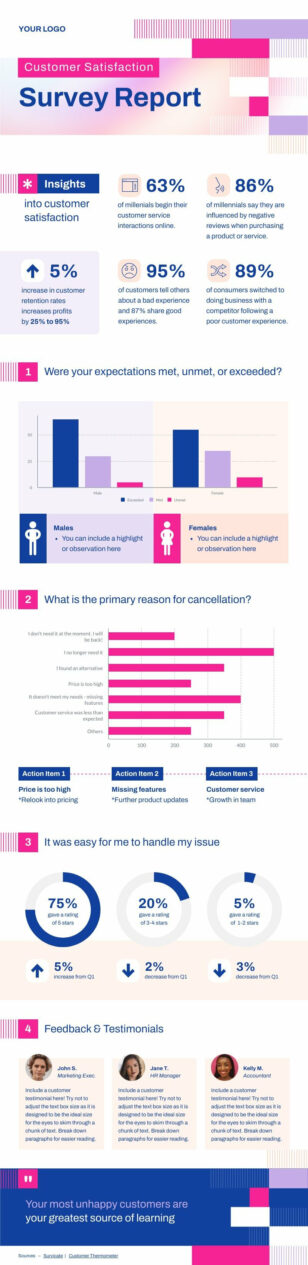
Customer Satisfaction Report
Data Visualization
Customer Satisfaction Report
 Data Visualization
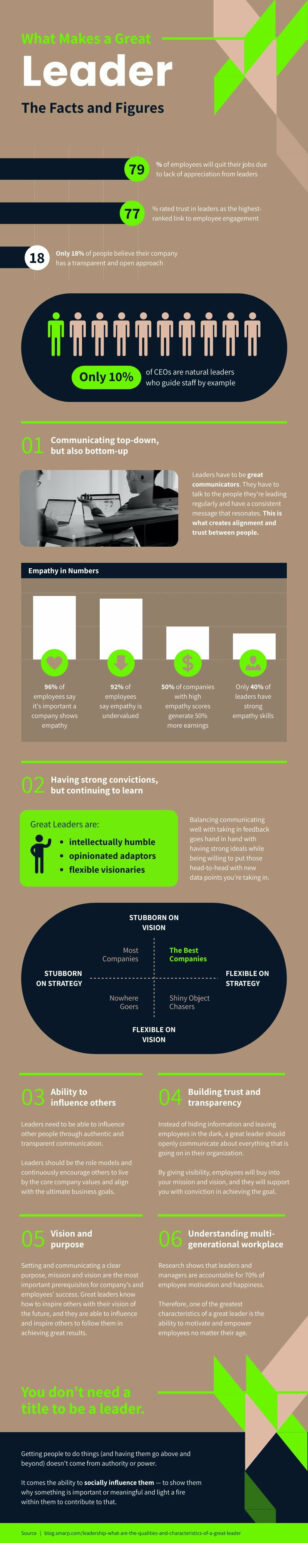
Leadership Statistics
Data Visualization
Leadership Statistics
 Data Visualization
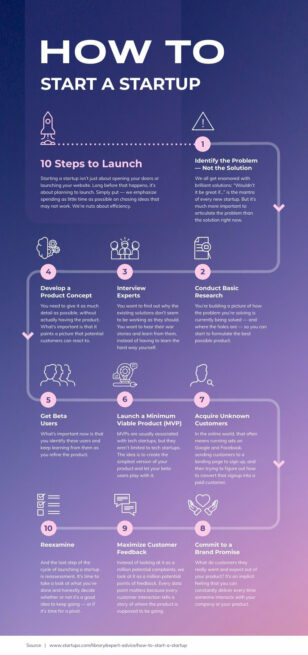
How to Start a Business
Data Visualization
How to Start a Business
 Data Visualization
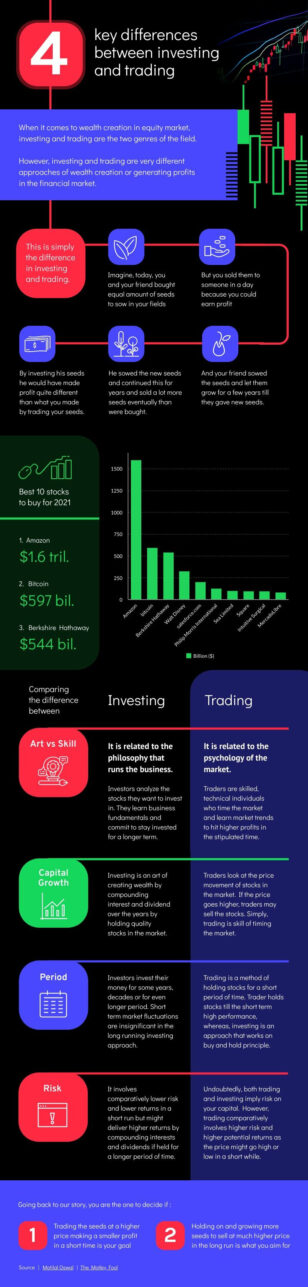
Investing vs Trading
Data Visualization
Investing vs Trading
 Data Visualization
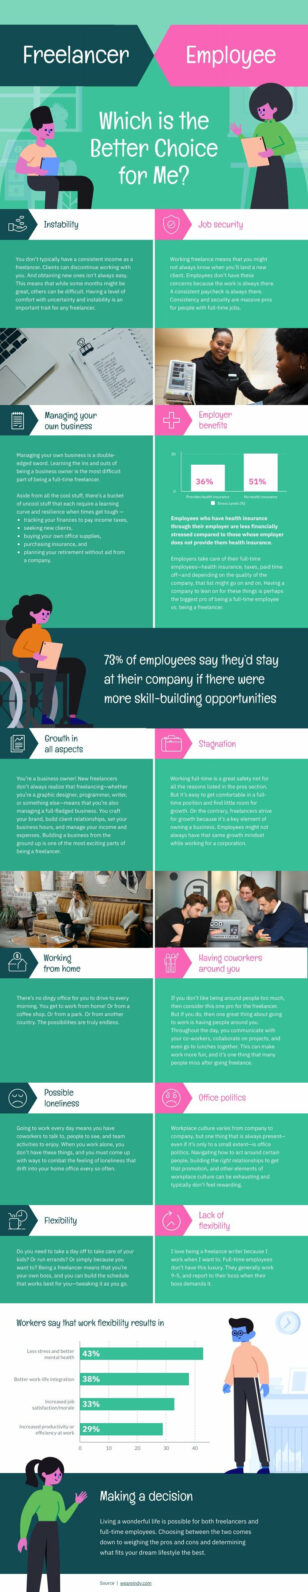
Freelancer vs Employee
Data Visualization
Freelancer vs Employee
 Data Visualization
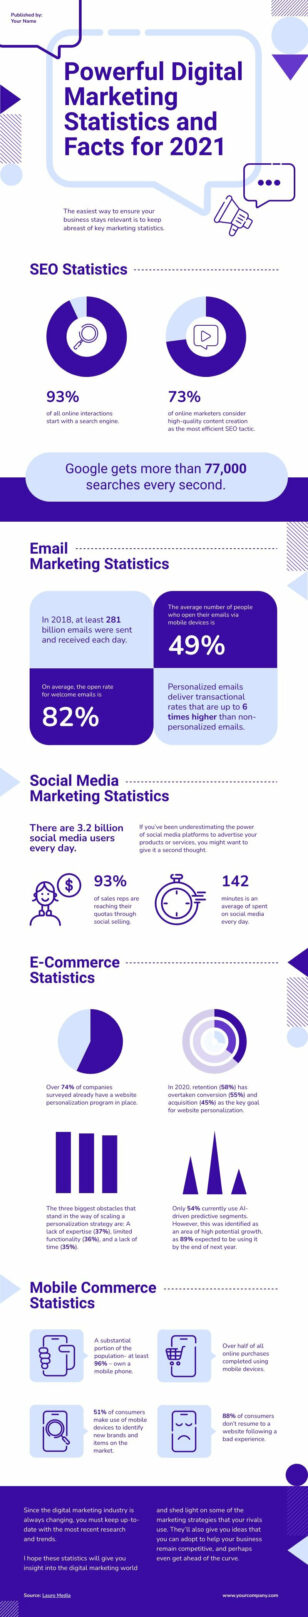
Digital Marketing Facts
Data Visualization
Digital Marketing Facts
 Data Visualization
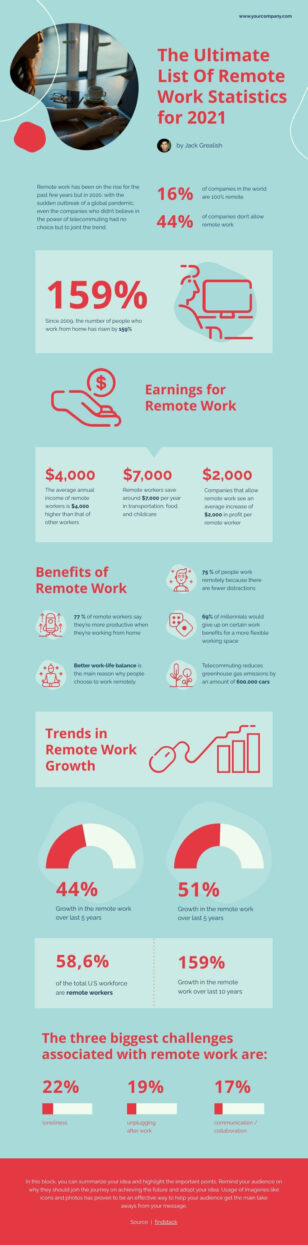
Work From Home Statistics
Data Visualization
Work From Home Statistics
 Data Visualization
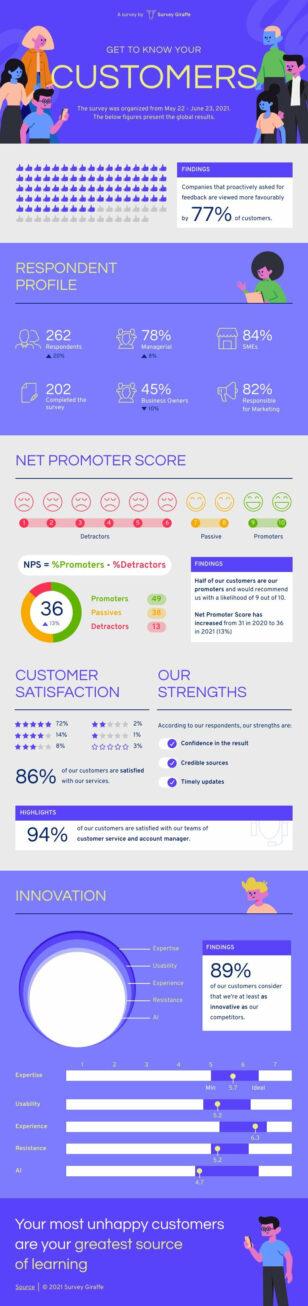
NPS Survey
Data Visualization
NPS Survey
 Data Visualization
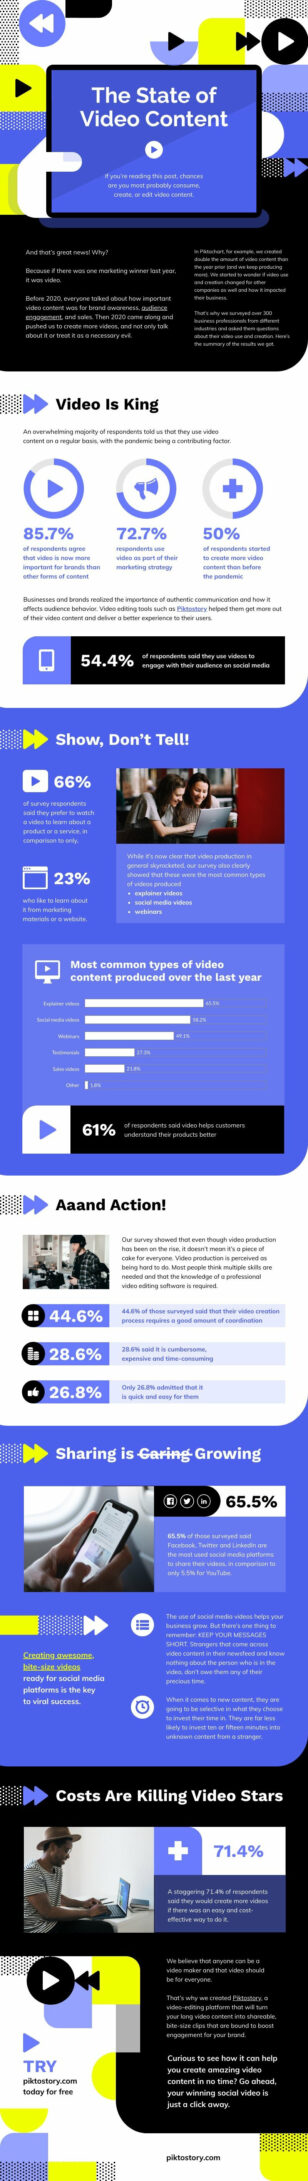
Video Stats
Data Visualization
Video Stats
 Data Visualization
Talent Acquisition
Data Visualization
Talent Acquisition
 Data Visualization
Unemployment Statistics
Data Visualization
Unemployment Statistics
 Data Visualization
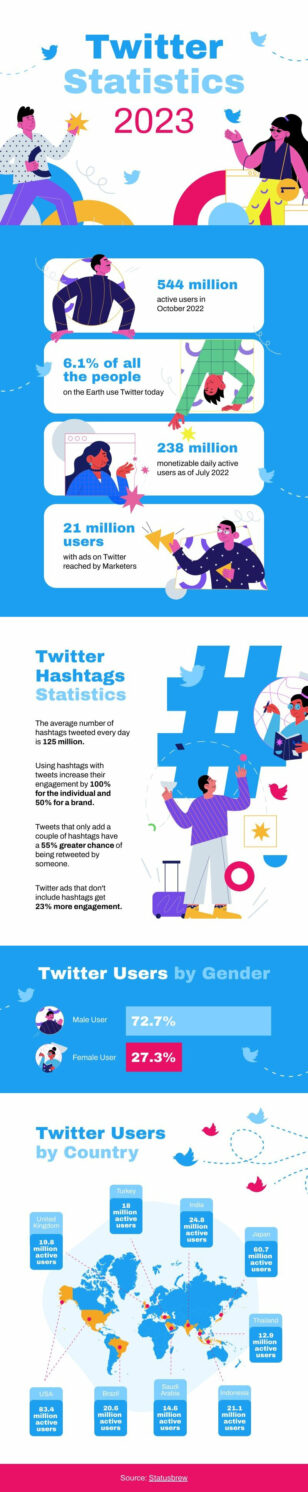
Statistical Infographic
Data Visualization
Statistical Infographic
 Data Visualization
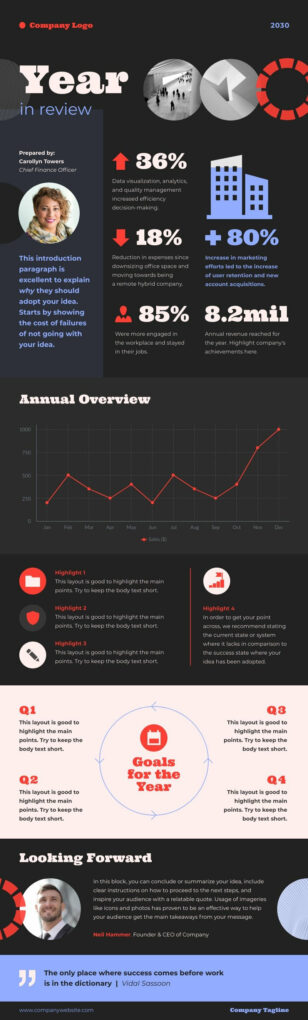
Year In Review
Data Visualization
Year In Review
 Data Visualization
Employee Engagement Survey
Data Visualization
Employee Engagement Survey
 Data Visualization
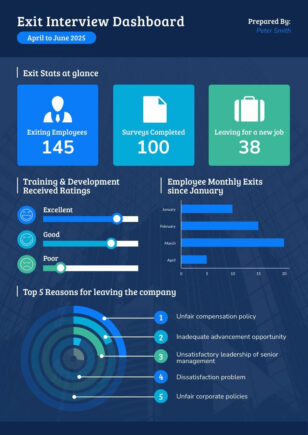
Exit Interview Dashboard
Data Visualization
Exit Interview Dashboard
 Data Visualization
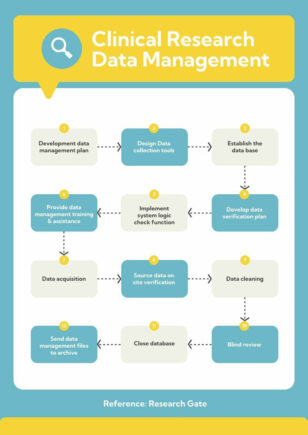
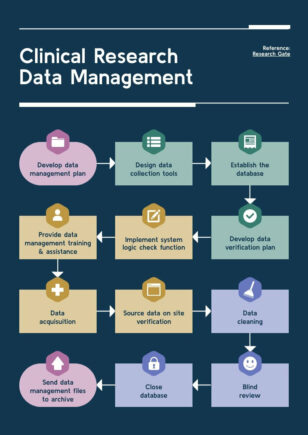
Clinical Research Flowchart
Data Visualization
Clinical Research Flowchart
 Data Visualization
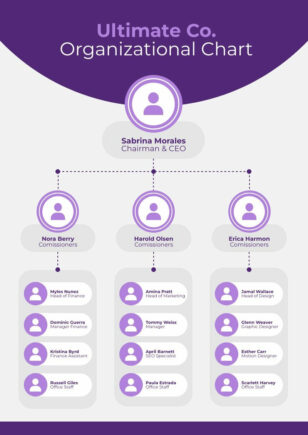
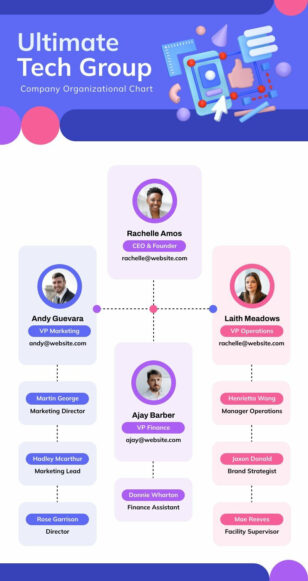
Business Organizational Chart
Data Visualization
Business Organizational Chart
 Data Visualization
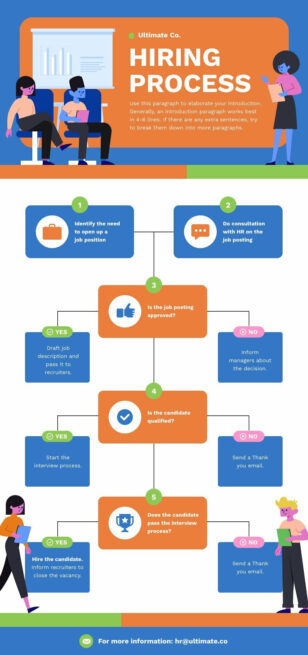
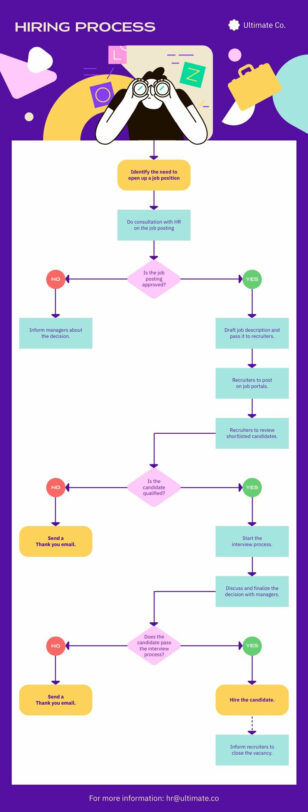
Hiring Process Flowchart
Data Visualization
Hiring Process Flowchart
 Data Visualization
Tech Industry Organizational Chart
Data Visualization
Tech Industry Organizational Chart
 Data Visualization
Flowchart for Hiring Process
Data Visualization
Flowchart for Hiring Process
 Data Visualization
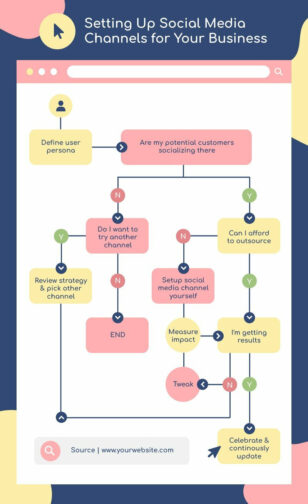
Social Media Flow Diagram
Data Visualization
Social Media Flow Diagram
 Data Visualization
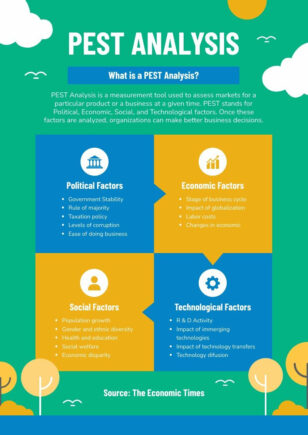
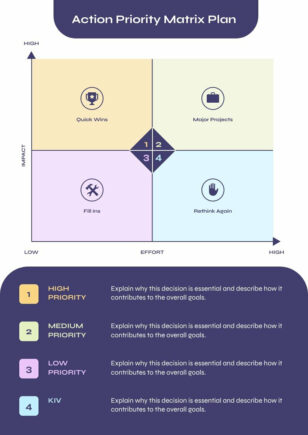
The Four Quadrants
Data Visualization
The Four Quadrants
 Data Visualization
Matrix Quadrant Graph
Data Visualization
Matrix Quadrant Graph
 Data Visualization
Graph Quadrants
Data Visualization
Graph Quadrants
 Data Visualization
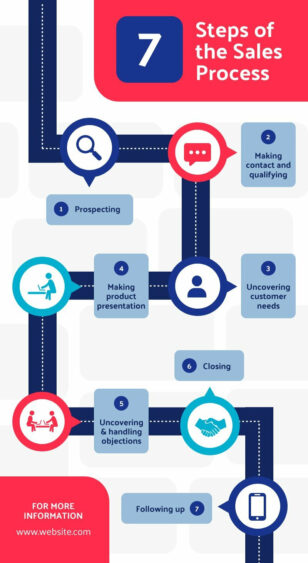
Sales Process Flow Chart
Data Visualization
Sales Process Flow Chart
 Data Visualization
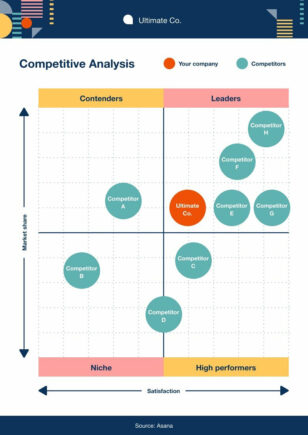
Competitive Analysis Quadrant Graph
Data Visualization
Competitive Analysis Quadrant Graph
 Data Visualization
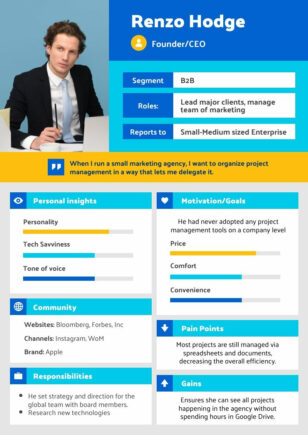
User Persona
Data Visualization
User Persona
 Data Visualization
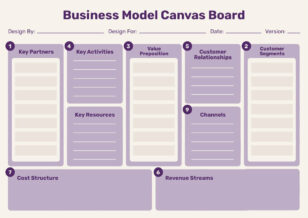
Business Model Canvas Board
Data Visualization
Business Model Canvas Board
 Data Visualization
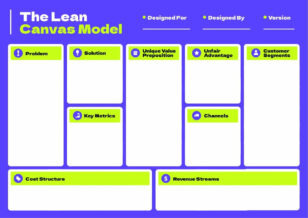
Lean Canvas Model
Data Visualization
Lean Canvas Model
 Data Visualization
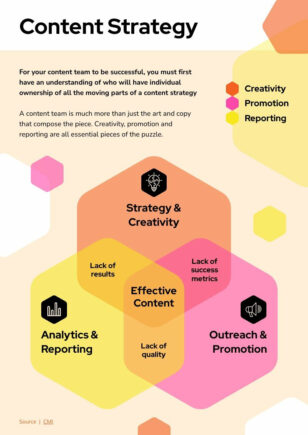
Content Strategy Hexagon Venn Diagram
Data Visualization
Content Strategy Hexagon Venn Diagram
 Data Visualization
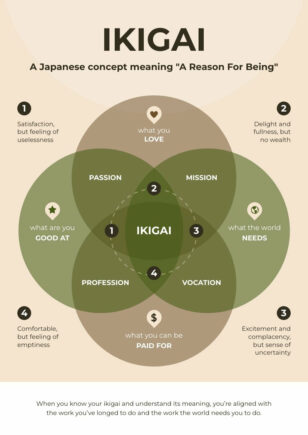
Ikigai 4-Way Venn Diagram
Data Visualization
Ikigai 4-Way Venn Diagram
 Data Visualization
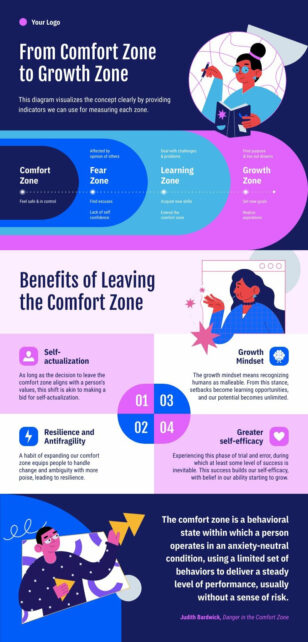
Growth Zone Venn Diagram
Data Visualization
Growth Zone Venn Diagram
 Data Visualization
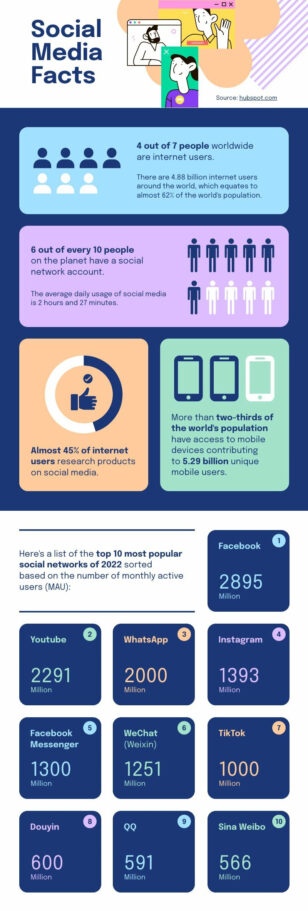
Social Media Facts Pictogram
Data Visualization
Social Media Facts Pictogram
 Data Visualization
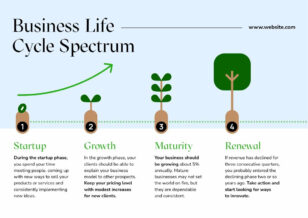
Business Life Cycle Spectrum Pictogram
Data Visualization
Business Life Cycle Spectrum Pictogram
 Data Visualization
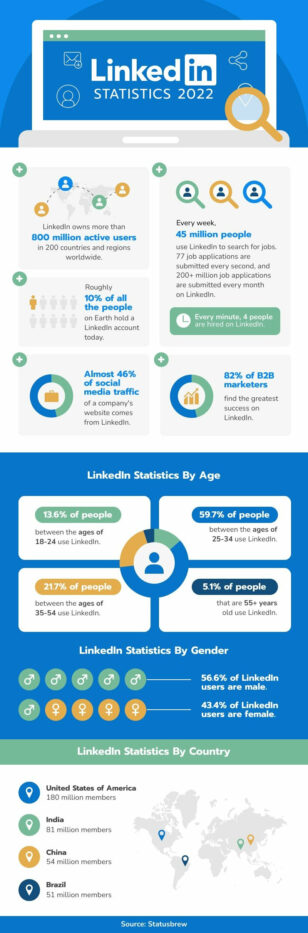
LinkedIn Statistics Pictogram
Data Visualization
LinkedIn Statistics Pictogram
 Data Visualization
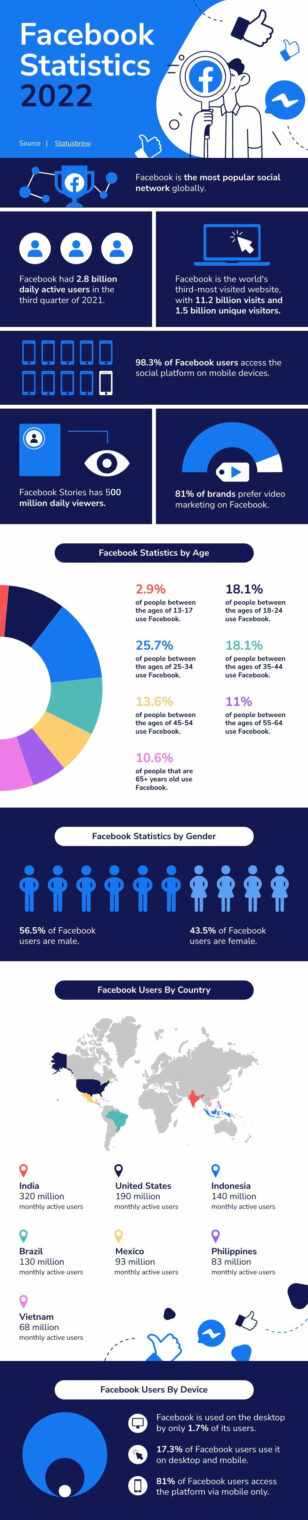
Facebook Statistics Pictogram
Data Visualization
Facebook Statistics Pictogram
 Data Visualization
Workflow Diagram
Data Visualization
Workflow Diagram
 Data Visualization
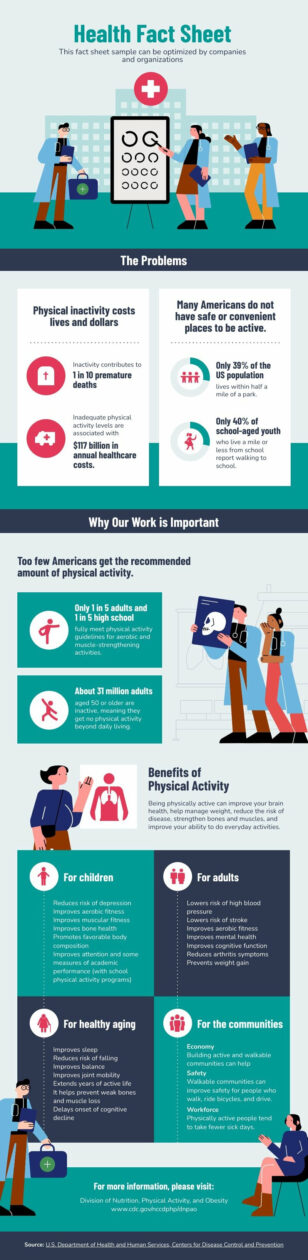
Health Fact Sheet
Data Visualization
Health Fact Sheet
 Data Visualization
Antibiotic Resistance Facts
Data Visualization
Antibiotic Resistance Facts
 Data Visualization
Antibiotic Resistance
Data Visualization
Antibiotic Resistance
 Data Visualization
Infographic Fact Sheet
Data Visualization
Infographic Fact Sheet
 Data Visualization
Modern Infographic Fact Sheet
Data Visualization
Modern Infographic Fact Sheet
 Data Visualization
High School Profile
Data Visualization
High School Profile
 Data Visualization
School Profile
Data Visualization
School Profile
 Data Visualization
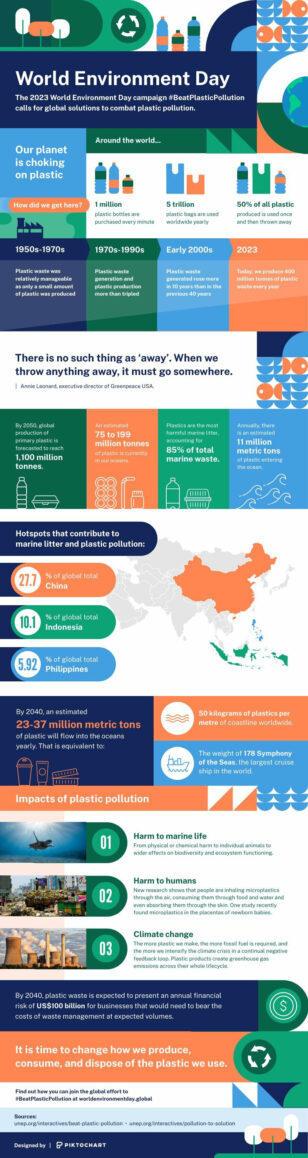
Plastic Pollution
Data Visualization
Plastic Pollution
 Data Visualization
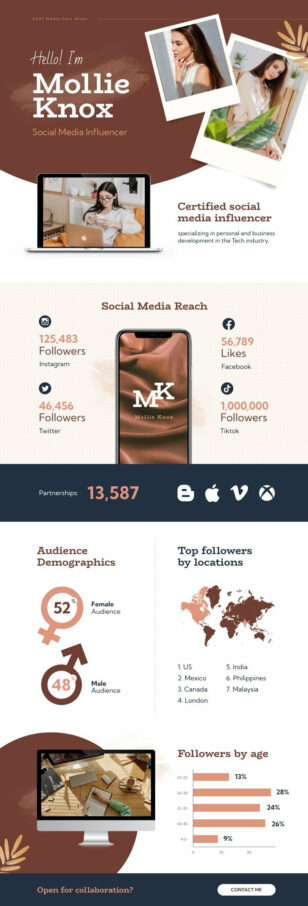
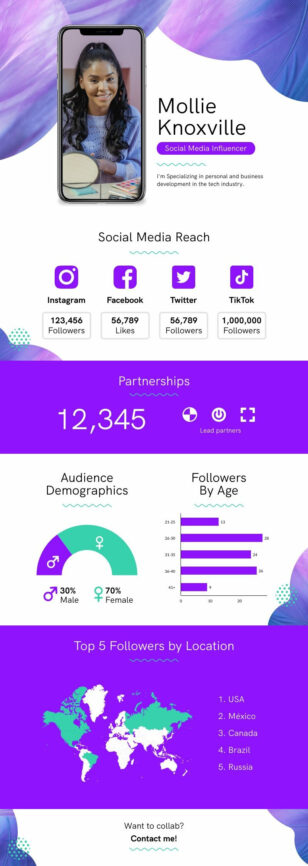
Social Media Infographic
Data Visualization
Social Media Infographic
 Data Visualization
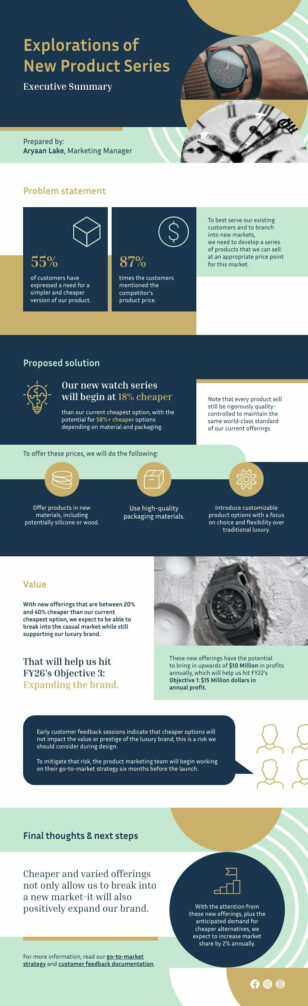
Summary Infographic
Data Visualization
Summary Infographic
 Data Visualization
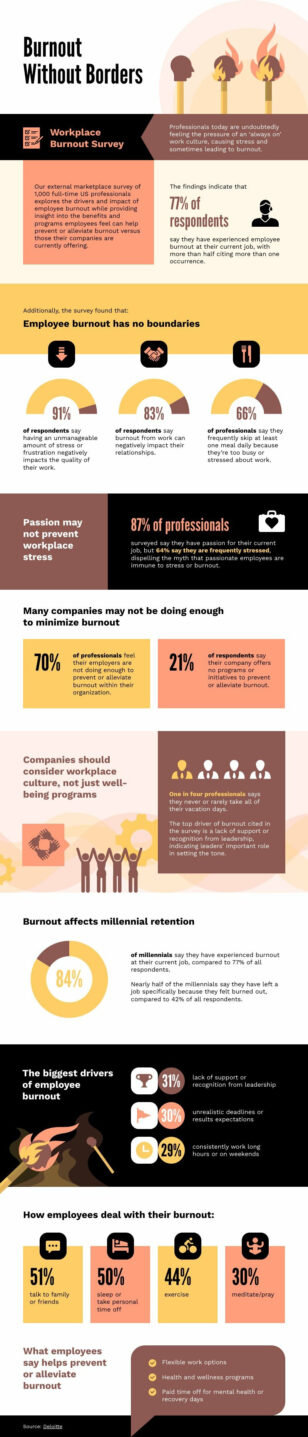
Modern Survey Report
Data Visualization
Modern Survey Report
 Data Visualization
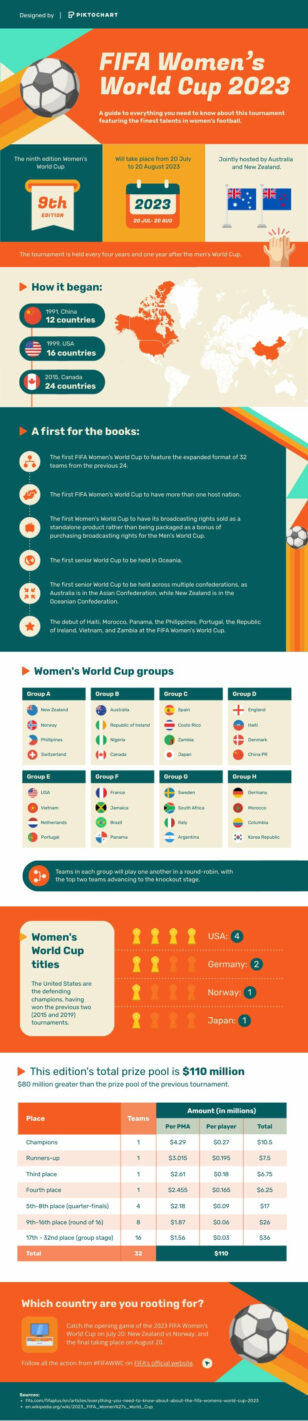
FIFA Women’s World Cup
Data Visualization
FIFA Women’s World Cup
 Data Visualization
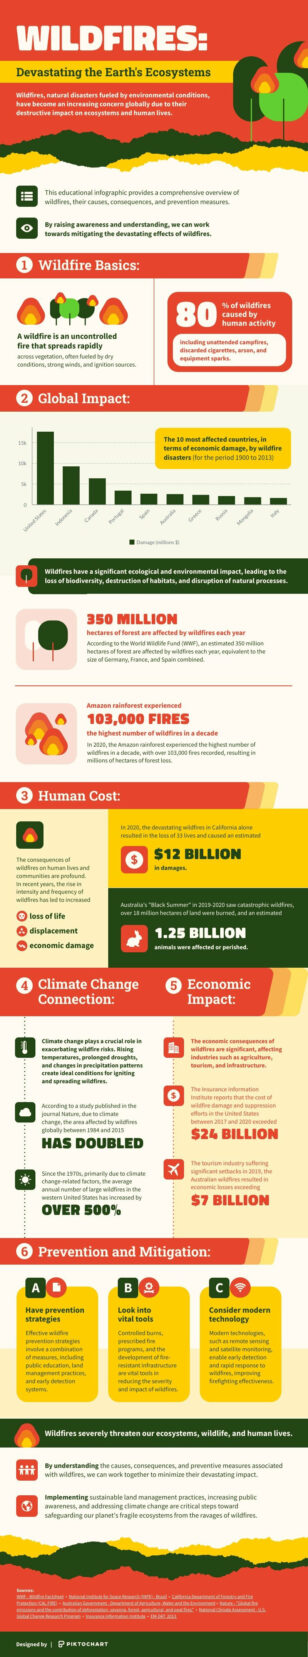
Facts About Wildfires
Data Visualization
Facts About Wildfires
Create Stunning Data Vizualization Infographics with Piktochart
“The ability to take data—to be able to understand it, to process it, to extract value from it, to visualize it, to communicate it—that’s going to be a hugely important skill in the next decades.” – Hal Varian, Chief Economist at Google.
Having data is the first step, but being able to extract information from it is the next big step towards taking action. That’s why we created a library of data visualization infographic templates designed for effortless customization. Our user-friendly platform allows anyone to create professional-looking infographics without graphic design expertise. Whether you’re presenting business statistics, survey results, or complex data sets, our templates provide the perfect starting point.
Each template is fully editable, allowing you to adjust colors, fonts, and layouts to match your brand or personal style. With our intuitive drag-and-drop interface, you can easily add charts, graphs, icons, and images to bring your data to life. From simple bar graphs to complex multi-layered visualizations, Piktochart helps you communicate your insights clearly and effectively.
Start creating impactful data visualizations today with Piktochart’s free infographic templates. Transform raw numbers into compelling visual stories that engage your audience and make your data memorable.