Piktochart Templates Infographics / Comparison
Comparison Infographics
Transform complex information into clear, engaging visuals with our diverse comparison infographic templates. No design skills needed—start creating for free today.
Comparison Infographics
 Comparison
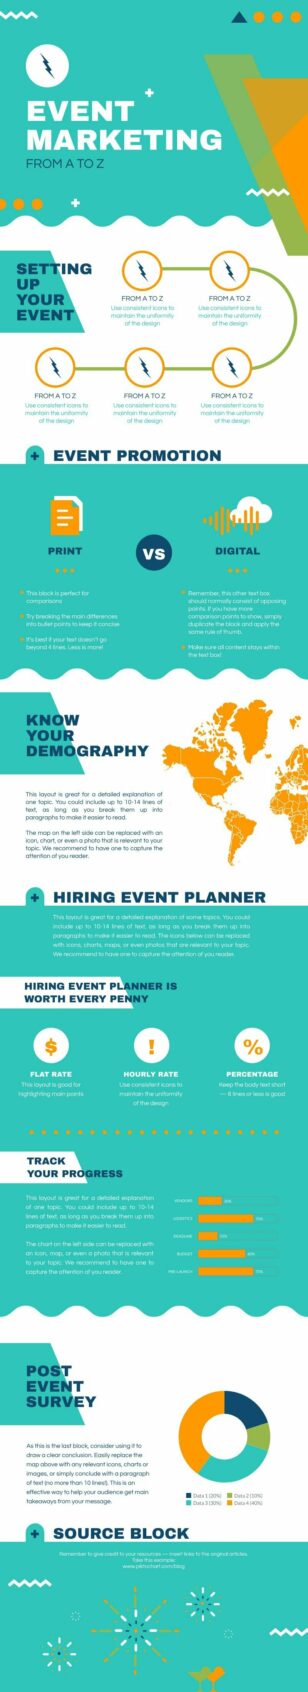
Experiential Marketing Plan
Comparison
Experiential Marketing Plan
 Comparison
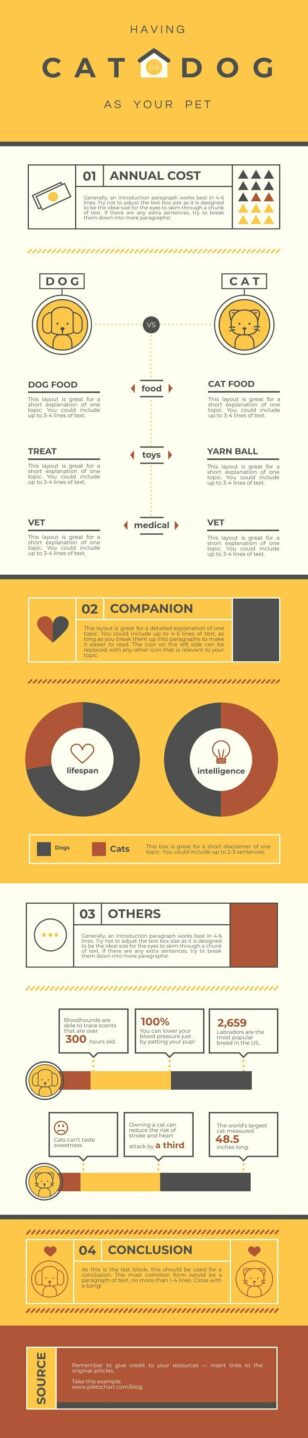
Cats and Dogs
Comparison
Cats and Dogs
 Comparison
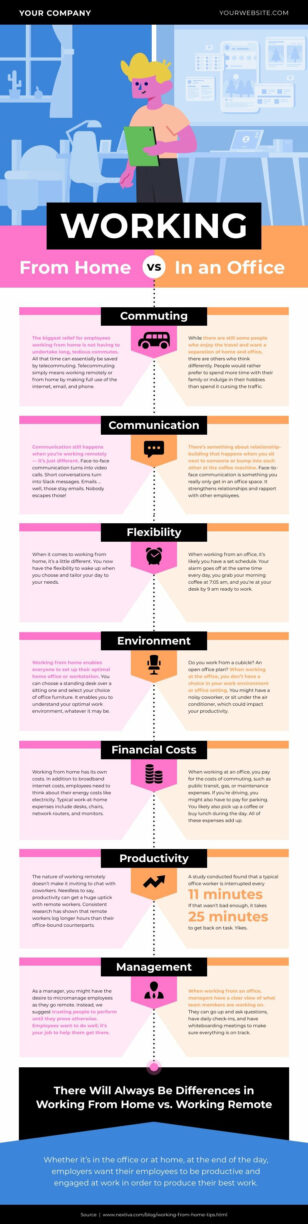
Working From Home VS Working In An Office
Comparison
Working From Home VS Working In An Office
 Comparison
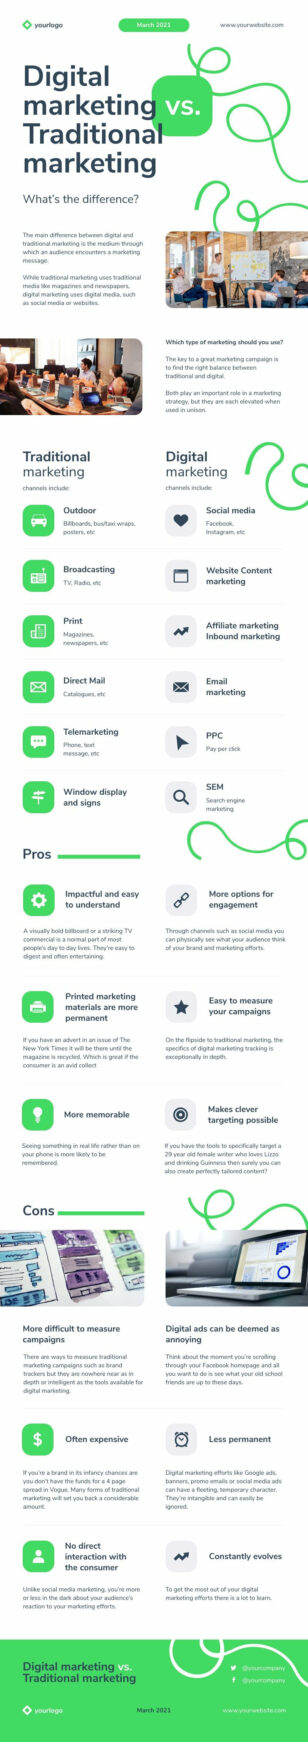
Marketing Comparison
Comparison
Marketing Comparison
 Comparison
Annual Report Comparison
Comparison
Annual Report Comparison
 Comparison
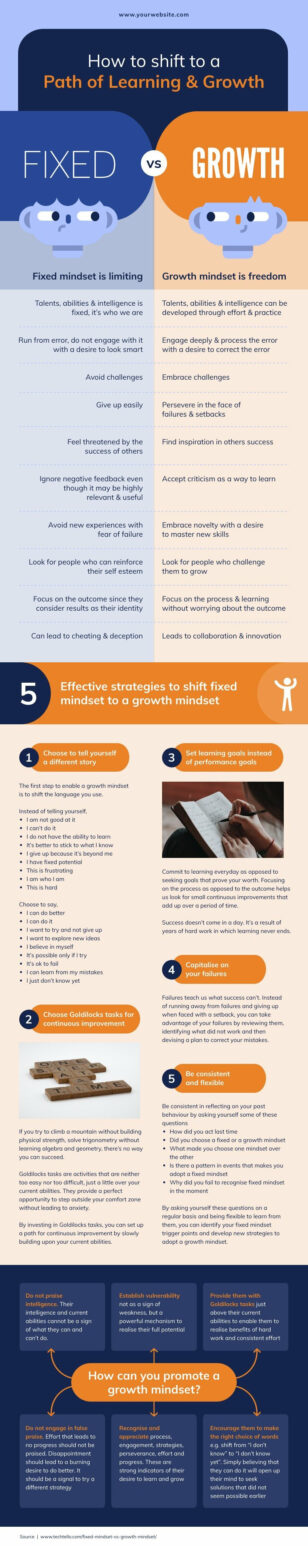
Mindset for Growth
Comparison
Mindset for Growth
 Comparison
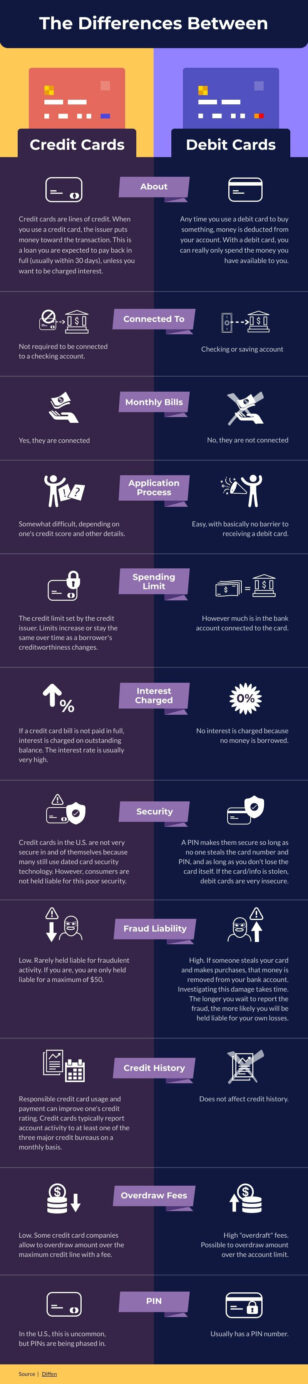
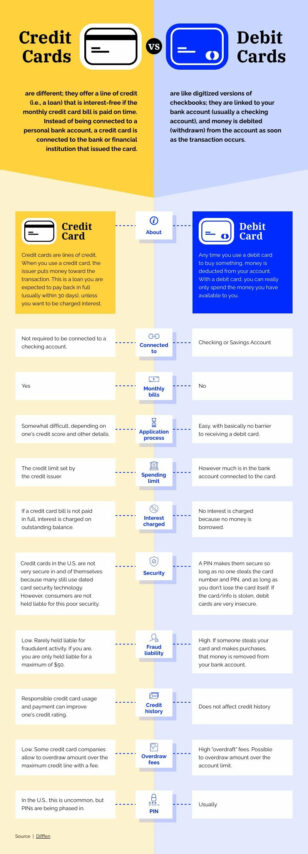
Differences Between Credit Cards and Debit Cards
Comparison
Differences Between Credit Cards and Debit Cards
 Comparison
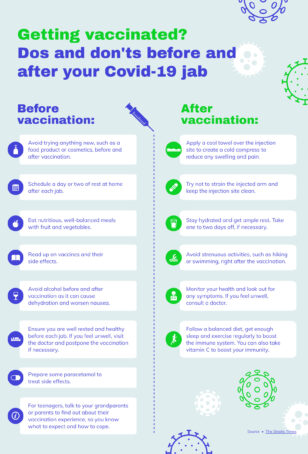
Do’s and Don’ts of Vaccination
Comparison
Do’s and Don’ts of Vaccination
 Comparison
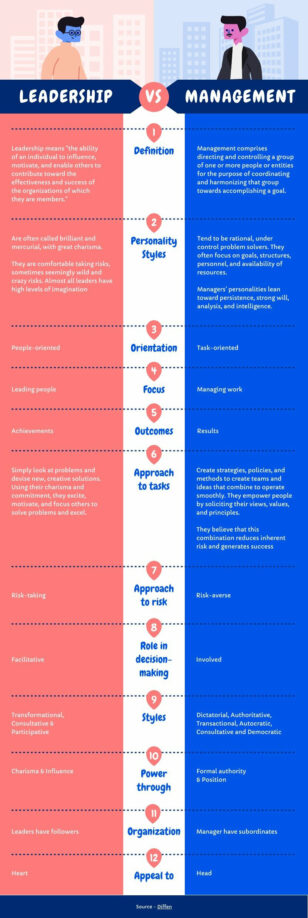
Leadership vs Management
Comparison
Leadership vs Management
 Comparison
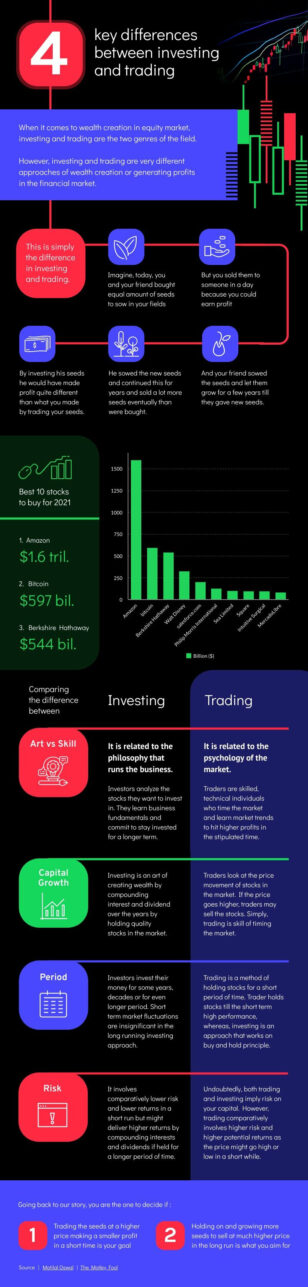
Investing vs Trading
Comparison
Investing vs Trading
 Comparison
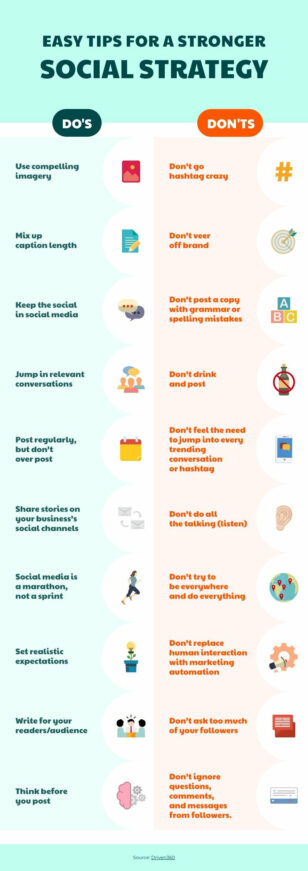
How to Use Social Media Effectively
Comparison
How to Use Social Media Effectively
 Comparison
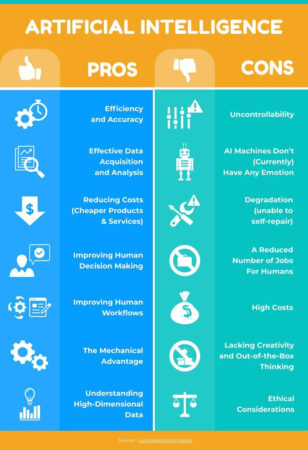
Pros and Cons of Artificial Intelligence
Comparison
Pros and Cons of Artificial Intelligence
 Comparison
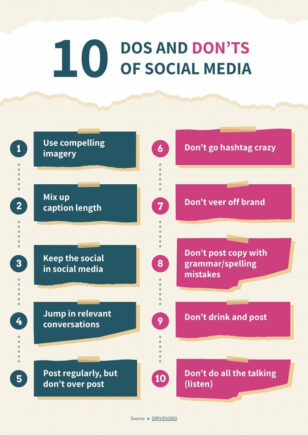
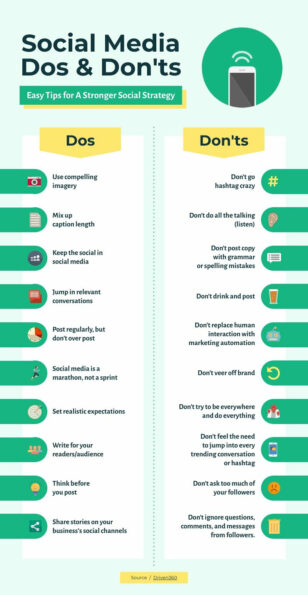
10 Do’s and Don’ts of Social Media
Comparison
10 Do’s and Don’ts of Social Media
 Comparison
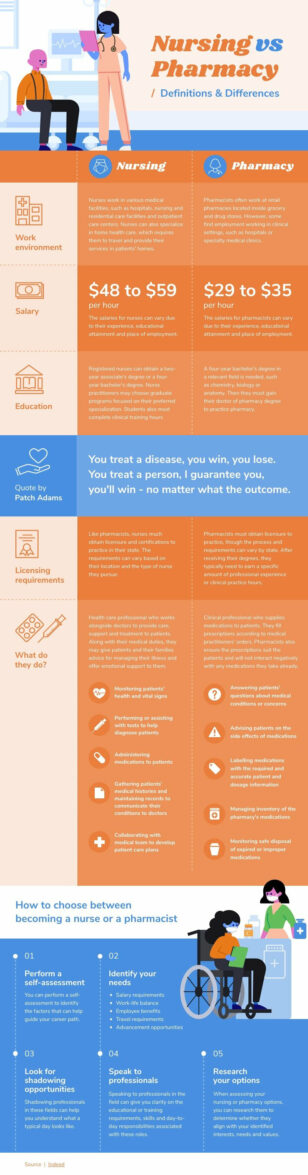
Nursing vs Pharmacy
Comparison
Nursing vs Pharmacy
 Comparison
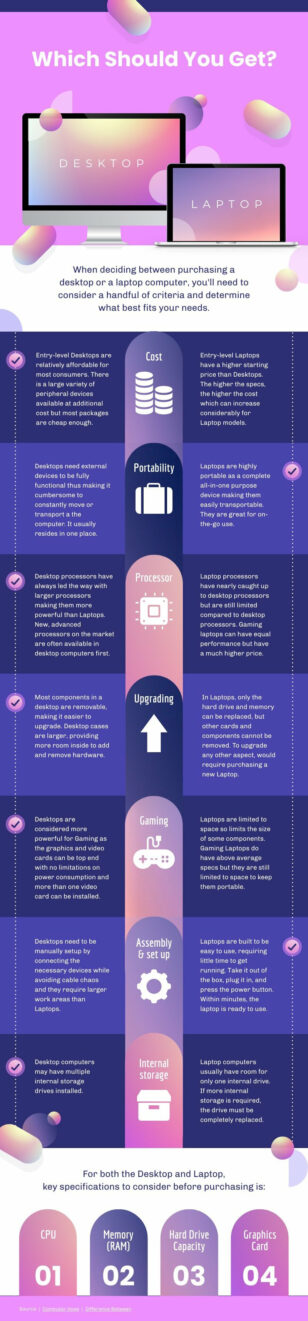
Desktop vs Laptop
Comparison
Desktop vs Laptop
 Comparison
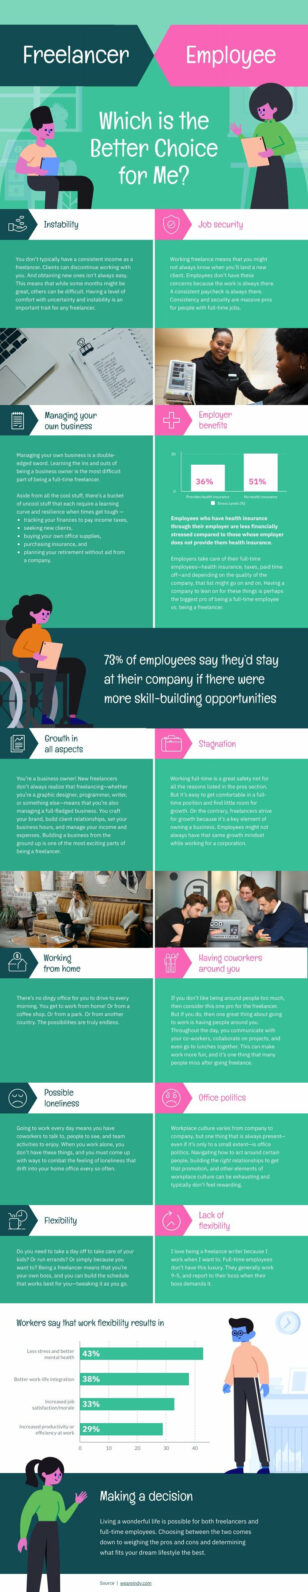
Freelancer vs Employee
Comparison
Freelancer vs Employee
 Comparison
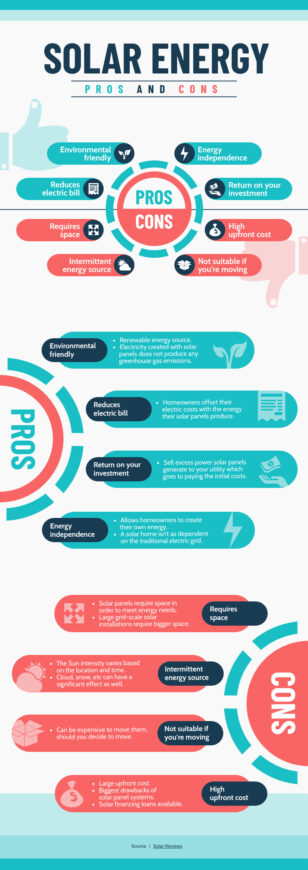
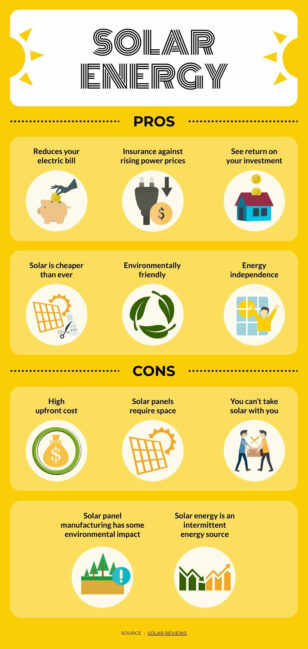
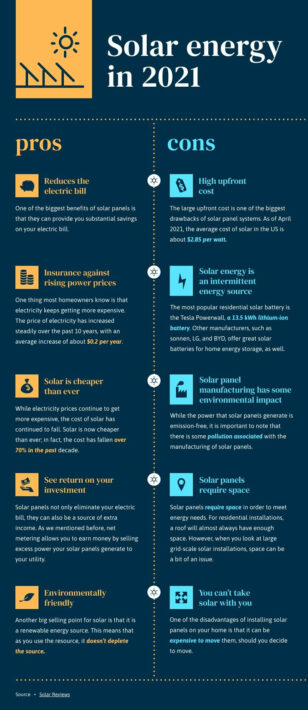
Pros and Cons of Solar Energy
Comparison
Pros and Cons of Solar Energy
 Comparison
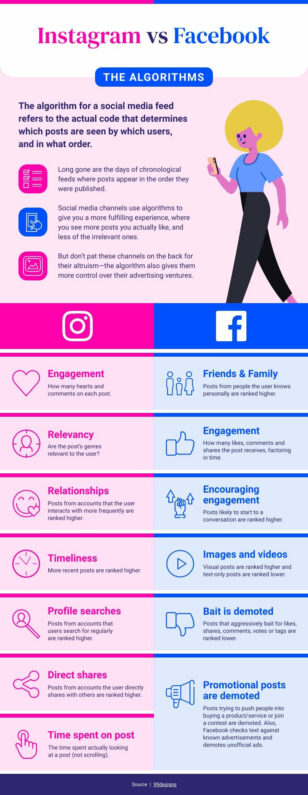
Instagram vs Facebook
Comparison
Instagram vs Facebook
 Comparison
Advantages And Disadvantages Of Cryptocurrency
Comparison
Advantages And Disadvantages Of Cryptocurrency
 Comparison
Social Media Marketing Tips
Comparison
Social Media Marketing Tips
 Comparison
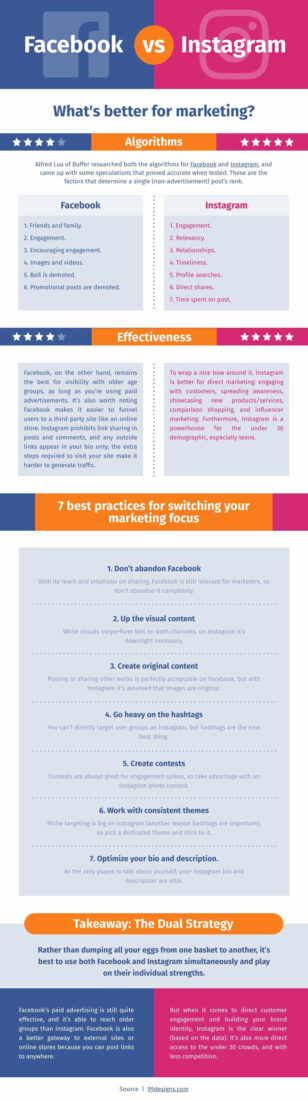
FB vs Instagram
Comparison
FB vs Instagram
 Comparison
Pros and Cons of Solar Panels
Comparison
Pros and Cons of Solar Panels
 Comparison
Debit vs Credit
Comparison
Debit vs Credit
 Comparison
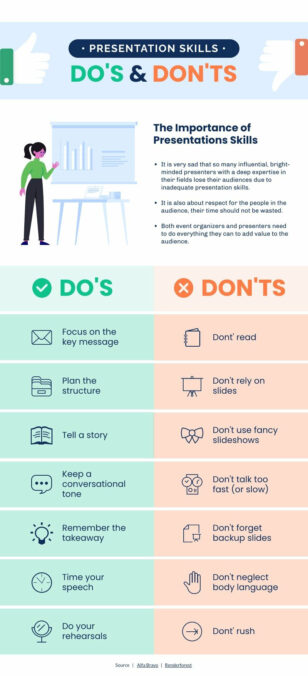
Presentation Tips
Comparison
Presentation Tips
 Comparison
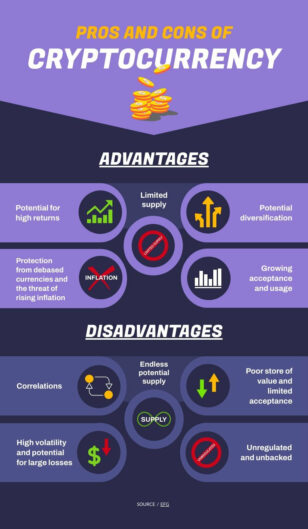
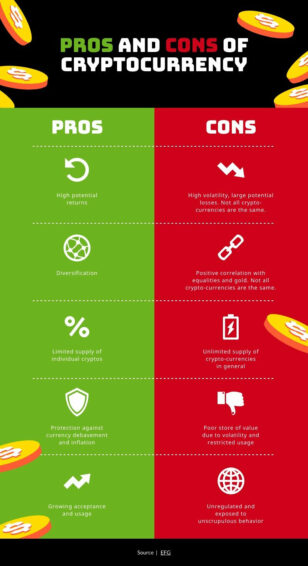
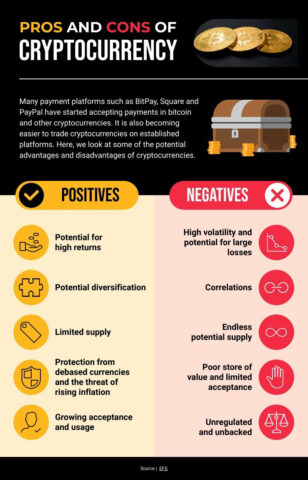
Pros and Cons of Cryptocurrency
Comparison
Pros and Cons of Cryptocurrency
 Comparison
Effective Communication Presentation
Comparison
Effective Communication Presentation
 Comparison
Advantages and Disadvantages of Solar Energy
Comparison
Advantages and Disadvantages of Solar Energy
 Comparison
Tips for Public Speaking
Comparison
Tips for Public Speaking
 Comparison
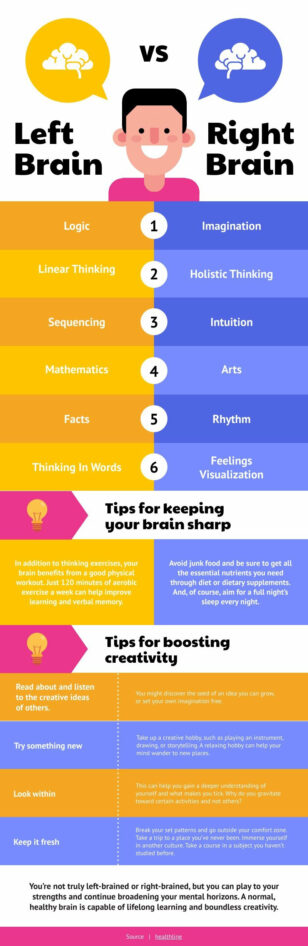
Left Brain vs Right Brain
Comparison
Left Brain vs Right Brain
 Comparison
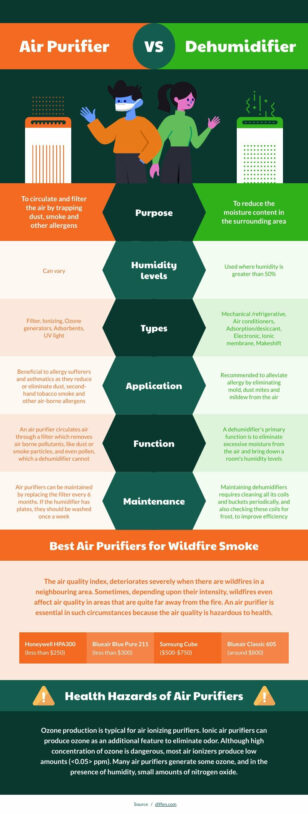
Air Purifier vs Dehumidifier
Comparison
Air Purifier vs Dehumidifier
 Comparison
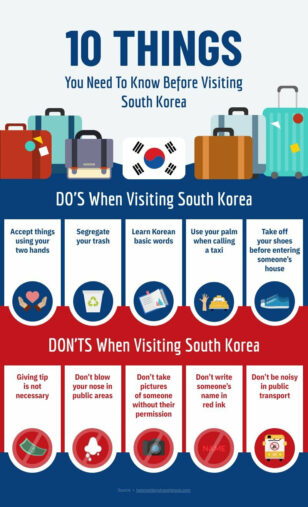
Do’s and Don’ts in South Korea
Comparison
Do’s and Don’ts in South Korea
 Comparison
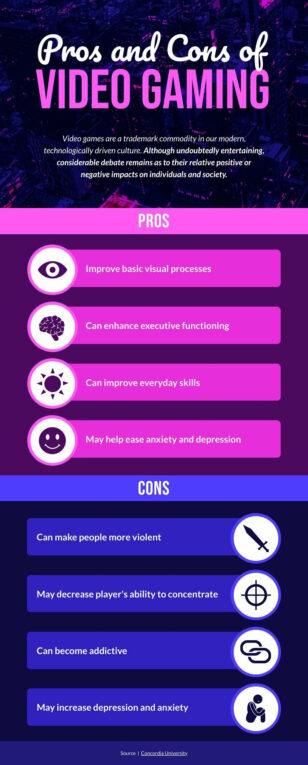
Pros and Cons of Video Gaming
Comparison
Pros and Cons of Video Gaming
 Comparison
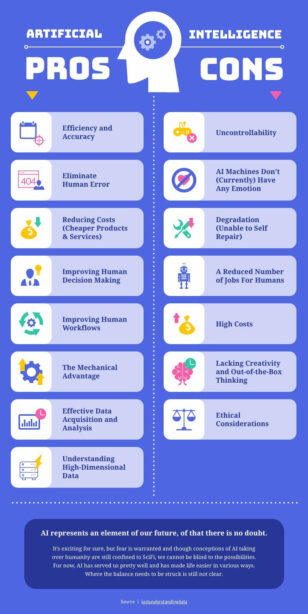
Advantages and Disadvantages of Artificial Intelligence
Comparison
Advantages and Disadvantages of Artificial Intelligence
 Comparison
Benefits of Cryptocurrency
Comparison
Benefits of Cryptocurrency
 Comparison
Healthy Ingredient Swaps
Comparison
Healthy Ingredient Swaps
 Comparison
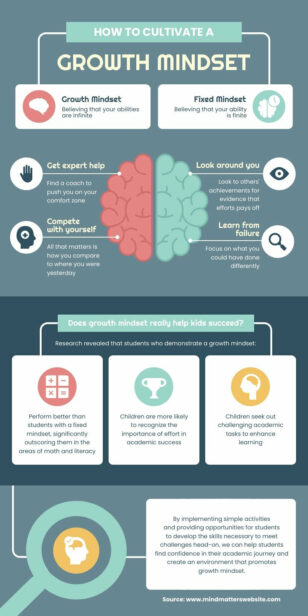
How to Cultivate a Growth Mindset
Comparison
How to Cultivate a Growth Mindset
 Comparison
Dos and Don’ts
Comparison
Dos and Don’ts
 Comparison
Heat Stroke vs Heat Exhaustion
Comparison
Heat Stroke vs Heat Exhaustion
 Comparison
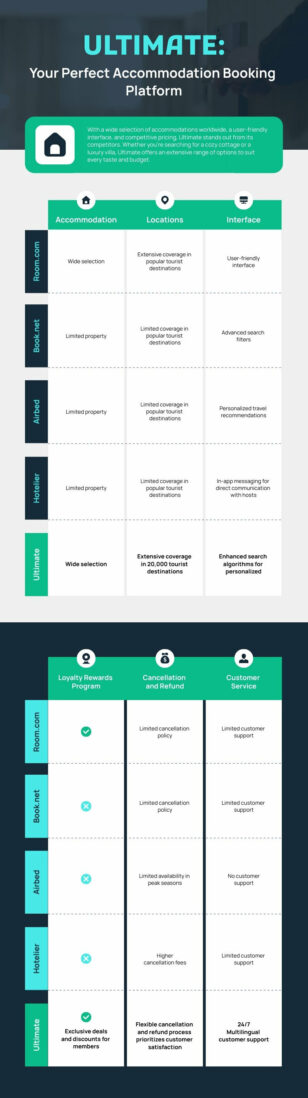
Competitor Comparison
Comparison
Competitor Comparison
 Comparison
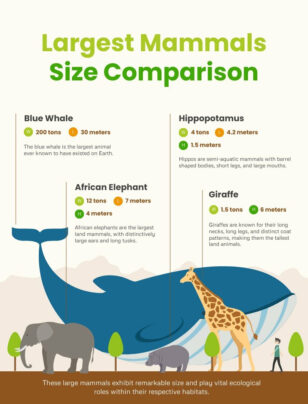
Largest Mammals Size Comparison
Comparison
Largest Mammals Size Comparison
 Comparison
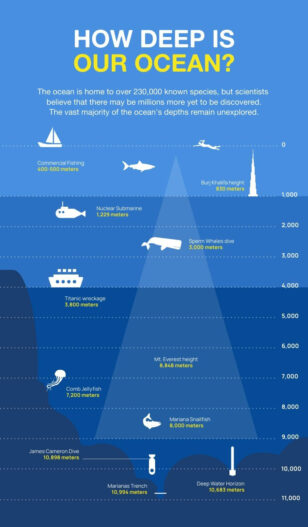
How Deep Is Our Ocean
Comparison
How Deep Is Our Ocean
 Comparison
 Table
Comparison
Comparison Table
 Comparison
Competitive Analysis
Comparison
Competitive Analysis
Comparison infographic templates for side-by-side breakdowns
Comparison infographics offer a powerful way to present complex information clearly and in an engaging way. With Piktochart’s diverse range of templates, you can effortlessly create side-by-side analyses to help your audience grasp key differences and similarities at a glance.
Our free, customizable templates cater to various needs—from product comparisons and market analysis to educational content and decision-making tools. Each template is designed for easy editing, allowing you to input your data, adjust colors, and modify layouts without any graphic design experience.
By using visual comparisons, you can transform dry statistics and lengthy text into compelling graphics that resonate with your audience. Whether you’re a marketer showcasing product features, an educator explaining concepts, or a business professional presenting data, our comparison infographic templates help you communicate effectively and leave a lasting impression. Start today with one of our templates, or create your own infographic in seconds with the AI infographic generator.
Want a comparison infographic in seconds? Try our AI comparison infographic generator — describe what you’re comparing and the tool produces a side-by-side visual you can refine in our editor.
Comparison Infographics FAQs
What’s the best layout for a comparison infographic?
Side-by-side columns work best for two options; for three or more, use a comparison table — Piktochart’s templates include both formats.
How do I compare more than two products in one infographic?
Use a multi-column comparison table template — Piktochart supports 3, 4, or 5-way comparisons with consistent visual weighting per column.
Can I add icons and images to comparison cells?
Yes — drag any icon from Piktochart’s library or upload your own image into each comparison cell to make differences scannable at a glance.
How do Piktochart comparison infographics compare to Canva or Visme?
Piktochart specialises in data-heavy infographics with built-in chart support, free to start, and is faster for comparison layouts than Canva or Visme.
Can I export a comparison infographic for use in a blog post or report?
Yes — export as PNG (for blog embeds), PDF (for downloadable versions), or interactive HTML to keep the infographic clickable in your CMS.