Piktochart Templates Healthcare / Stroke
Stroke Infographic Templates
Empower your audience with our stroke infographic templates. Transform complex medical data into clear, engaging visuals that educate and potentially save lives. Whether you're a healthcare professional, educator, or advocate, these customizable designs help you communicate stroke symptoms, risk factors, and prevention strategies effectively. Start creating impactful infographics that resonate with your audience and promote stroke awareness today.
Stroke Infographic Templates
How to Design Stroke Infographics That Save Lives Through Faster Recognition
Transform complex stroke data into visually compelling infographics in minutes. Our professionally designed stroke infographic templates empower you to create clear, urgent visuals without graphic design expertise.
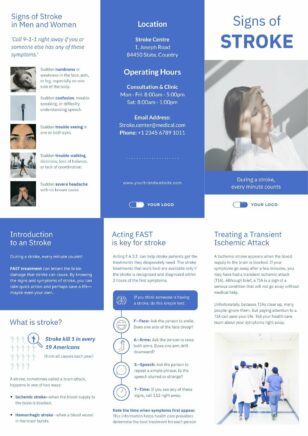
Whether you’re a hospital educator, neurologist, public health team, or advocate, our customizable templates help you communicate the warning signs (FAST: Face, Arms, Speech, Time), risk factors, recovery pathways, and survival statistics with clarity and impact. Adjust colors, fonts, icons, and imagery to match your hospital, clinic, or campaign branding.
From rehabilitation roadmaps to “know the signs” community posters, Piktochart’s stroke templates help you deliver education that drives faster recognition and faster treatment — the two factors that most influence stroke outcomes.
Need a stroke awareness asset fast? Try our AI healthcare infographic generator — describe the audience and key facts and the tool produces a fully editable design.
Stroke Infographic FAQs
How do I create a FAST stroke recognition poster?
Use a four-panel layout with each letter as a panel header (Face drooping, Arm weakness, Speech difficulty, Time to call 911). Add a simple icon for each symptom and a high-contrast banner with the emergency number. Print at 11×17″ for waiting rooms or A4 for community handouts. Include the BE-FAST extension (Balance, Eyes) if your education program uses the longer mnemonic.
What stroke topics work best as patient education infographics?
The strongest patient-facing topics are recognition signs, modifiable risk factors (blood pressure, AFib, diabetes, smoking), the post-stroke recovery timeline, what to expect at a stroke center, and stroke-versus-mini-stroke (TIA) differences. One topic per infographic outperforms multi-topic compendiums.
Can I use these for World Stroke Day or Stroke Awareness Month?
Yes — World Stroke Day is October 29 and US National Stroke Awareness Month is May. Build a launch infographic, three weekly stat tiles, and a closing recap from one Piktochart template family so the campaign reads as one coherent visual identity across social, print, and email.
How do I make a stroke recovery roadmap for patients and families?
Use a horizontal timeline template with four phases (acute care, in-patient rehab, outpatient therapy, ongoing recovery), name a typical duration per phase, and list one or two milestone goals each. Add a sidebar of caregiver resources and download as a PDF for the patient’s discharge folder.
Are CDC and American Stroke Association statistics free to reuse?
Yes — CDC, NIH, and most national stroke registries publish data in the public domain. Cite “Source: American Stroke Association, 2026” or similar at the bottom of each visual, and refresh annually as new mortality and incidence data are released.