Healthcare professionals about Piktochart
say Piktochart helps communicate complex healthcare information more effectively
say Piktochart helps improve the healthcare provider and general public relationship
say Piktochart’s visuals help improve general understanding of healthcare topics

Make it quick
Revolutionize healthcare communication in seconds
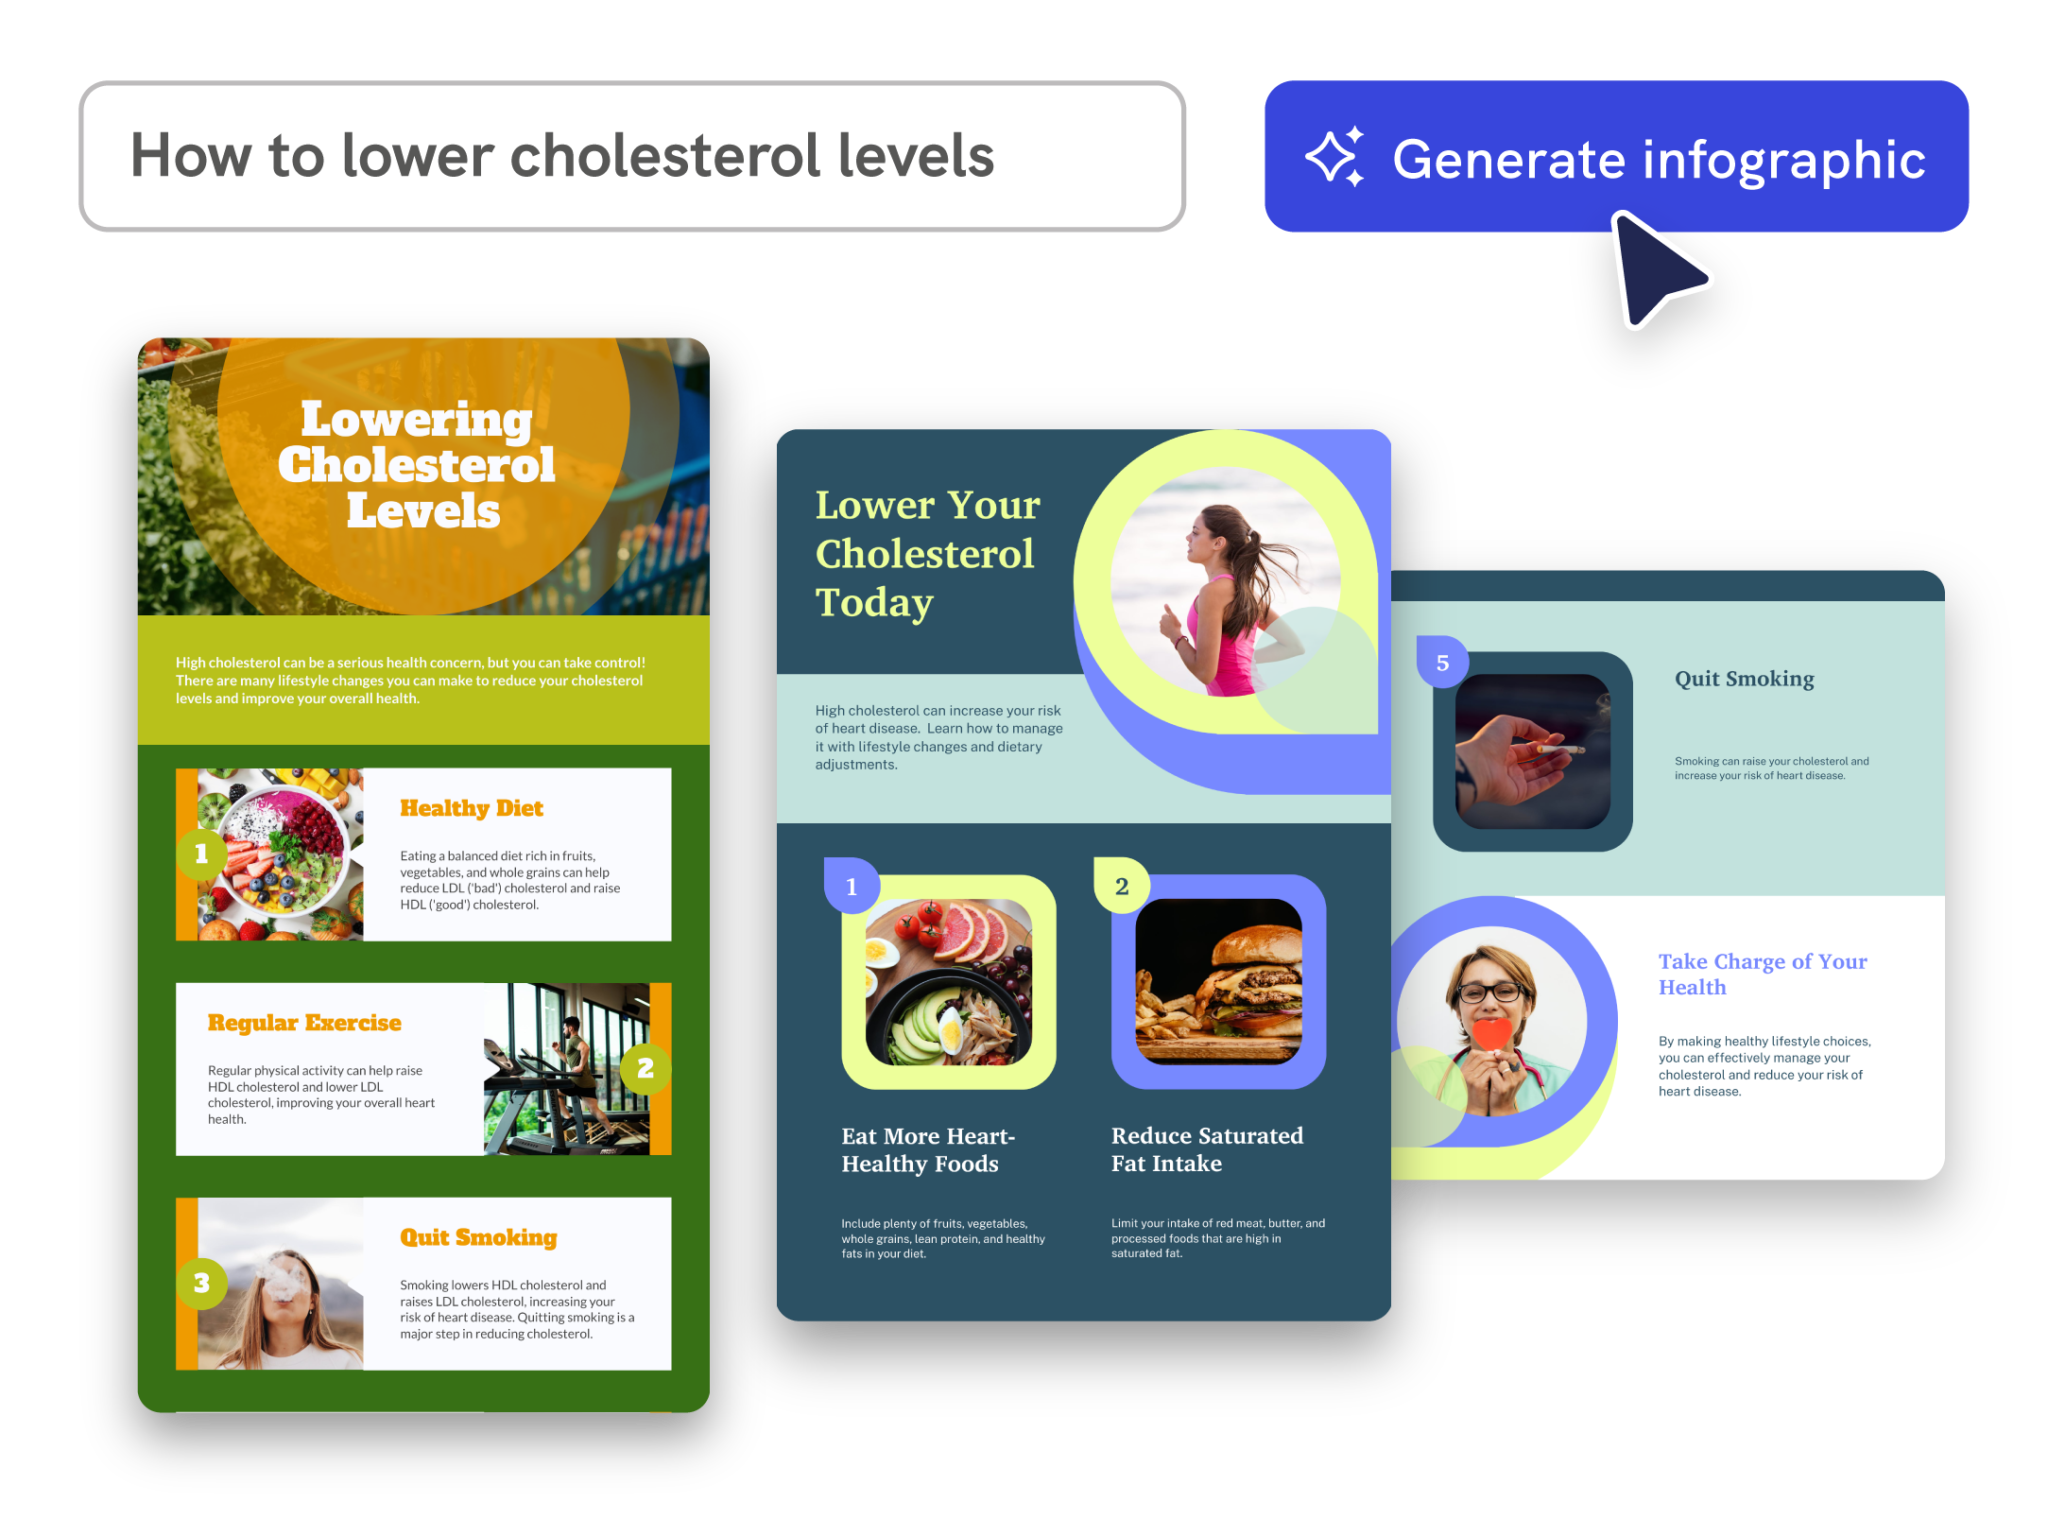
Enter your healthcare topic and our AI will analyze your content and provide a variety of infographic templates for you to choose from. Within seconds, you’ll have a polished, high-quality infographic, so you can focus on what matters most—patient care and medical research.
Piktochart AI transforms your data into compelling infographics that enhance understanding and engagement. Perfect for patient education, research presentations, and internal communications.
Make it yours
Effortless customization at your fingertips
Our intuitive platform allows you to create professional-quality infographics with ease. Add your personal touch and ensure the infographic aligns with your objectives. Present complex medical data, research findings, and patient information clearly with charts and graphs.
Access a variety of healthcare-specific infographic templates, including patient education, health statistics, medical procedures, and more. Customize them to meet your needs.

Make it efficient
Text-heavy content to professional infographics
Don’t know where to start with your content? Simply upload your document and Piktochart AI will generate a customized infographic tailored for you. In seconds, you’ll have a professional-quality infographic ready to share with patients and colleagues.
Piktochart AI supports PDF, DOCX, and TXT formats, providing the versatility to meet all your needs. Start with our AI-generated template, refine your message, and watch your vision come to life.
Make it structured
Intelligent design assistance with AI outline
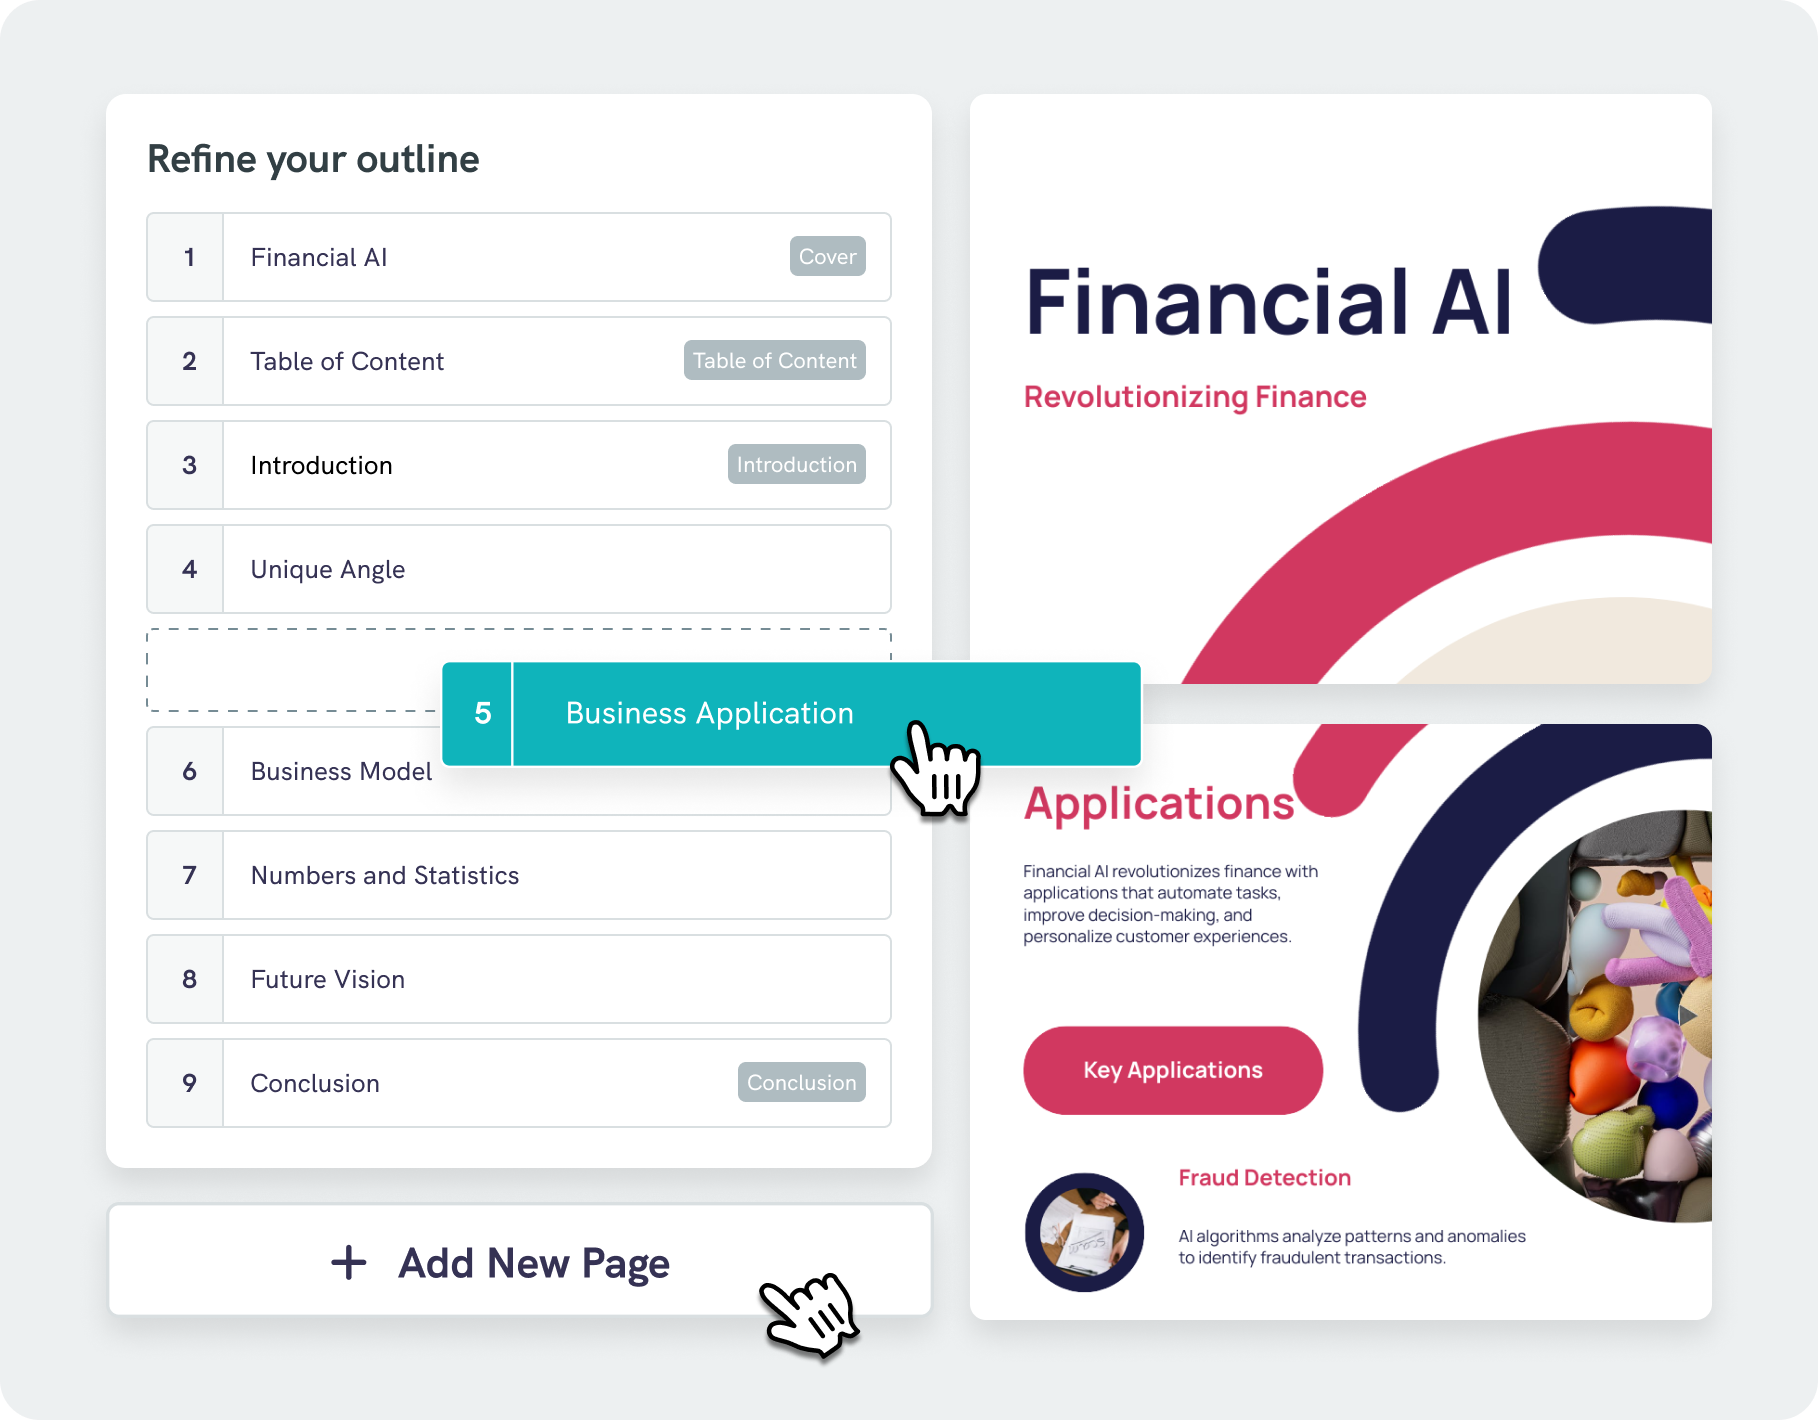
Our AI infographic generator does more than just place text on a page—our algorithms analyze your content and suggest visually appealing designs that boost readability and engagement.
With our AI outline feature, you can effortlessly organize your ideas into a clear, logical structure, keeping your focus on key points. Easily edit and refine your outline, saving both time and effort.

“Piktochart helps me spread awareness and educate others about wellness topics through professional, fun, and attractive flyers I can quickly create myself.”
Jessica Remington
Director of Health and Wellness Services at WinonaHealth.org
“I do not have any expertise in design, but Piktochart turns people like me into a designer.”
Venus Wong
Psychologist and Affiliated Scholar at Standford University

“Data visualization is important for medical research result dissemination. With Piktochart, this work can be done in a creative and impactful way. And fast!”
Yang Su Lan
Research Pharmacist at National Health Institute of Malaysia
Infographics created using Piktochart’s AI-powered infographic maker

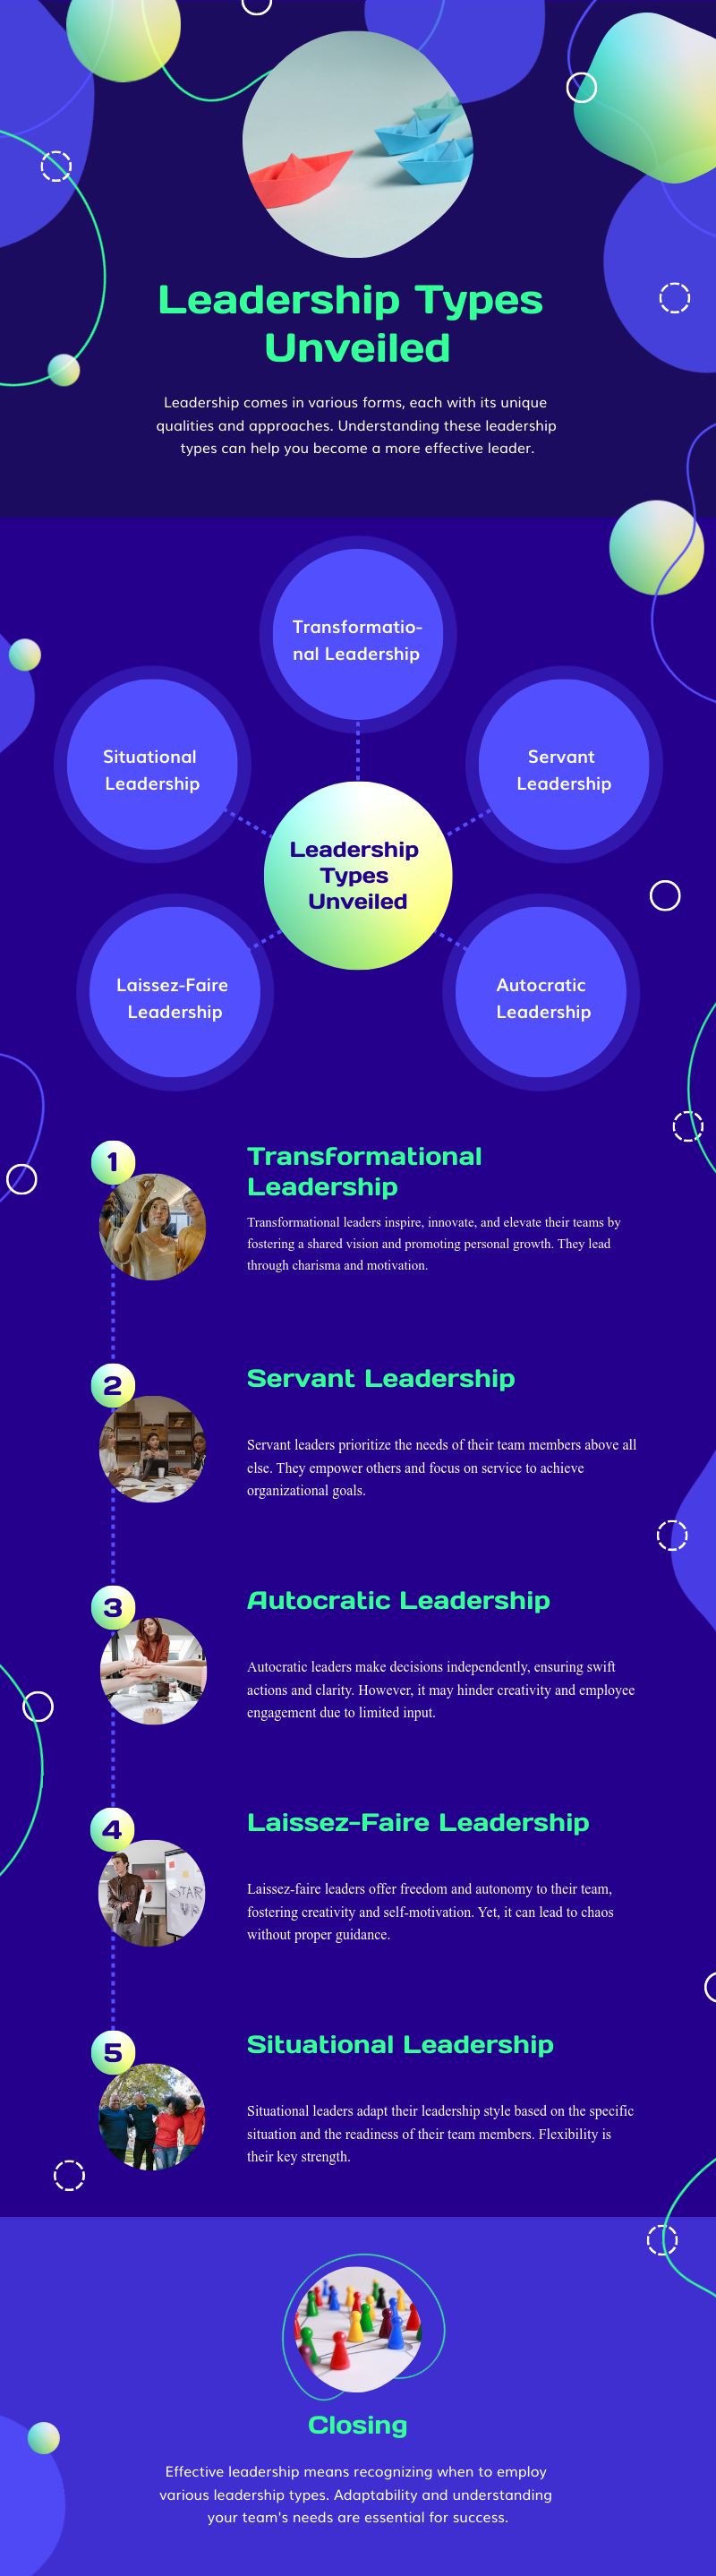
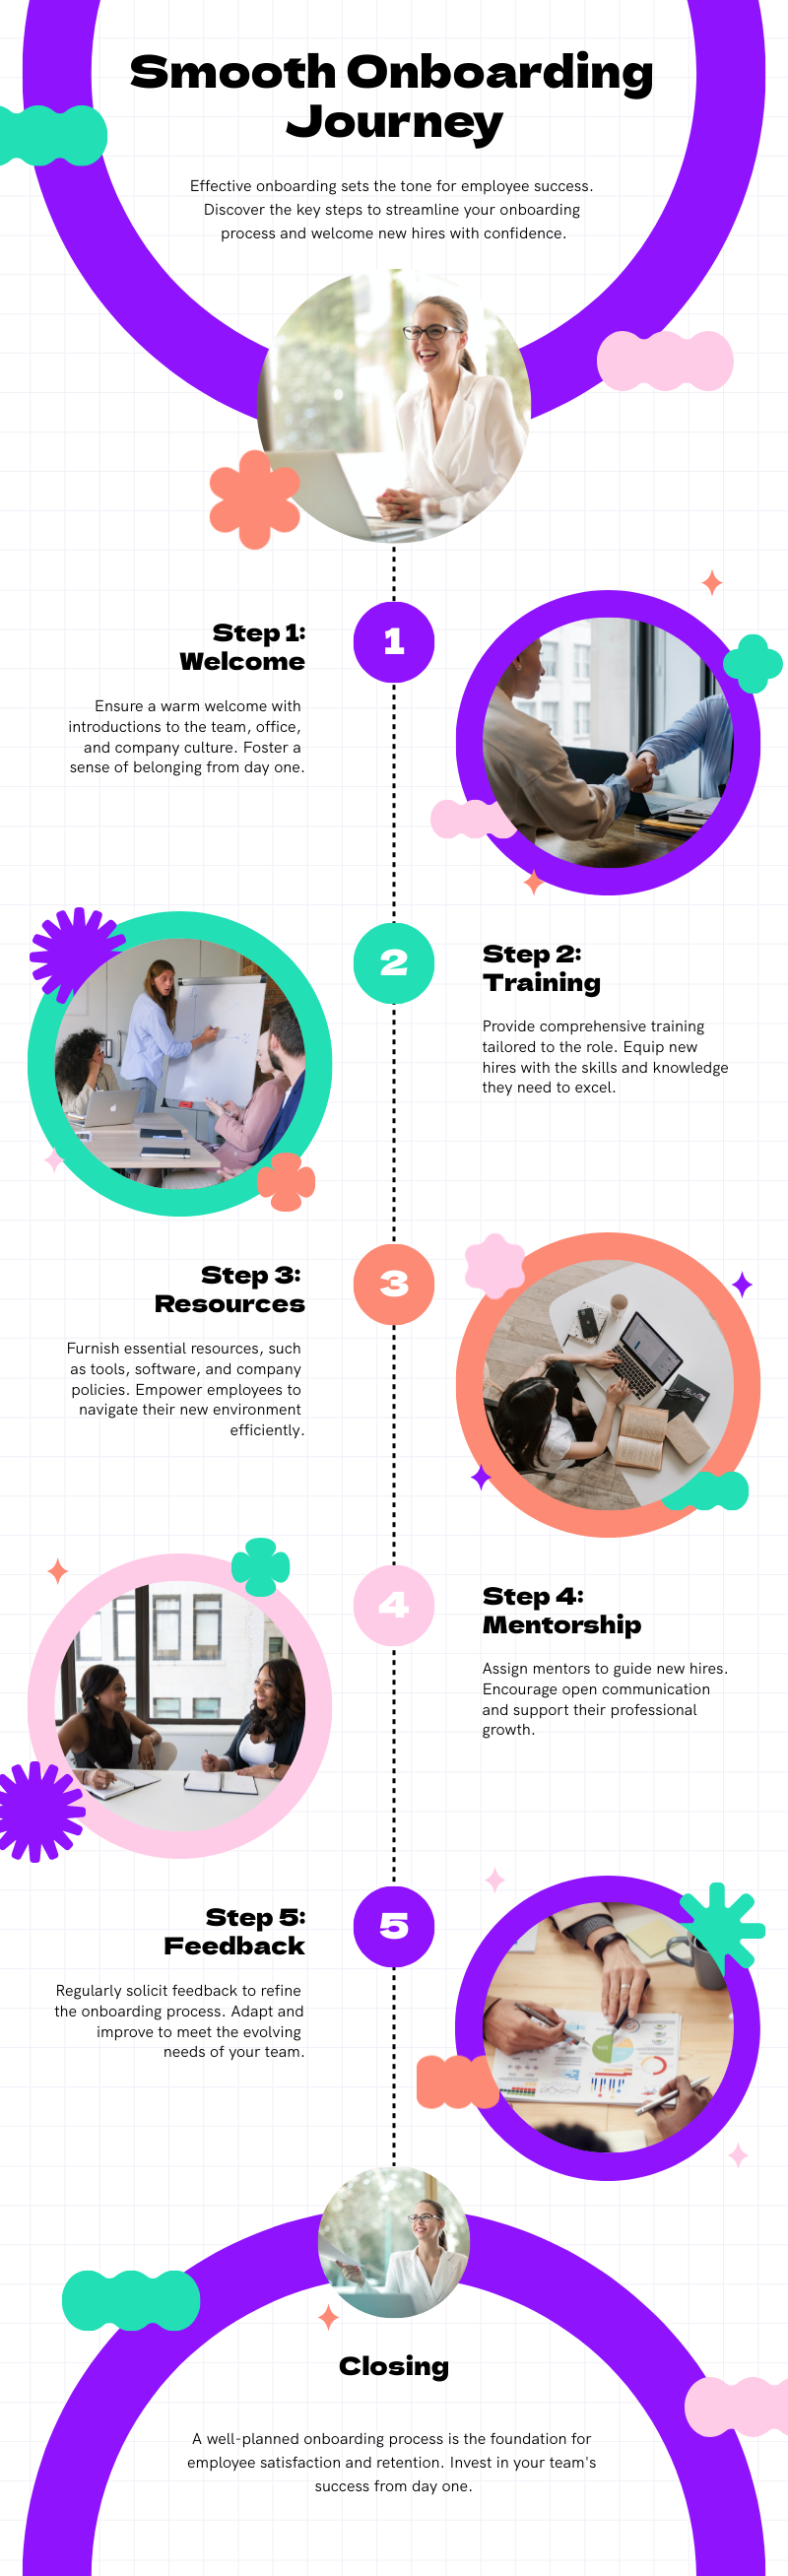
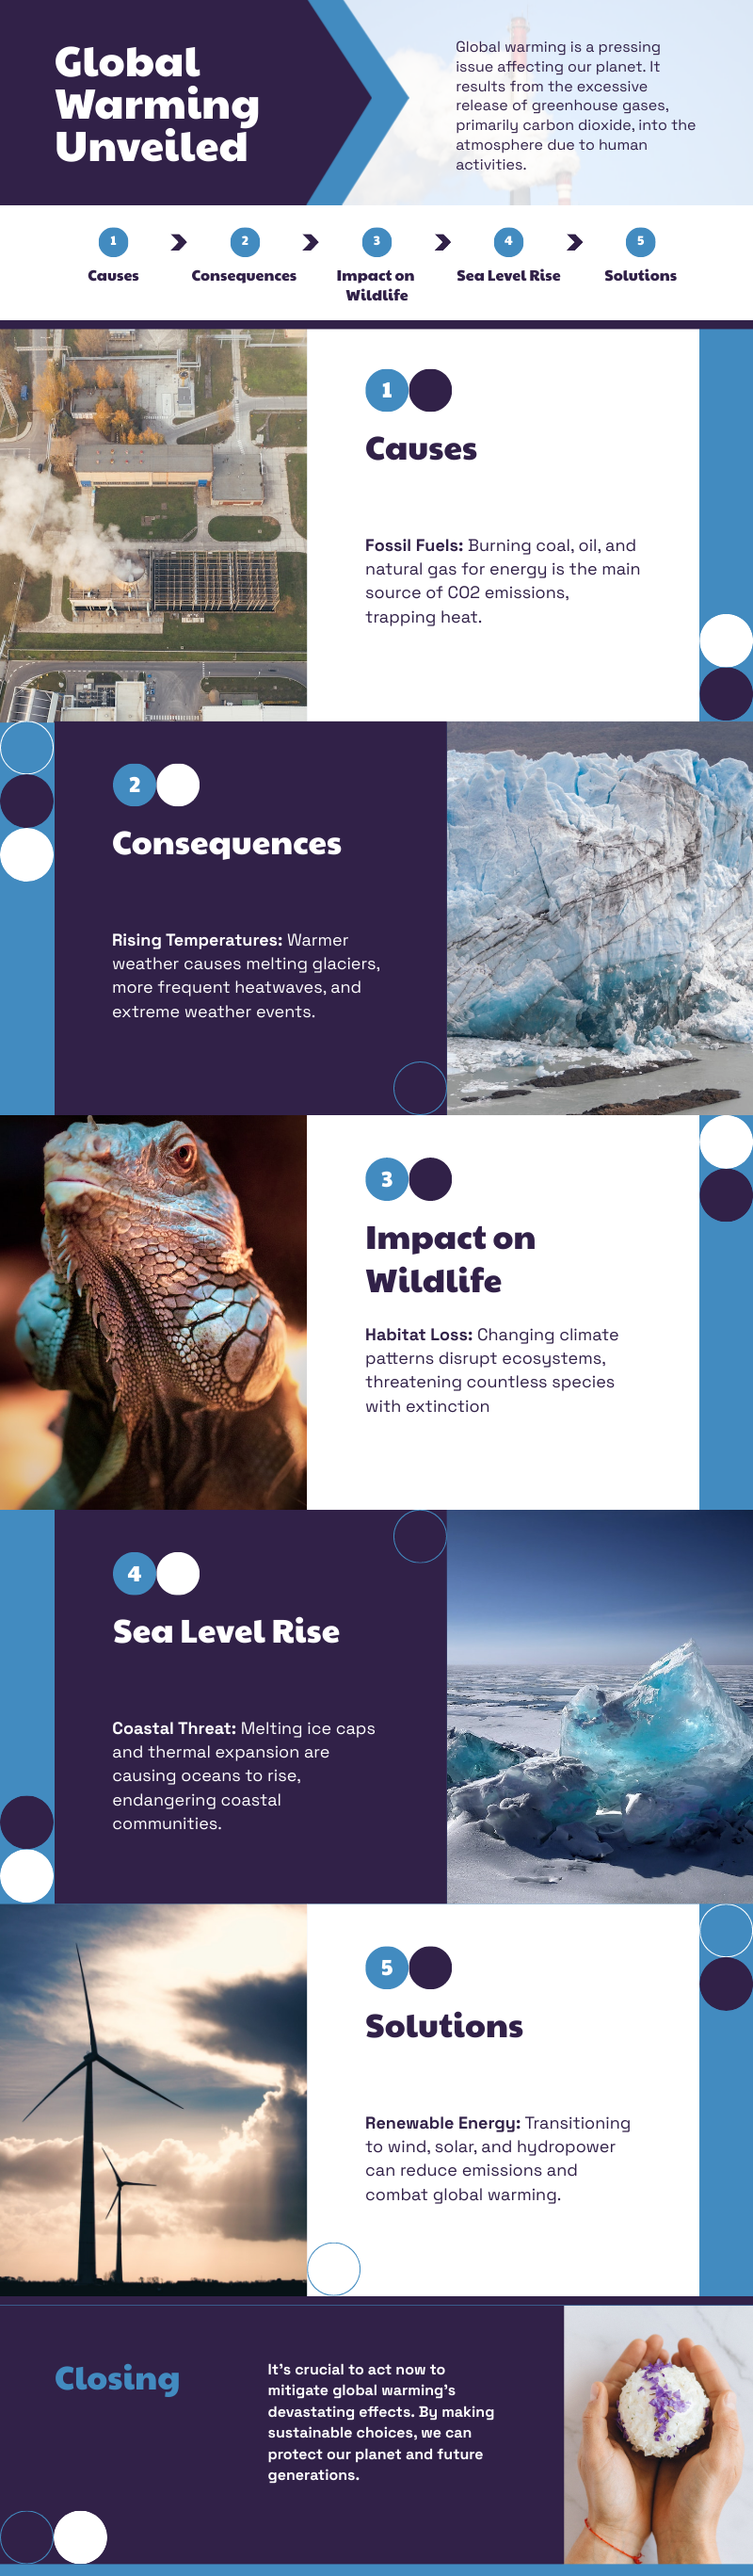
How to Create Healthcare Infographics Using AI
1. Input your topic or idea
Start by entering your topic or data. For example, “common medical conditions for diabetic patients,” “clinical surgical procedure,” or “fundraising campaign for a charitable hospital.”
2. Select from our AI-generated infographics
Within seconds, Piktochart AI generates a variety of infographics for you to choose from based on your topic. Each design is unique and designed by our professional designers. Select your preferred template to make it your own.
3. Customize to fit your needs
4. Download and share
Once completed, download the infographic in various formats such as JPG, PNG, or PDF. Share it online or print out the infographic to elevate healthcare communication.
AI-Powered Visualization for Any Topic
What kinds of healthcare infographics can be generated using this AI tool?
Patient Education Infographics
Explain medical conditions, treatments, and preventive measures in a simple and visual format to help patients understand complex information.
Public Health Awareness Infographics
Highlight important public health issues, vaccination campaigns, disease outbreaks, and prevention strategies to inform and educate the general public.
Medical Procedure Infographics
Provide step-by-step visual guides for medical procedures and surgeries, aiding both patients and medical professionals in understanding and explaining processes.
Health Statistics Infographics
Present data on health trends, such as disease prevalence, mortality rates, and health outcomes, making it easier to grasp and interpret statistical information.
Research Findings Infographics
Summarize research studies, clinical trial results, and scientific discoveries in a visually engaging way to communicate key findings effectively.
Comparison Infographics
Compare different treatments, drugs, healthcare policies, or health conditions to highlight differences and similarities in a clear and concise manner.
Healthcare Workflow Infographics
Map out processes and workflows in healthcare settings, such as patient admission, discharge procedures, and clinical pathways.
Ready to use AI to create healthcare infographics?
Join more than 14 million people who already design information with Piktochart.