Create finance infographics and slides
Piktochart is an information design tool that enables you to create finance graphics, reports, and presentations easily, with no graphic design skills.
Over 14 million users worldwide design with Piktochart

Choose a free finance template to get started


“Piktochart helps me translate often dry financial policies and accounting standards into easy-to-understand and concise one-pager visuals for management.”
Sharon YeungAccountant at SIA Engineering Ltd.

“Wind River Financial is a credit card processing company. We use Piktochart to create professional, personalized account review documents and analyses. We were able to upload our logo colors and match all documents with our website!”
Stephanie O’ConnorSenior Relationship Manager at Wind River Financial

“I adore this program. It is very straightforward and it is incredibly easy to use. I love the templates they offer as well. Very recommended.”
Jovana ValenzuelaInternet Sales Coordinator at Level Financing
Finance professionals about Piktochart
say Piktochart helps them communicate complex business processes
say Piktochart helps everyone in the organization stay on the same page
say Piktochart improves the way complex financial reporting is done
Why Piktochart?
Create finance reports online
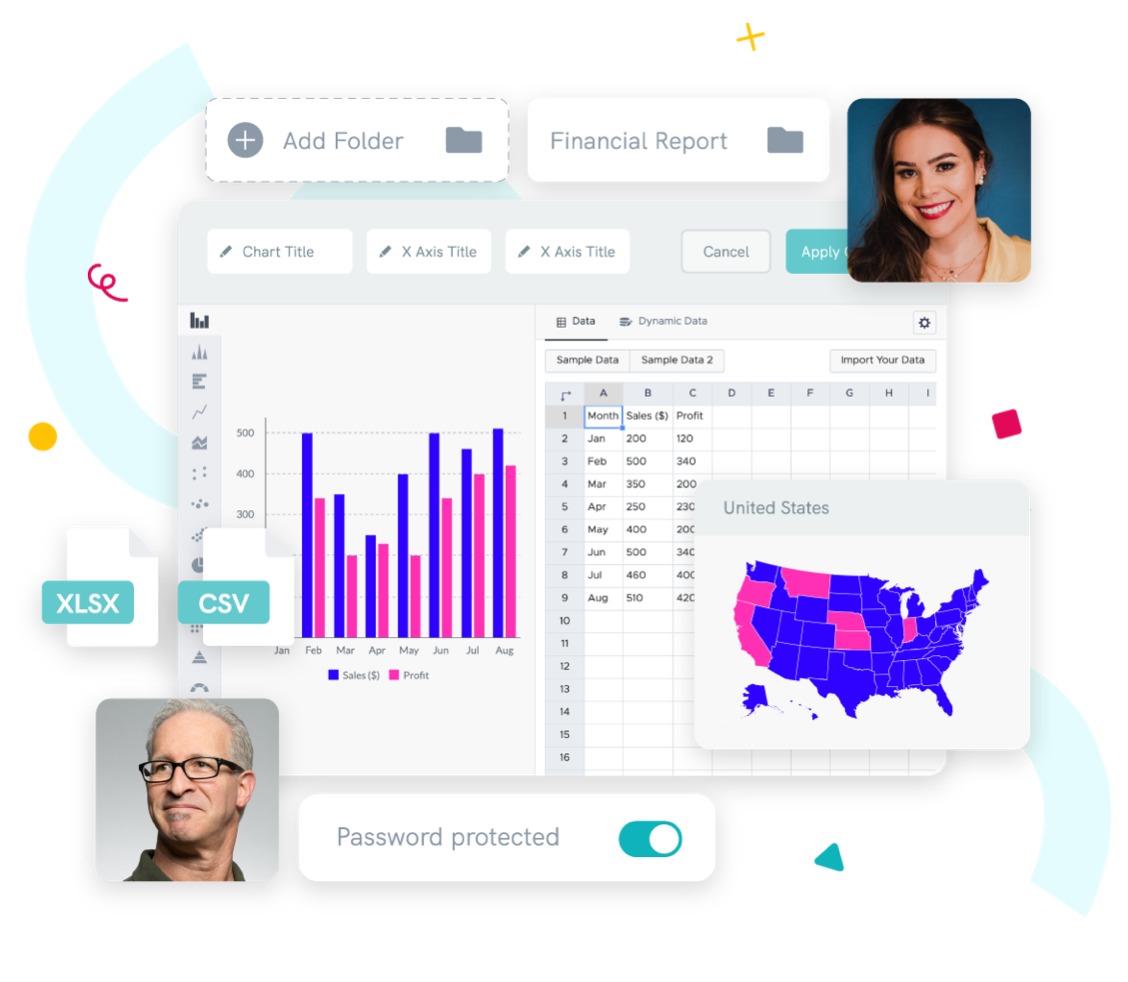
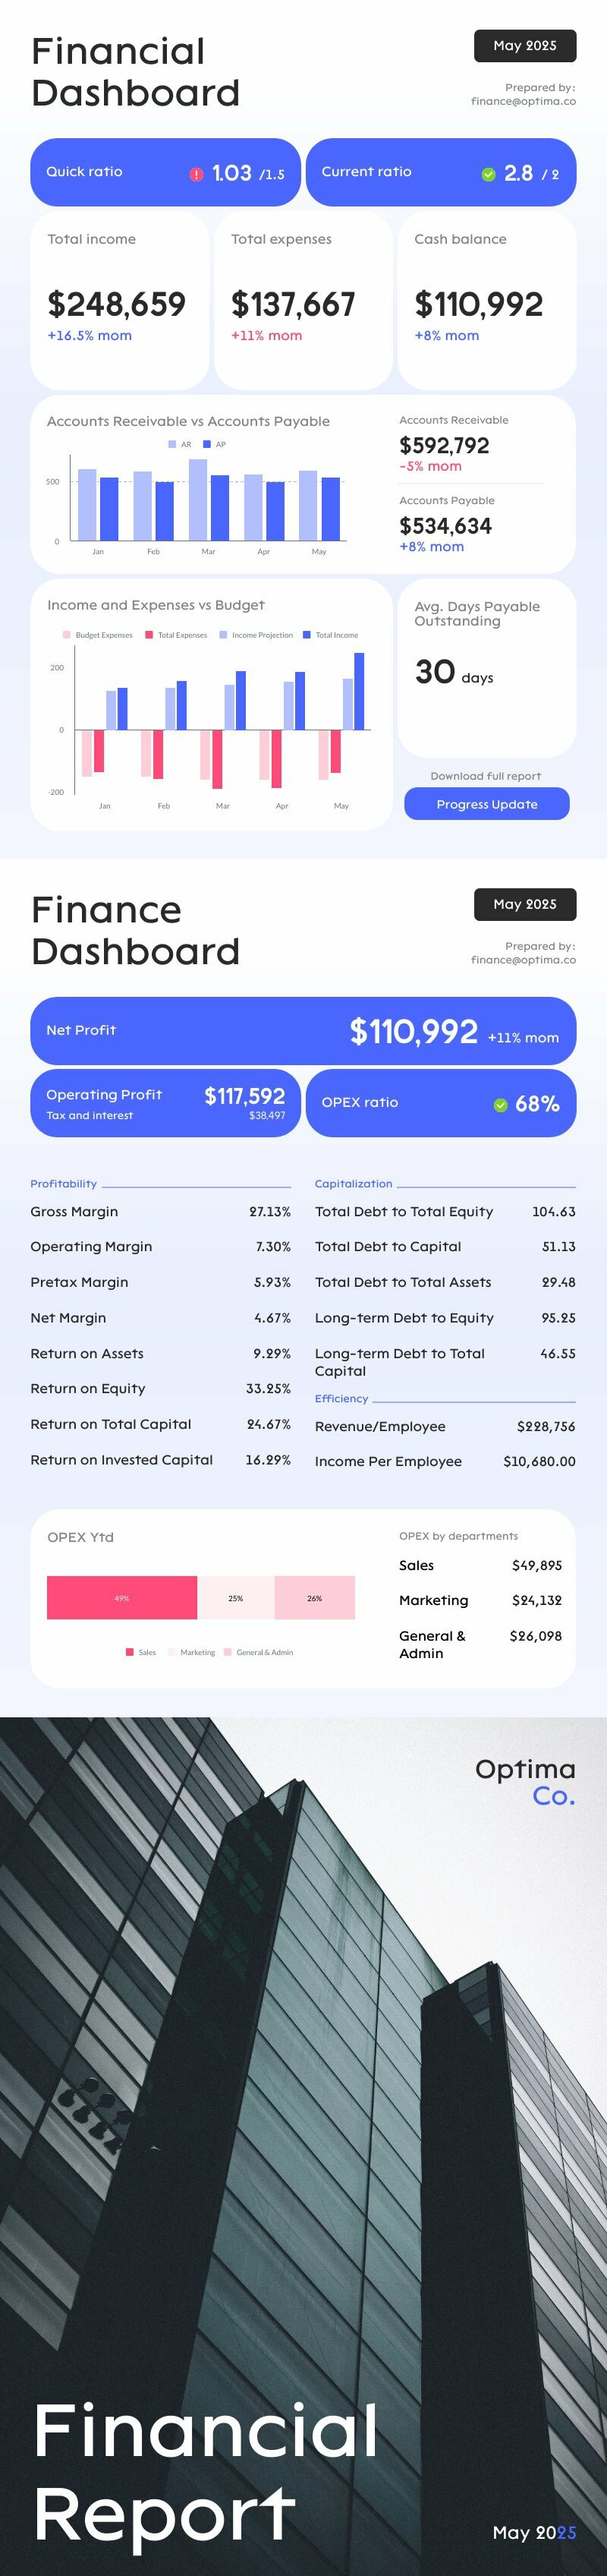
Visualize data in a professional finance report
Link your financial statement from Excel or Google Sheets to easily create graphs that automatically update in your finance report when your data does. Combine various charts into one page to create a professionally-looking, interactive finance dashboard, ready to impress your stakeholders.
Get started for freeOnline & offline sharing
Share your visual content online or offline
Collaborate with your team on a finance presentation or visual. Share with stakeholders to gather feedback. Download finance graphics in high-resolution as PNG or PDF, and save your slides as a PowerPoint for offline use. It’s up to you how you want to use your content. And the visuals will not have our watermark.
Create a free accountCreate finance graphics easily
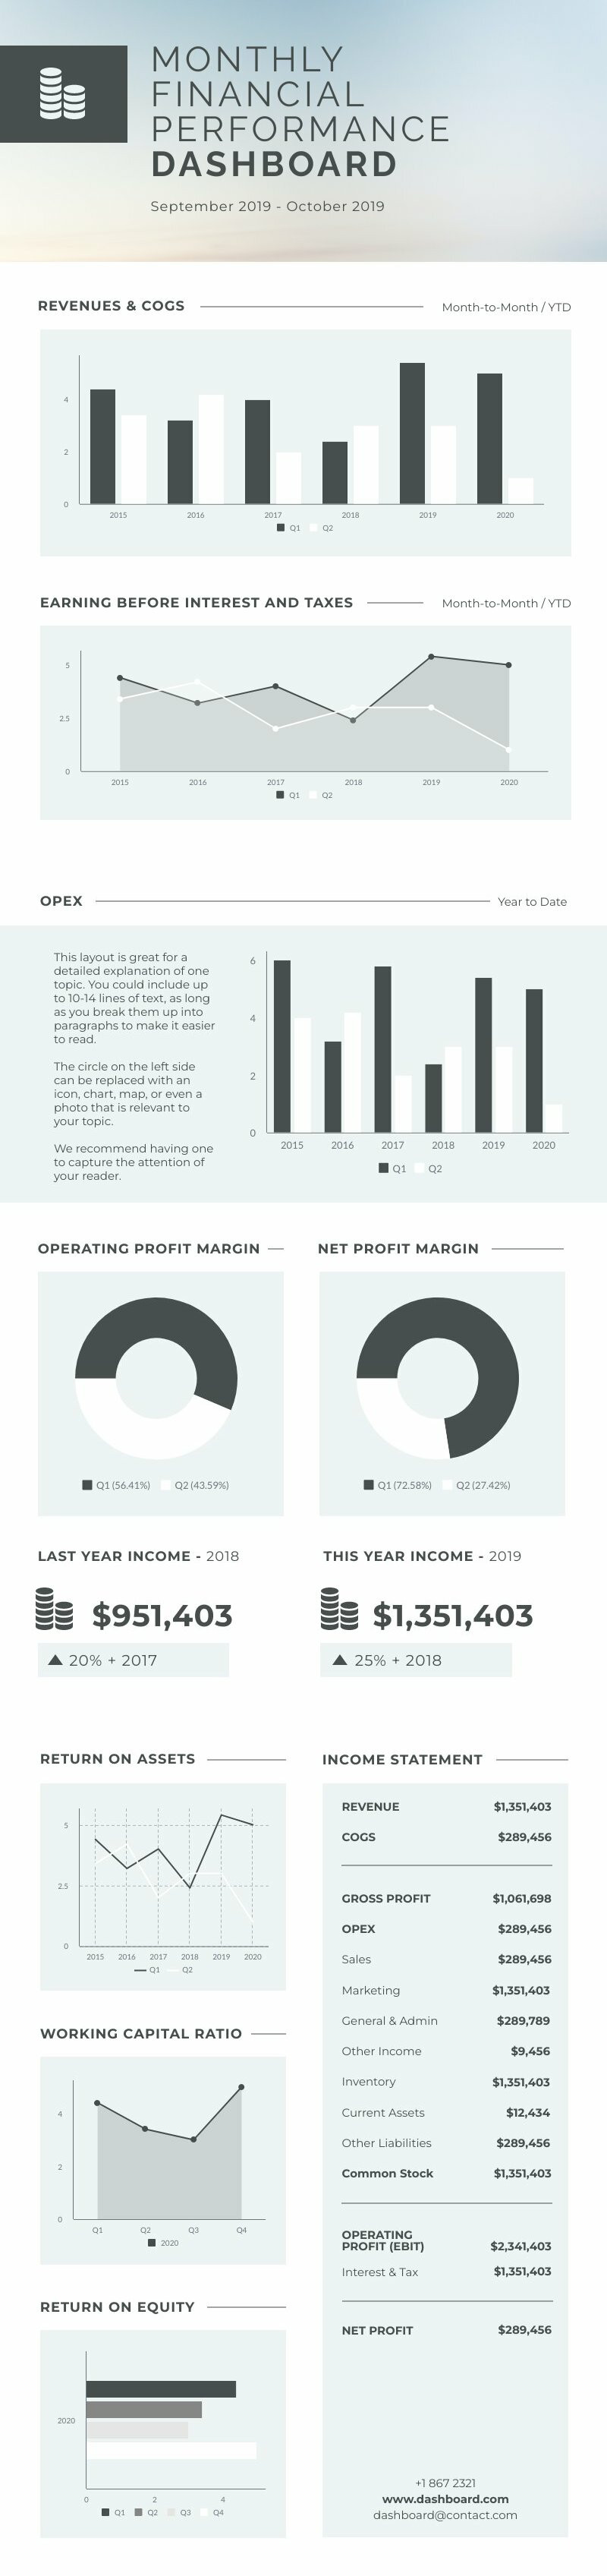
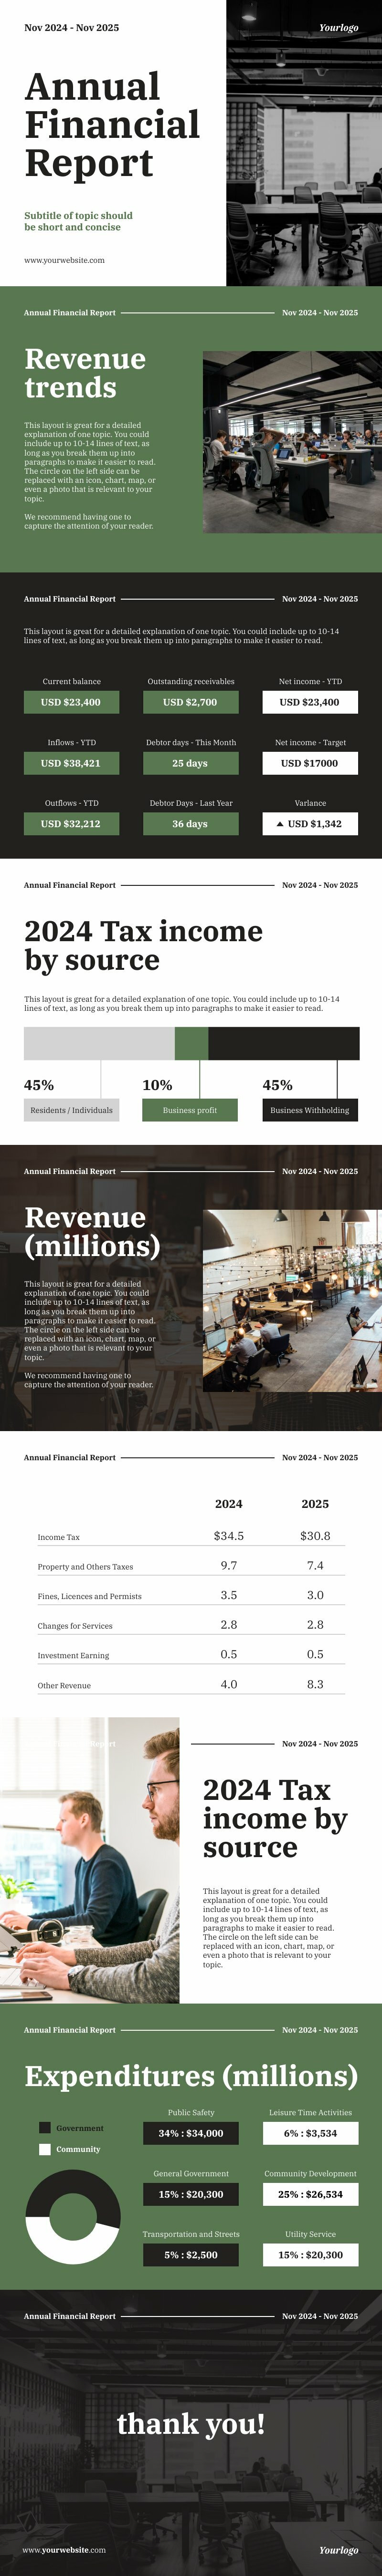
Create financial statements, infographics, and audit reports that look great
Piktochart is so simple that you can immediately use it, without training or graphic design experience. Start with a finance template designed by experts. Customize it to your brand, add the data and quickly get to a professionally-looking finance presentation or report.
Get started nowStart creating finance visuals right away
Join more than 14 million people who already use Piktochart to make graphics, reports, and presentations.