The new way of visualizing timelines

Create With Speed
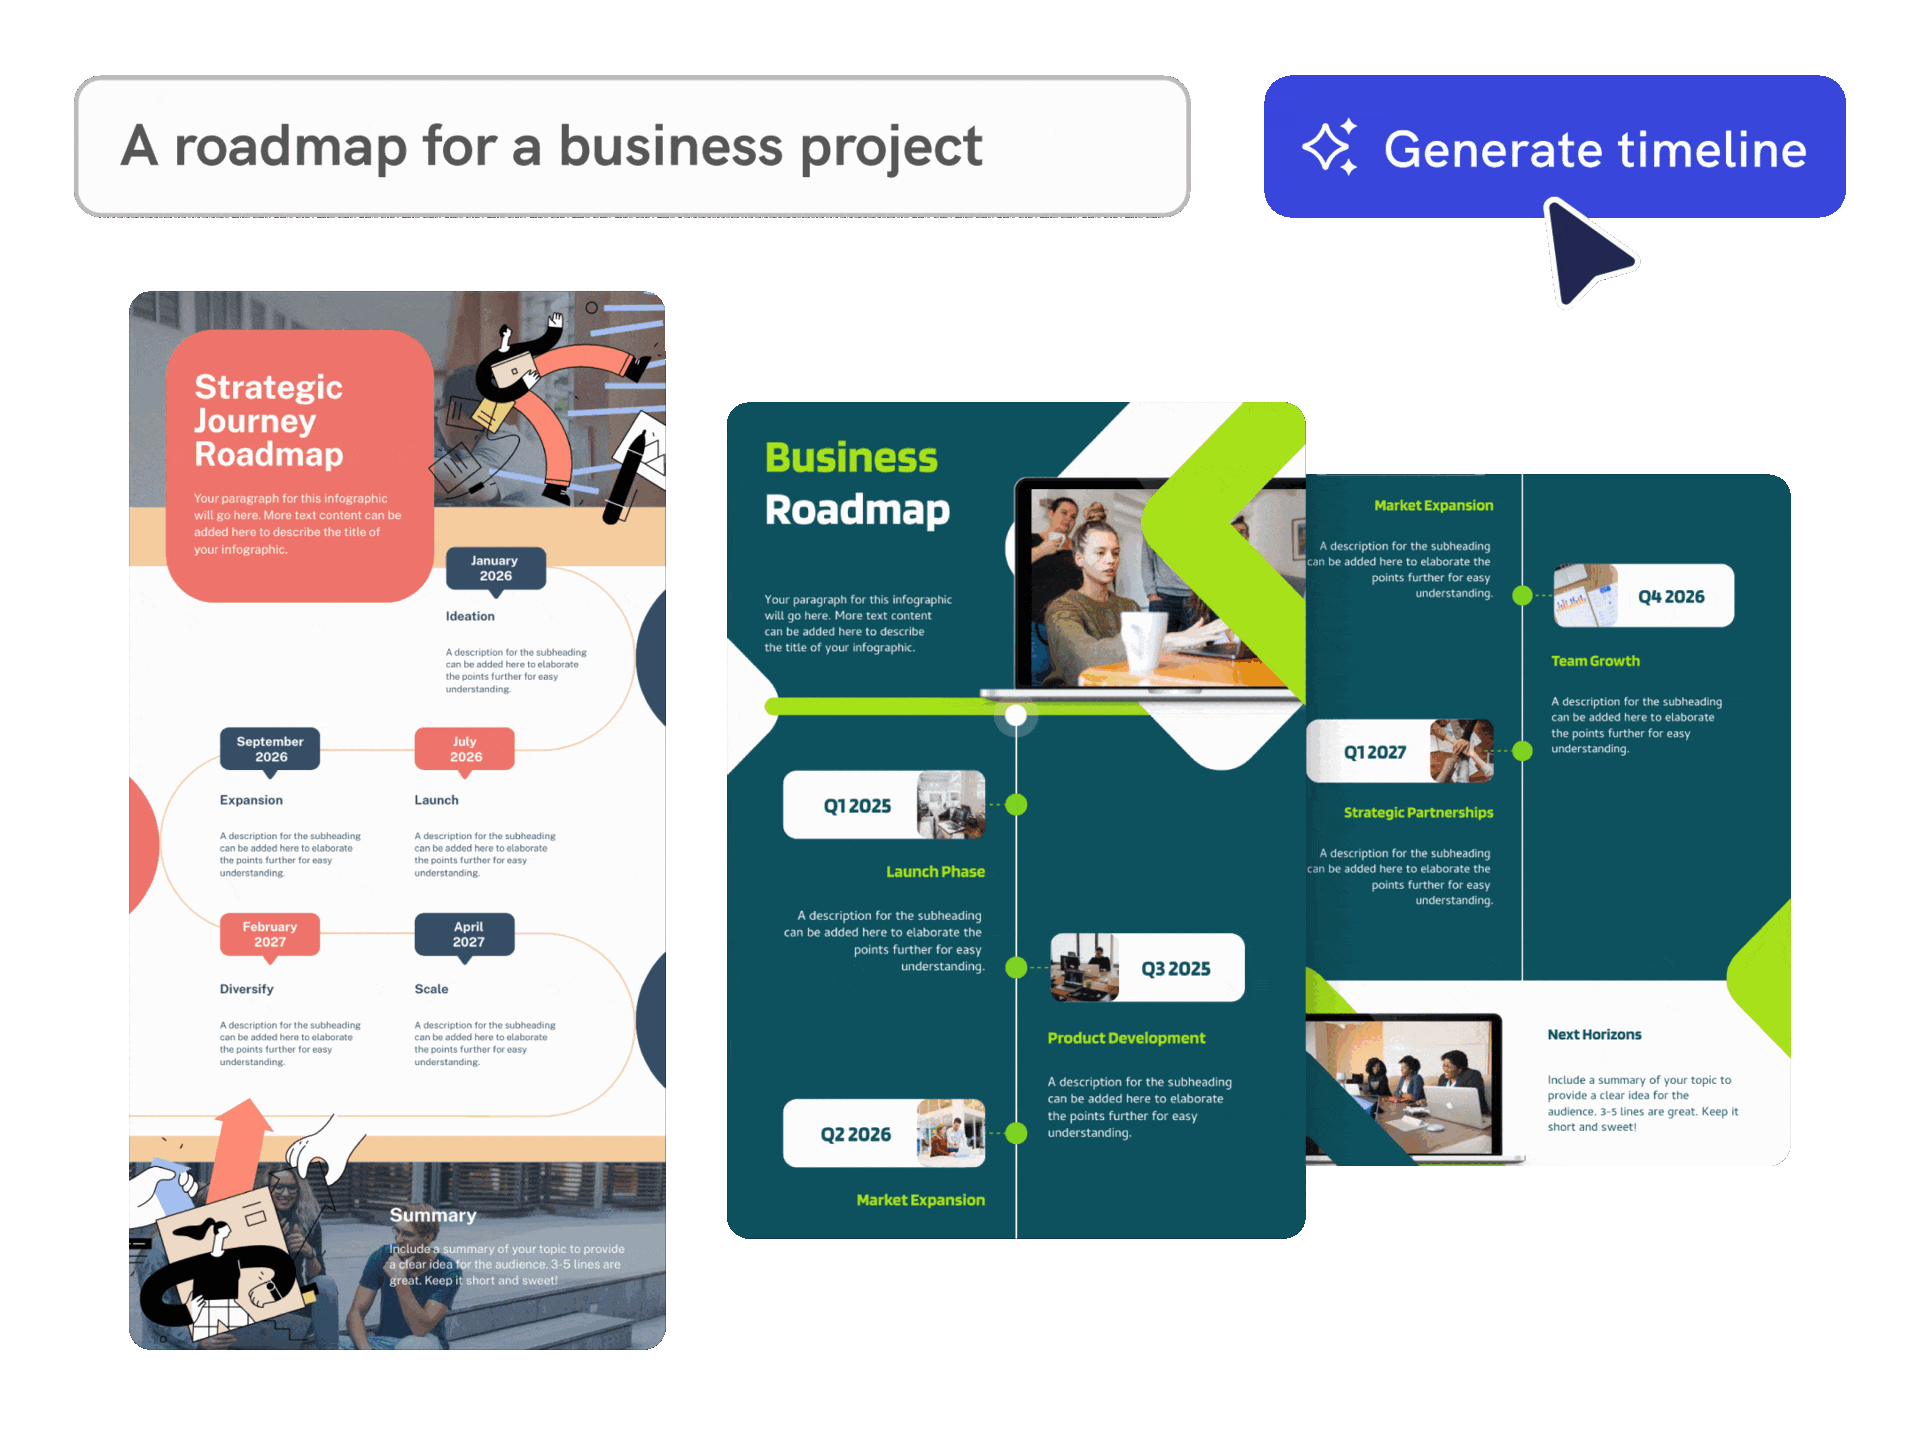
Turn milestones into a timeline infographic fast
Describe the sequence of events you want to show, and Piktochart AI turns your prompt into a structured, editable timeline infographic with clear milestones, dates, and visual hierarchy.
Start creating
Contextualised Content
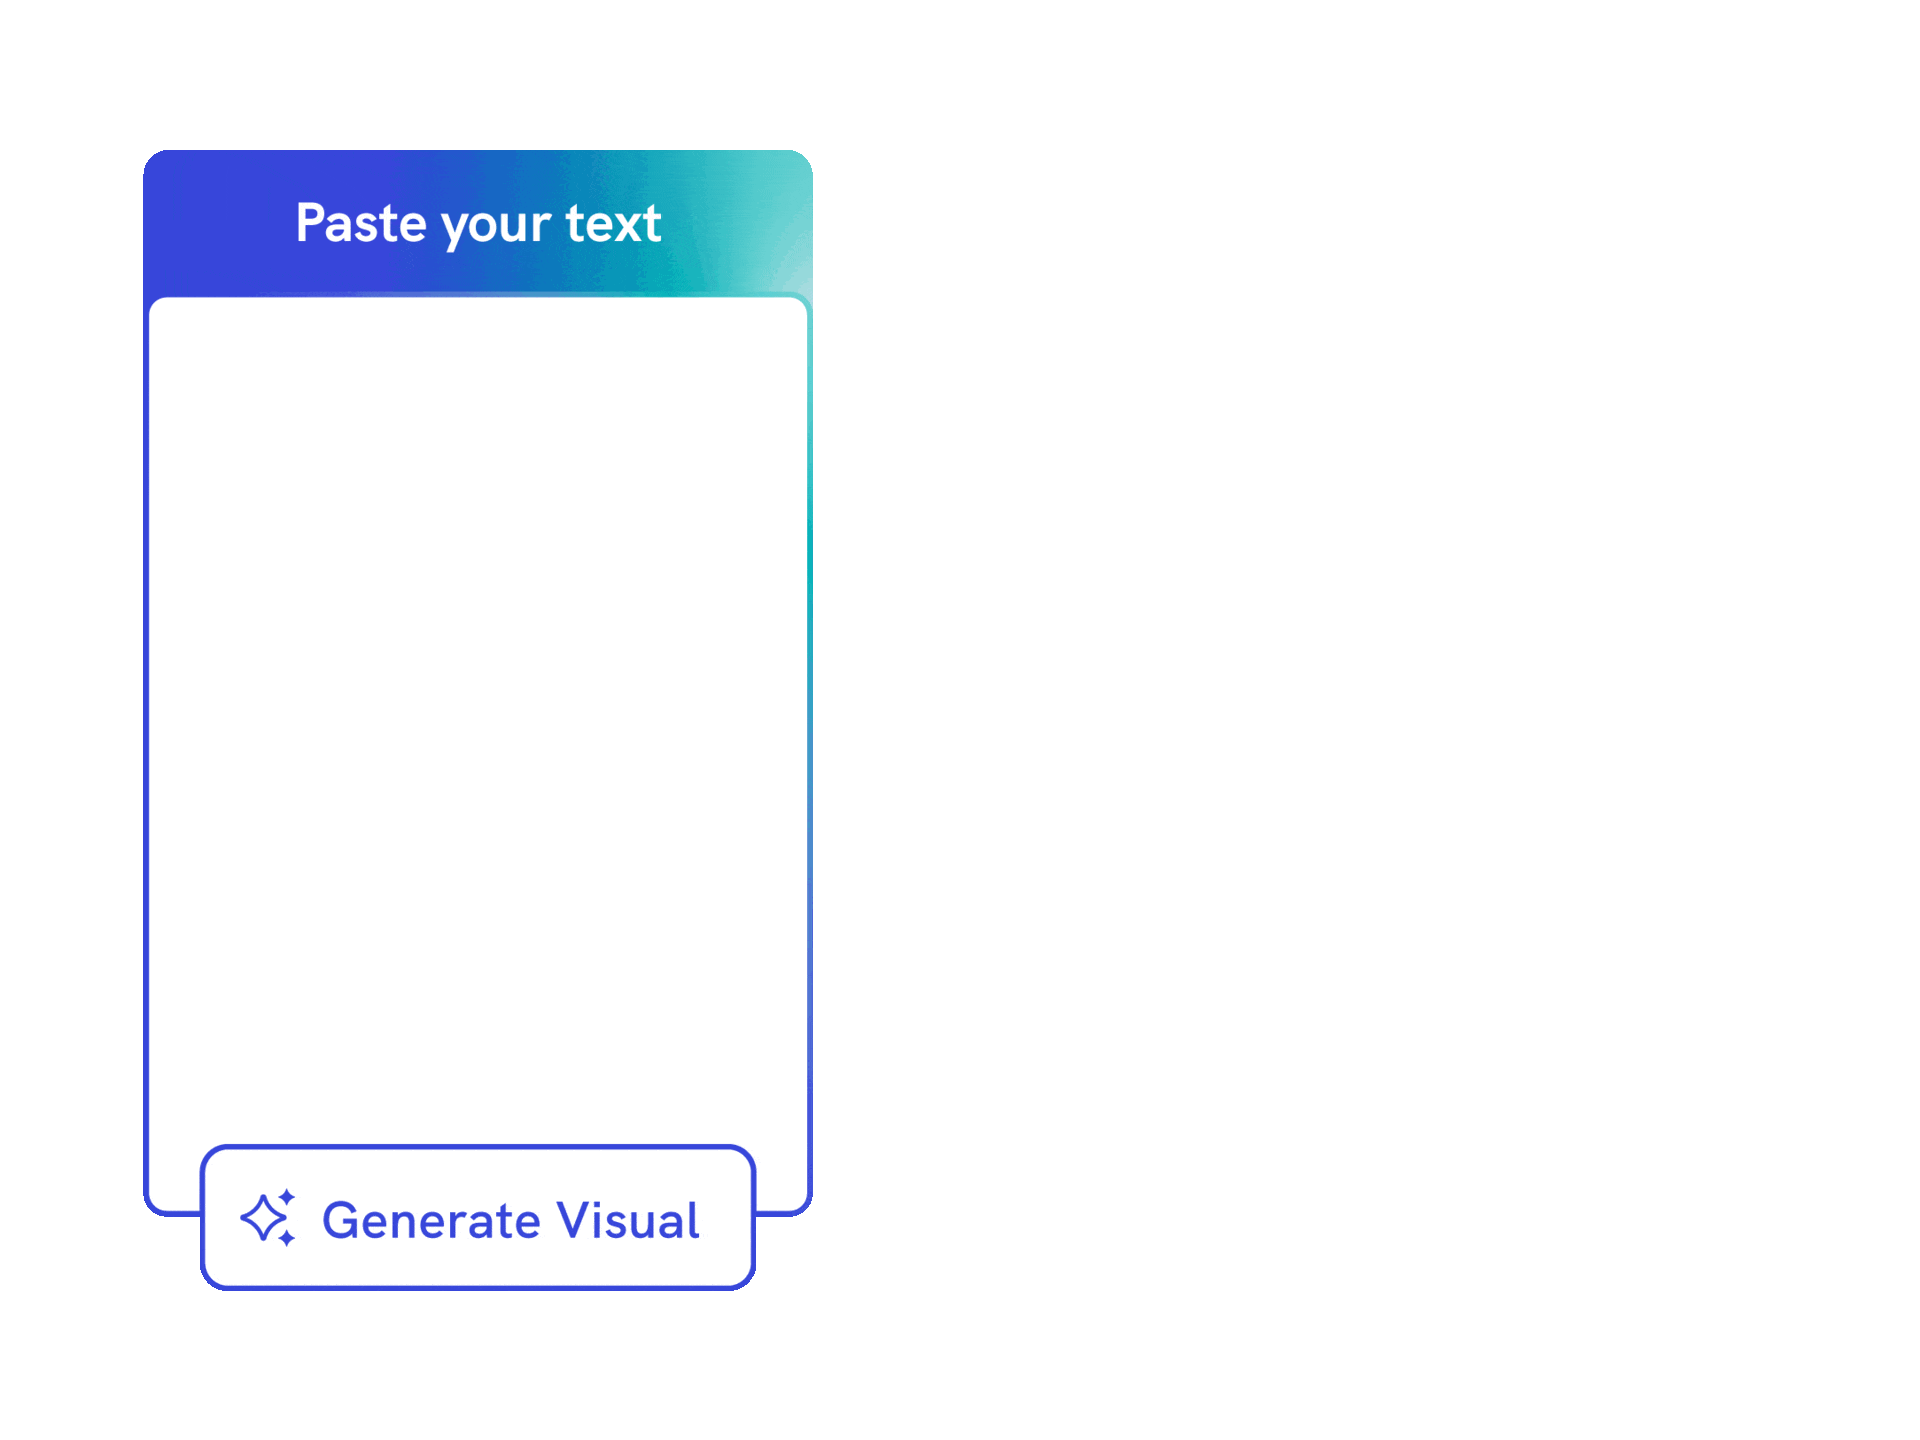
Paste notes or upload content
Start from rough notes, a project brief, lesson material, or an existing document. Piktochart AI helps organize the details into a visual timeline that is easier to scan and present.
Start creating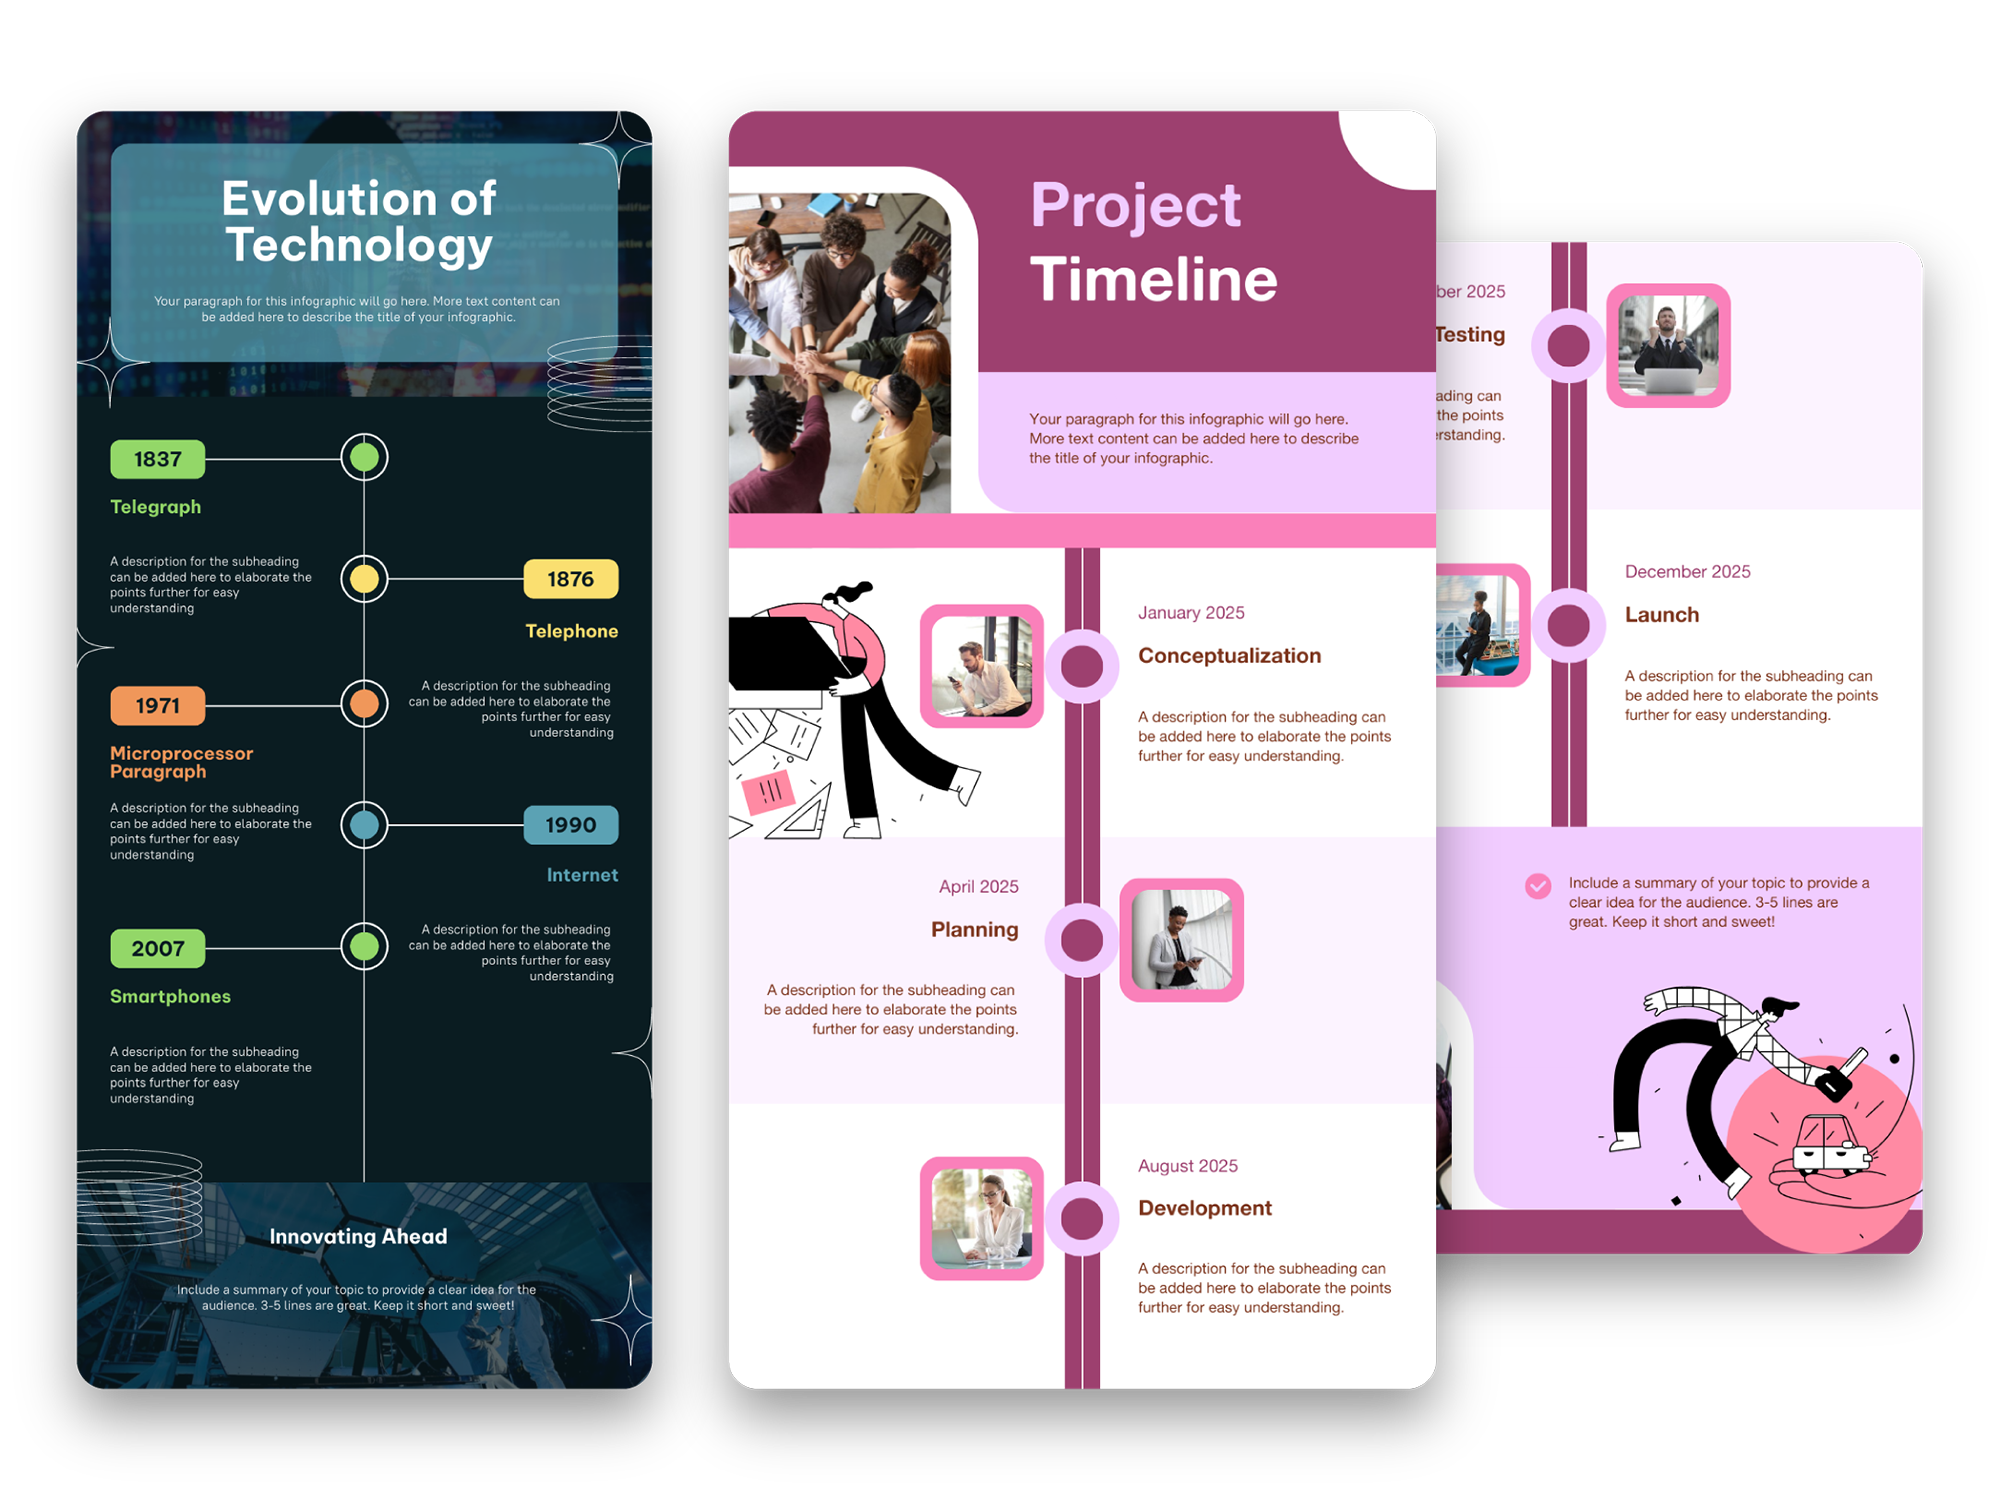
Captivate Your Audience
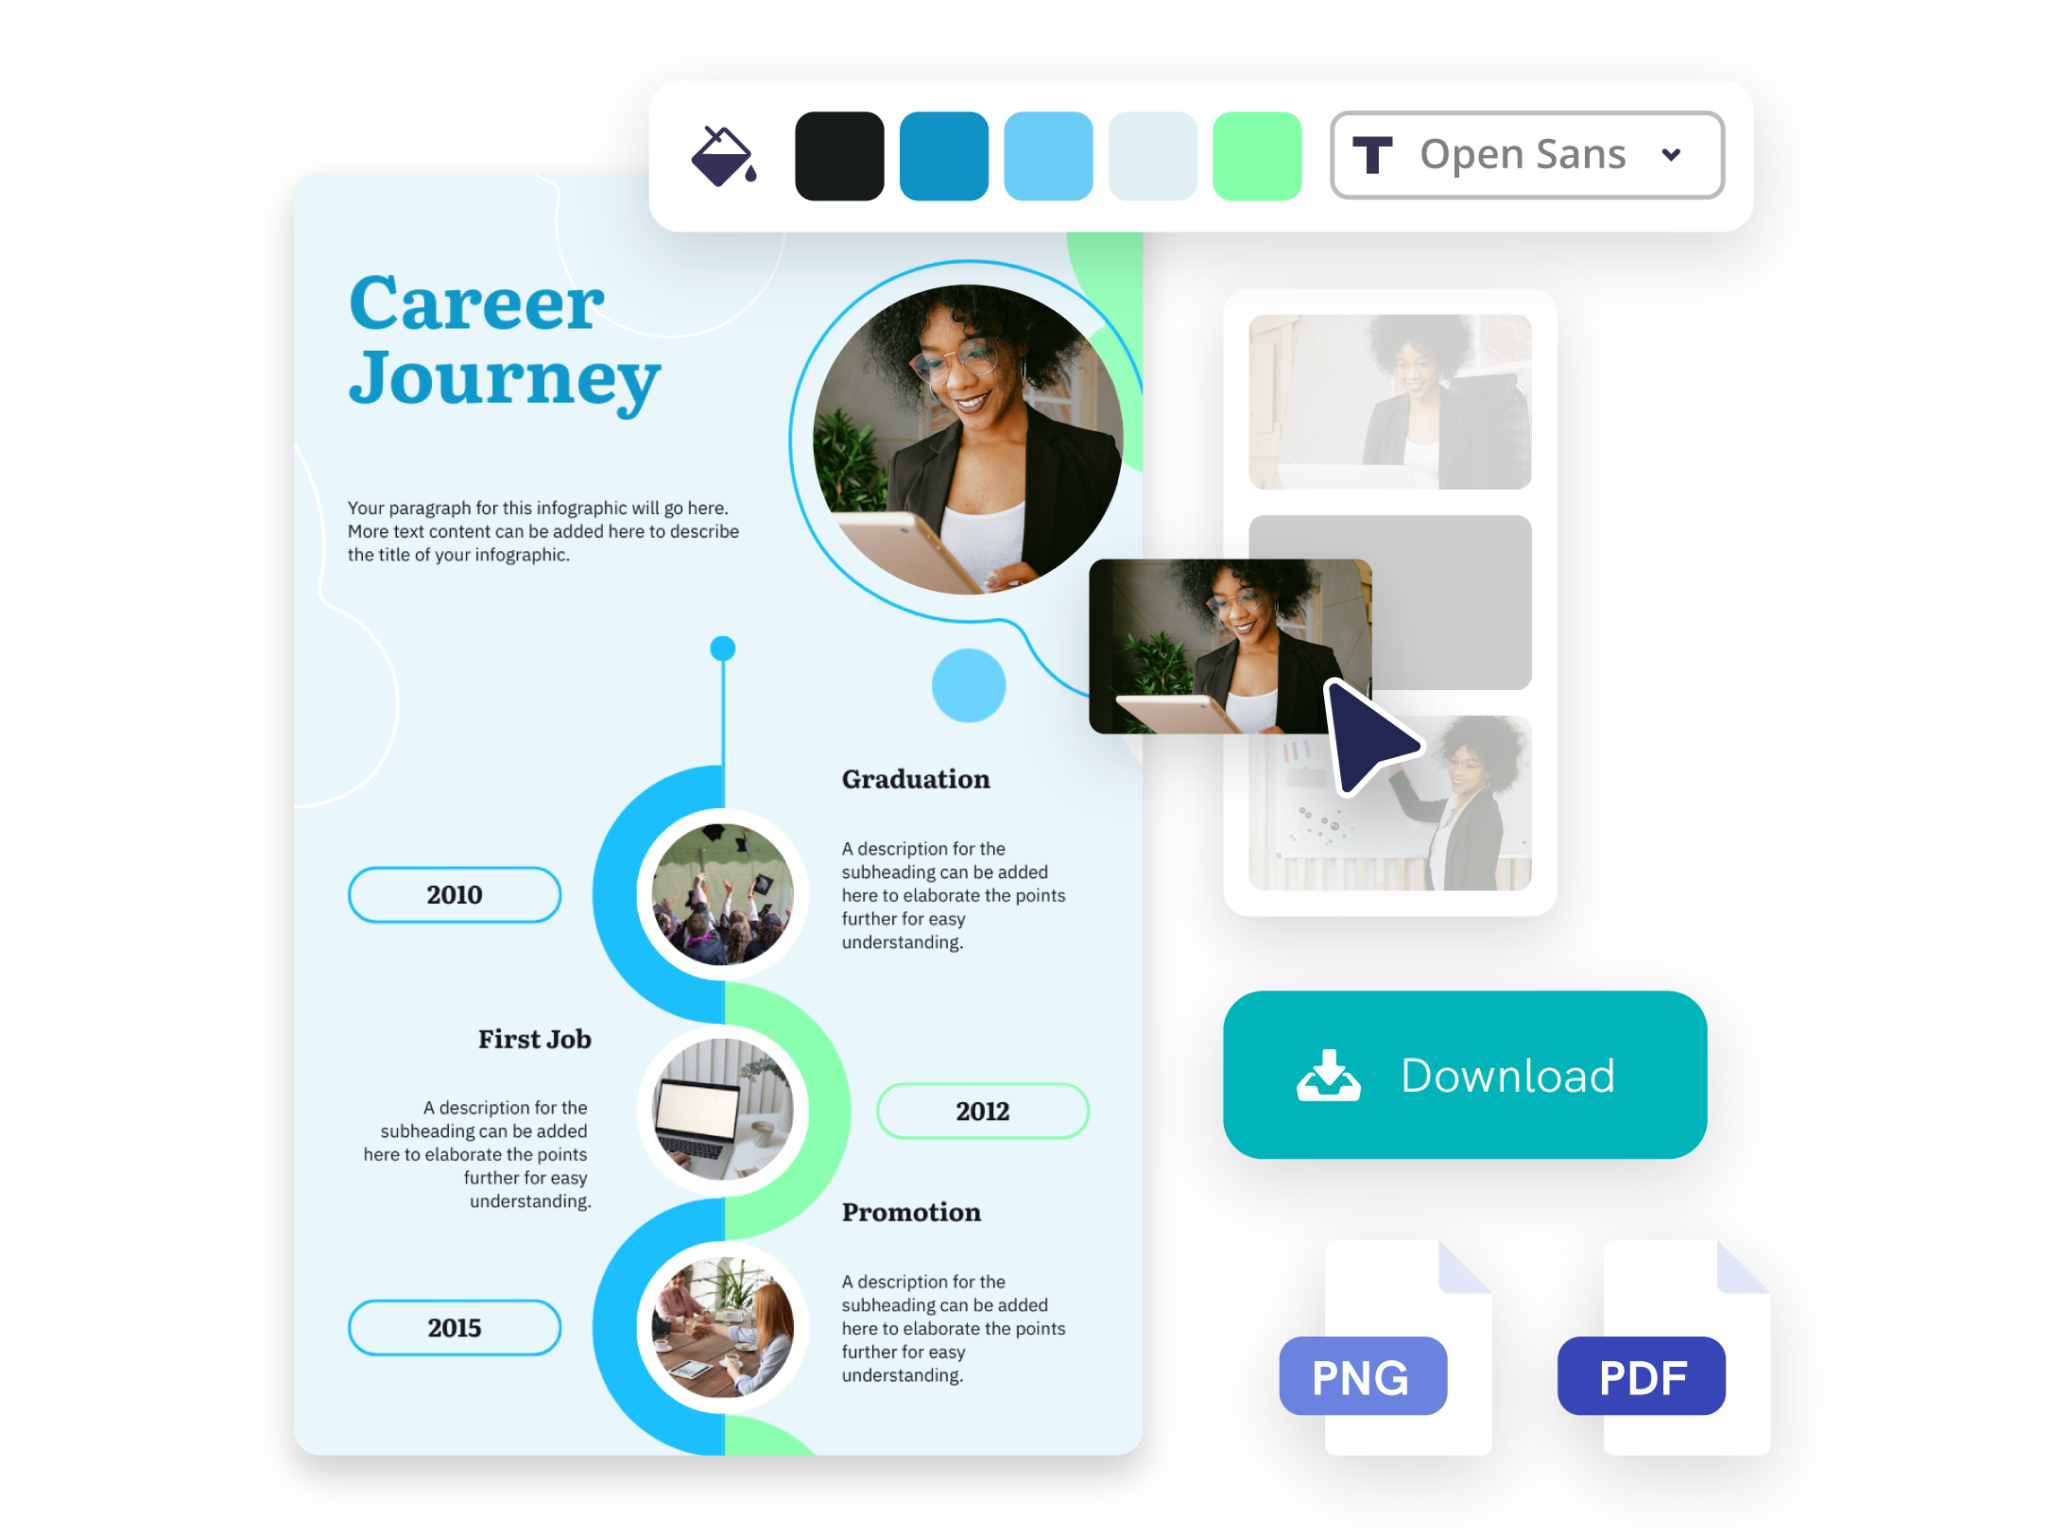
Customize every milestone and layout
Adjust colors, fonts, icons, images, dates, labels, and spacing in Piktochart’s editor so your timeline fits your brand, class, report, or presentation.
Start creating
Creativity With Customization
Express your creativity with ease
Tailor your timelines to match your brand identity with Piktochart AI’s versatile customization options. Choose from a rich library of templates, graphics, and design components that seamlessly integrate with your unique style.
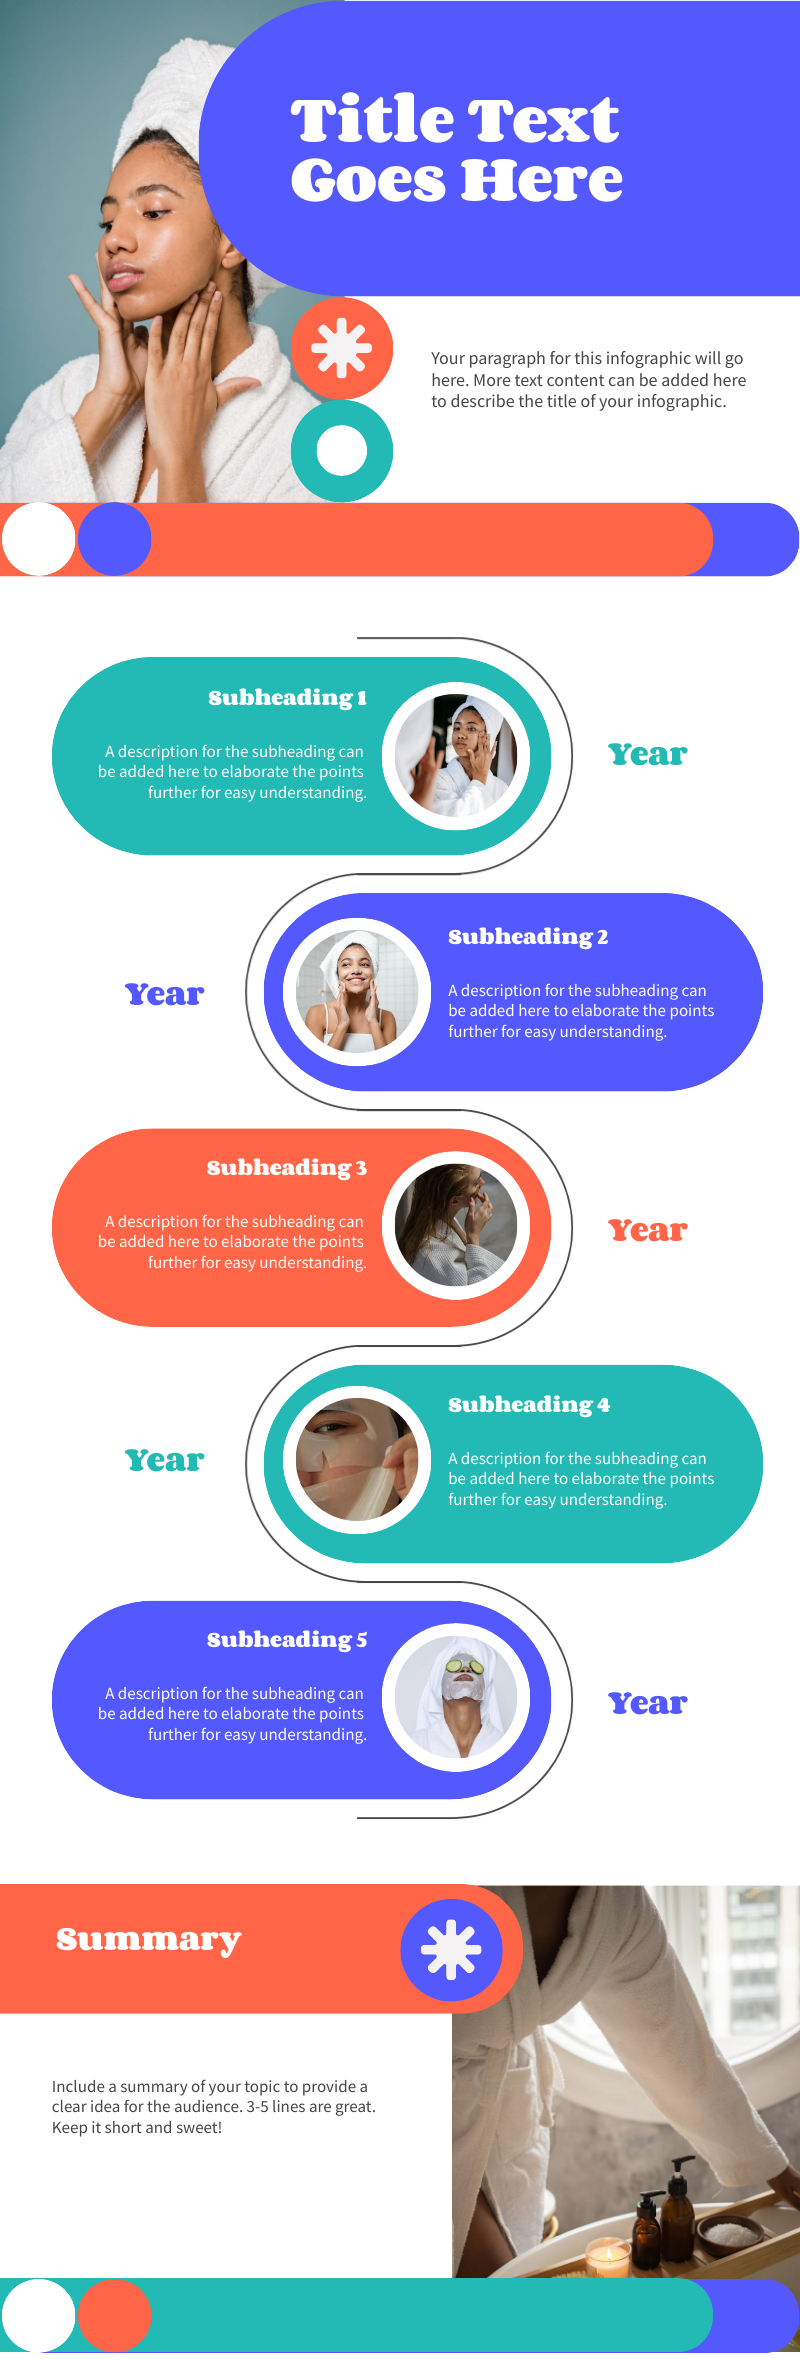
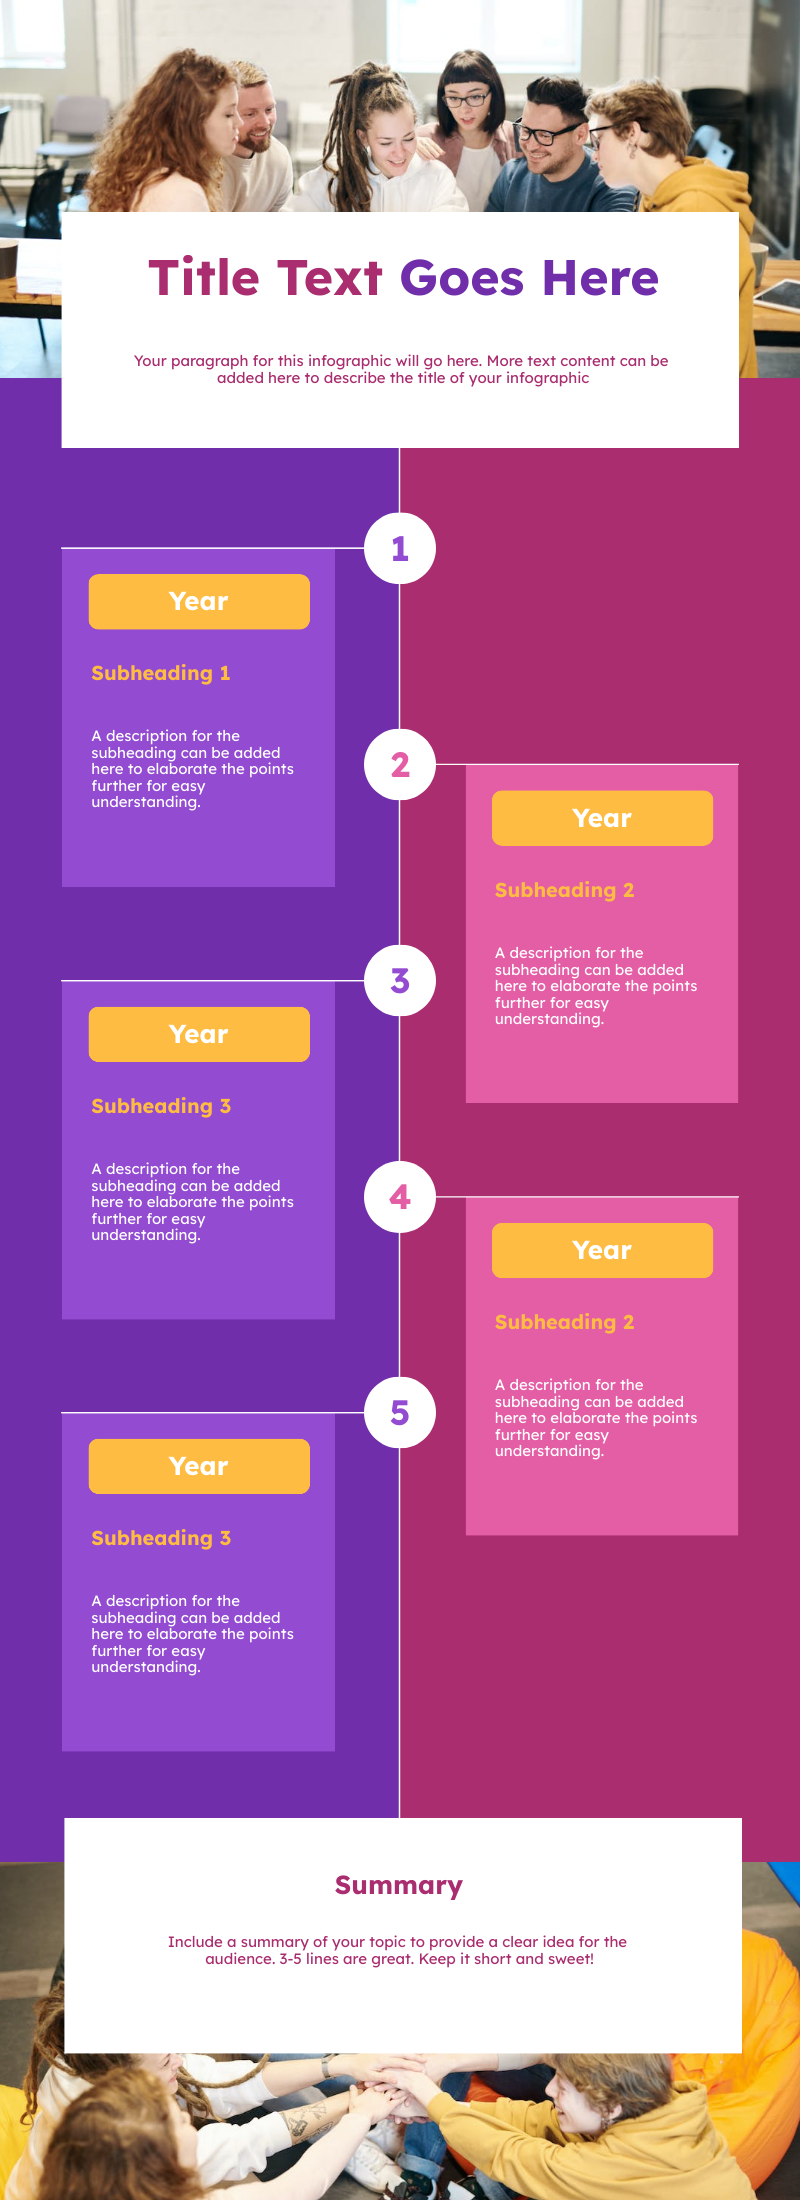
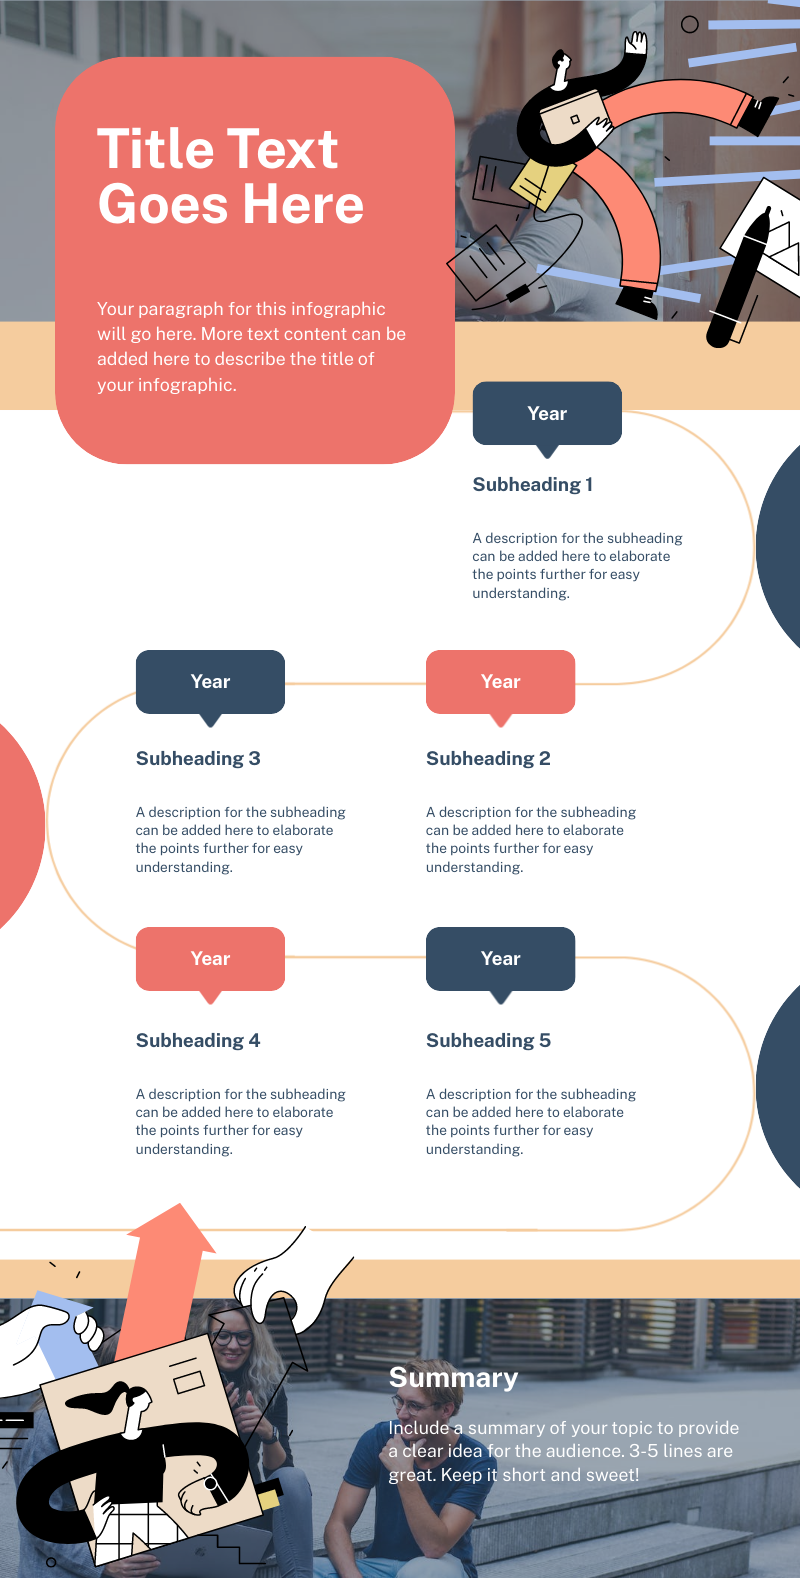
Start creatingTimelines created using Piktochart AI timeline infographic generator


Testimonials
“Piktochart is my go-to tool when I’m looking for a way to summarize data that is easy for our upper management to review. Piktochart provides me with the tools to display data in a creative, visually appealing way.”
“Piktochart has allowed me to change the style of my company’s communications. The campaigns are more visual, modern and attractive thanks to the templates that always serve as inspiration. Now even my colleagues use it! Piktochart helped me to engage, increase participation in events, add value to internal campaigns and to reinforce the culture and communication flow of my business.”
“As an HR Assistant, I have to find new and creative ways to engage our employees and effectively communicate across a large organization. Piktochart has tremendously helped me in achieving this.”
“Piktochart helps me translate often dry financial policies and accounting standards to easy to understand and concise one-pager visuals for management.”
How to create a timeline infographic with AI
1. Describe your timeline infographic
Start with a project timeline, company milestone list, historical event sequence, or uploaded notes. Add the audience, purpose, tone, and any must-include details so the AI can shape a useful first draft.
2. Generate the first visual draft
Piktochart AI turns your prompt or content into an editable timeline infographic with structure, hierarchy, and visual direction already in place.
3. Customize the design
Open the draft in Piktochart’s editor to adjust copy, colors, fonts, icons, images, sections, and brand details. Every generated visual remains editable.
4. Share or download
Use the finished timeline infographic in presentations, campaigns, classes, reports, applications, or team updates. Free accounts can start with 60 AI credits every month.
What can you create with an AI timeline infographic generator?
Piktochart AI works best when you need a clear, editable visual instead of a blank canvas. Use it to create project timelines, history timelines, process roadmaps, company milestones, event schedules, and lesson visuals.
Project Timelines
Generate a first draft for project timelines from a short prompt, then customize the content, layout, and visuals in Piktochart’s editor.
History Timelines
Generate a first draft for history timelines from a short prompt, then customize the content, layout, and visuals in Piktochart’s editor.
Process Roadmaps
Generate a first draft for process roadmaps from a short prompt, then customize the content, layout, and visuals in Piktochart’s editor.
Company Milestones
Generate a first draft for company milestones from a short prompt, then customize the content, layout, and visuals in Piktochart’s editor.
Ready to create timeline infographics with AI?
Join more than 14 million people who already use Piktochart to turn information into clearer visuals.