Piktochart Templates Infographics / Environmental
Environmental Infographic Templates
Transform complex eco-data into stunning visuals with our customizable environmental infographic templates. No design experience needed - start creating for free now!
Environmental Infographic Templates
 Environmental
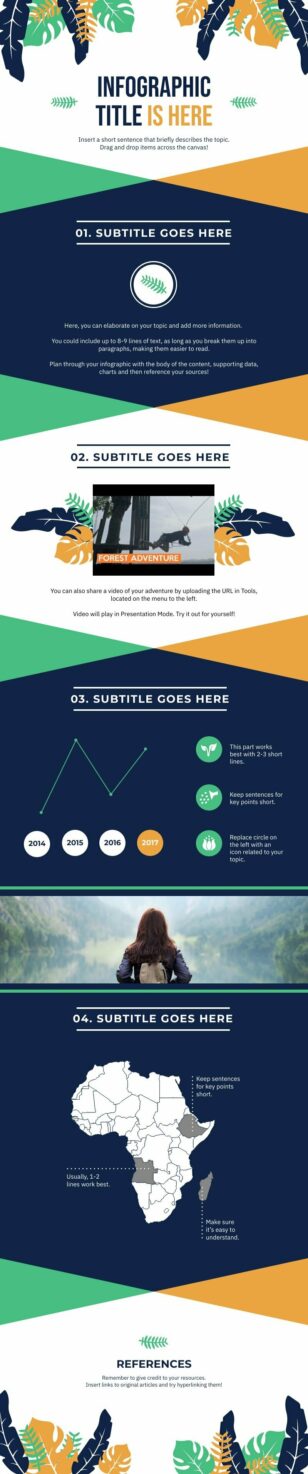
Scientific Report
Environmental
Scientific Report
 Environmental
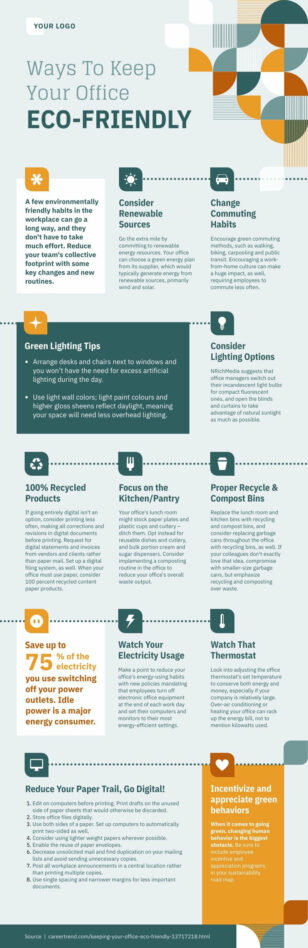
Eco-Friendly Office
Environmental
Eco-Friendly Office
 Environmental
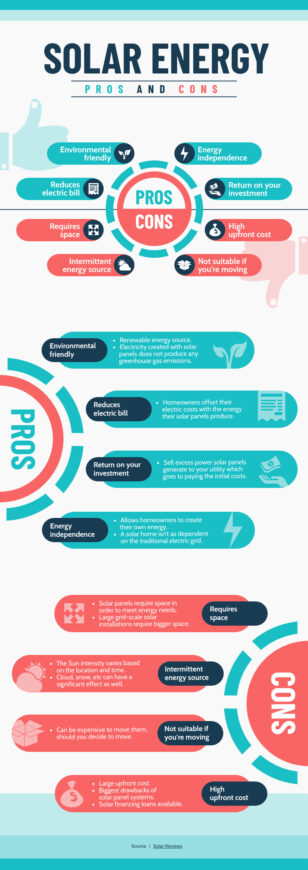
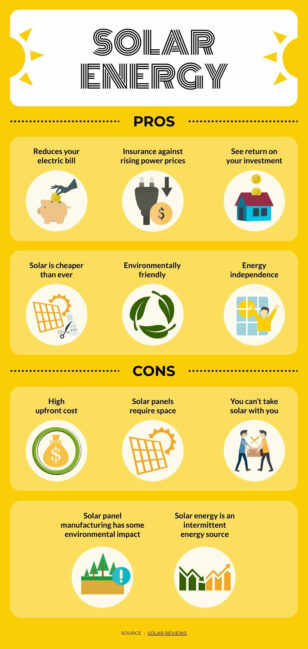
Pros and Cons of Solar Energy
Environmental
Pros and Cons of Solar Energy
 Environmental
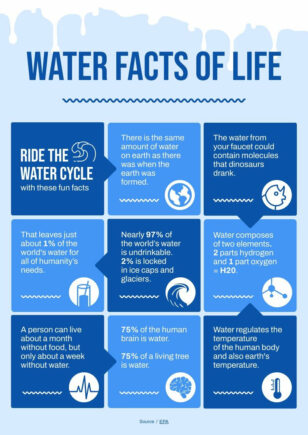
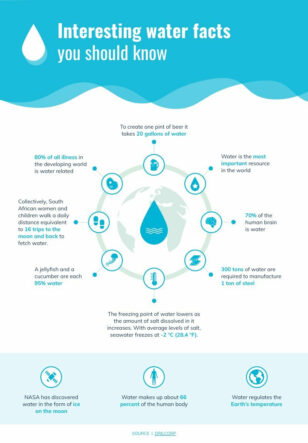
Water Facts of Life
Environmental
Water Facts of Life
 Environmental
 Degradation
Environmental
Environmental Degradation
 Environmental
Pros and Cons of Solar Panels
Environmental
Pros and Cons of Solar Panels
 Environmental
Fun Facts About Water
Environmental
Fun Facts About Water
 Environmental
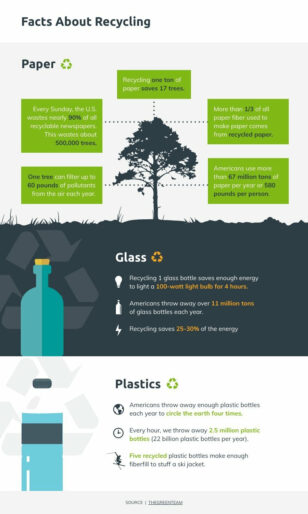
Recycling Facts
Environmental
Recycling Facts
 Environmental
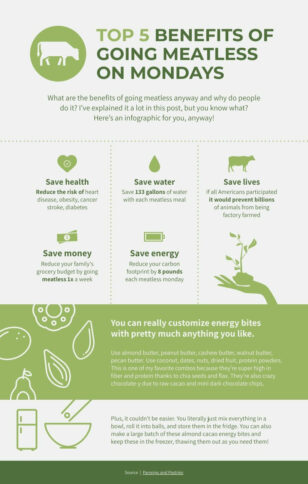
Meatless Mondays
Environmental
Meatless Mondays
 Environmental
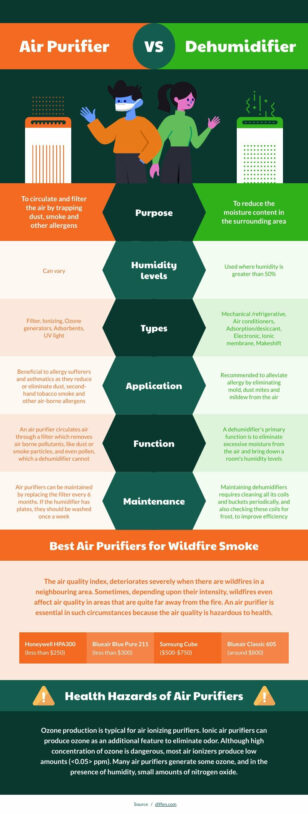
Air Purifier vs Dehumidifier
Environmental
Air Purifier vs Dehumidifier
 Environmental
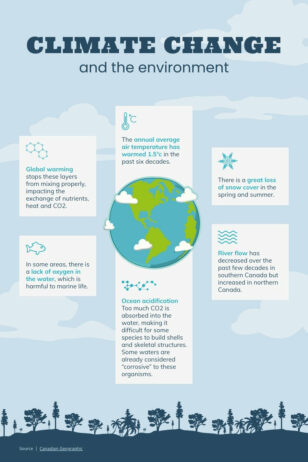
Climate Change and the Environment
Environmental
Climate Change and the Environment
 Environmental
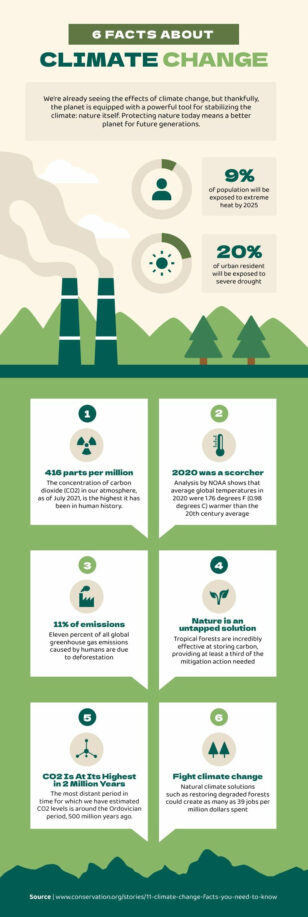
6 Facts About Climate Change
Environmental
6 Facts About Climate Change
 Environmental
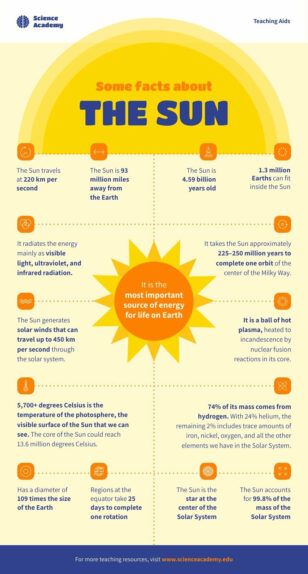
Facts About The Sun
Environmental
Facts About The Sun
 Environmental
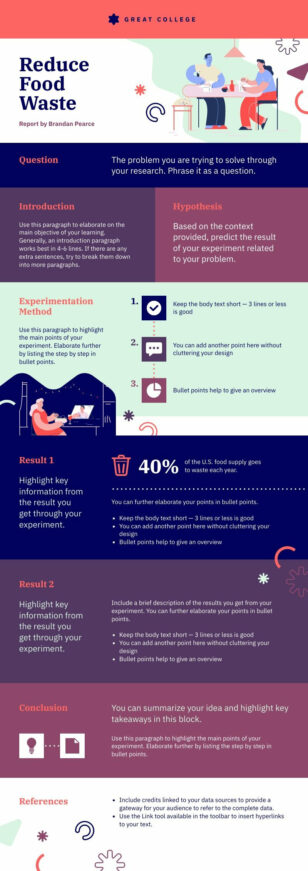
Lab Report Template
Environmental
Lab Report Template
 Environmental
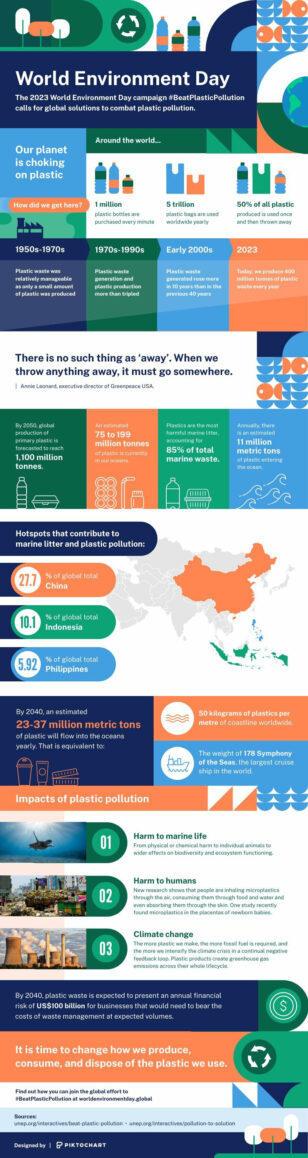
Plastic Pollution
Environmental
Plastic Pollution
 Environmental
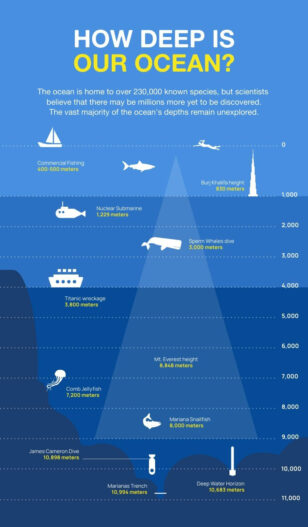
How Deep Is Our Ocean
Environmental
How Deep Is Our Ocean
 Environmental
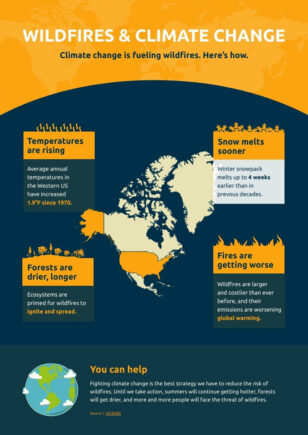
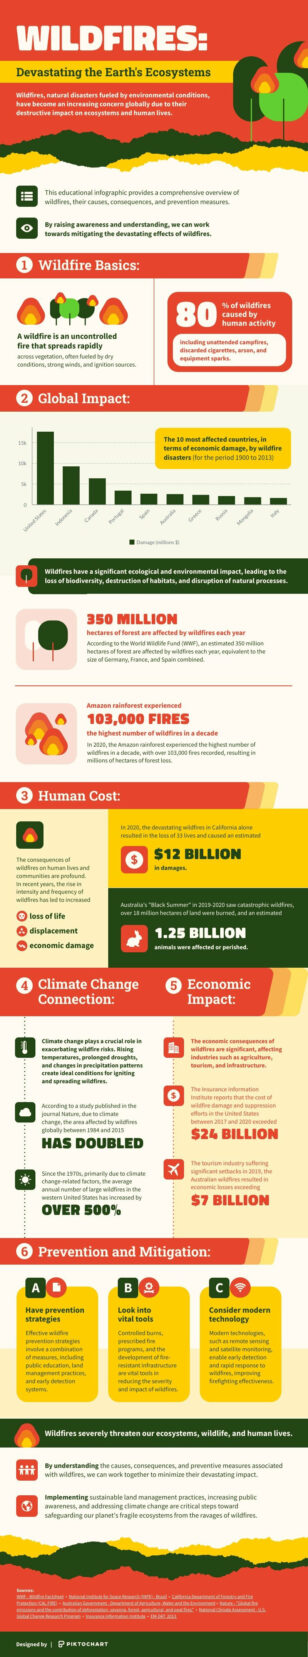
Facts About Wildfires
Environmental
Facts About Wildfires
Environmental infographic templates for awareness campaigns
Climate change continues to alter our environment and ecosystem, and human activities are the main cause of it. The temperature has increased by 1.1 degrees across the globe compared to pre-industrial times. To share more about the impact of greenhouse gases and human activities on the environment, Piktochart offers a diverse collection of environmental infographic templates, empowering users to present eco-data effectively.
From climate change statistics to sustainability initiatives, our designs cover a wide range of environmental topics. Each template is fully customizable, allowing you to adapt colors, fonts, and layouts to match your brand or project needs.
Creating impactful environmental infographics has never been simpler. Our user-friendly interface enables quick editing, letting you swap out placeholder text and images with your own content effortlessly. Whether you’re a student, educator, researcher, or environmental activist, Piktochart provides the tools to transform complex information into visually appealing graphics.
Start your eco-storytelling journey today with Piktochart’s free environmental infographic templates. Engage your audience, raise awareness, and inspire action through compelling visual narratives.
Want an environmental infographic in seconds? Try our AI design generator — describe your topic and the tool produces a visual you can refine in our editor.
Environmental Infographic FAQs
What data sources should I cite in an environmental infographic?
Pull from authoritative sources like the IPCC, NOAA, World Bank, or peer-reviewed journals, and credit them in a small footnote at the bottom of the infographic.
How do I visualise climate change statistics clearly?
Use bar charts for emissions comparisons, line charts for temperature trends, and icon-based visuals for impact — all available in Piktochart’s chart library.
Can I make an environmental infographic without graphic design experience?
Yes — Piktochart’s environmental templates are pre-designed; you just swap in your stats and the layout, colour palette, and typography are already done.
Where can I find eco-themed icons and illustrations?
Piktochart’s icon library includes thousands of free environmental icons (trees, recycling, water, energy, wildlife) you can drop straight into any template.
Can I share an environmental infographic on social media?
Yes — export as PNG for static posts or use Piktochart’s resize feature to adapt the same design to Instagram, Facebook, LinkedIn, and X dimensions.