Piktochart Templates Healthcare / Flu
Flu Infographic Templates
Transform complex flu data into compelling visuals with our flu infographic templates. From symptom comparisons to prevention strategies, these customizable designs help health professionals, educators, and communicators clearly convey crucial information. Empower your audience with engaging, easy-to-understand flu infographics that promote awareness and encourage preventive action.
Flu Infographic Templates
 Flu
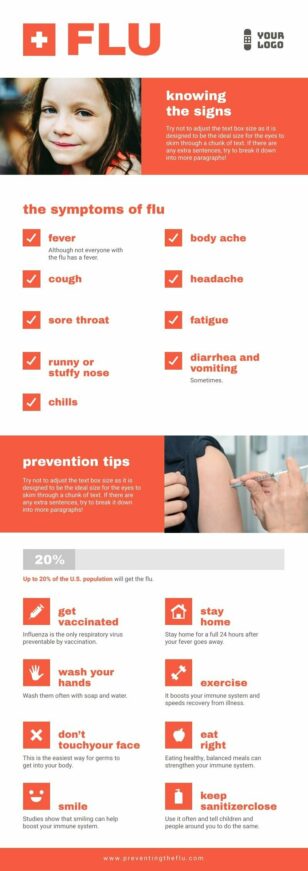
Flu Prevention Tips
Flu
Flu Prevention Tips
 Flu
Flu Prevention
Flu
Flu Prevention
 Flu
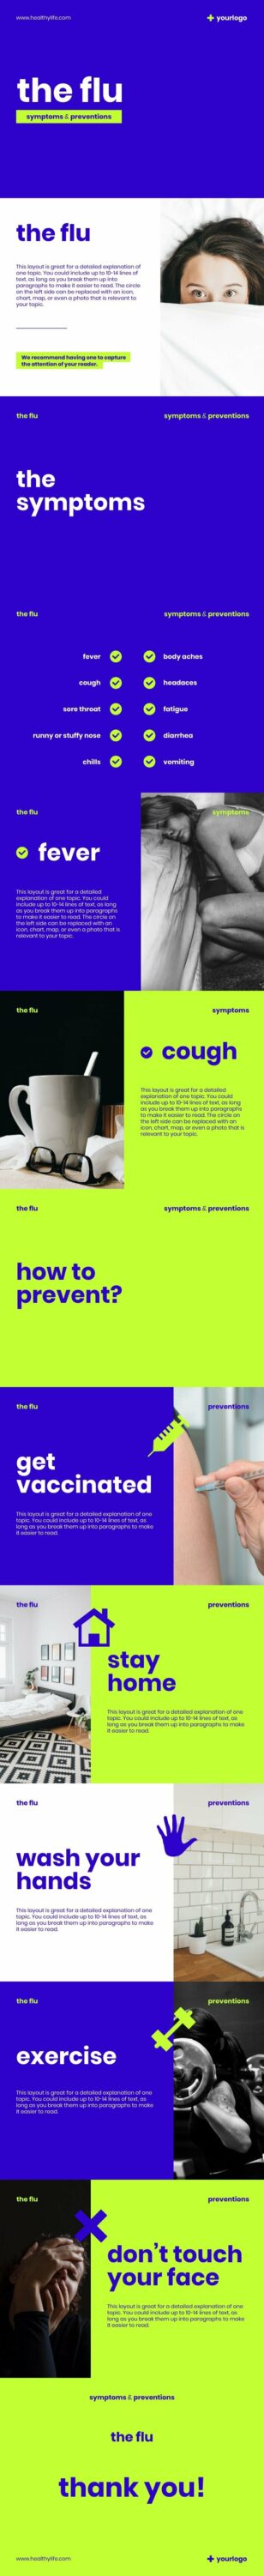
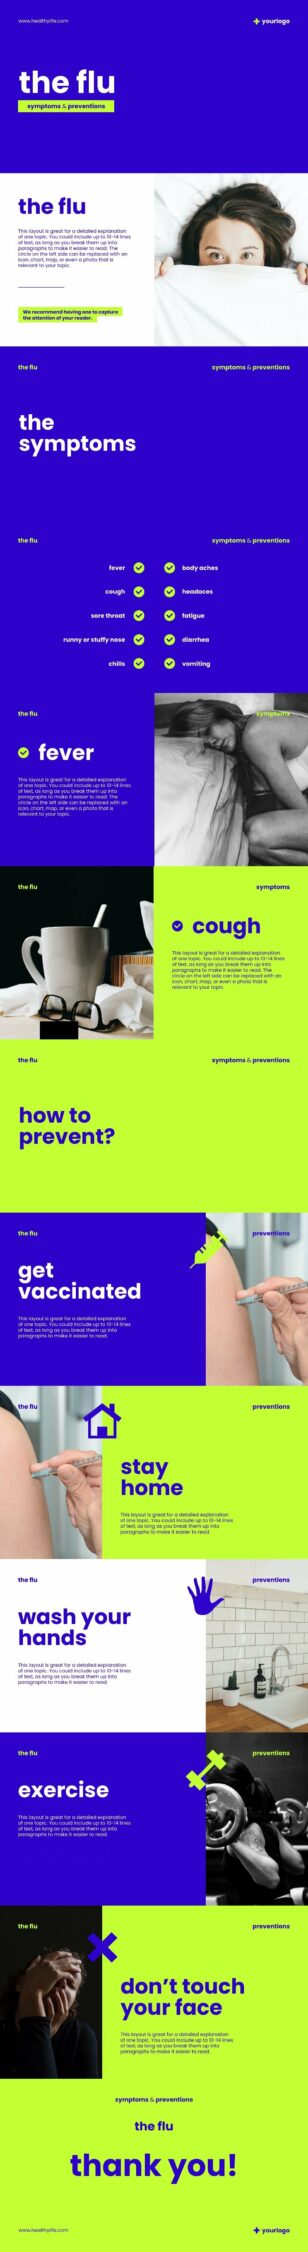
How To Protect Yourself From The Flu Widescreen
Flu
How To Protect Yourself From The Flu Widescreen
 Flu
Handwashing Day
Flu
Handwashing Day
 Flu
World Handwashing Day
Flu
World Handwashing Day
 Flu
Global Handwashing Day Poster
Flu
Global Handwashing Day Poster
How to Design Flu Infographics That Cut Through Misinformation
Harness the power of visual storytelling to combat flu misinformation and boost public health awareness. Our flu infographic templates are your secret weapon in the battle against seasonal influenza, enabling you to create eye-catching, informative visuals that cut through the noise and capture attention.
Whether you’re a healthcare professional, educator, or corporate wellness champion, these templates offer a spectrum of designs to suit your needs. From comparing cold and flu symptoms to illustrating vaccination benefits, each template is a launchpad for your creativity. Imagine transforming complex epidemiological data into a visual journey that your audience can’t ignore.
Our intuitive drag-and-drop interface makes customization a breeze, even for those without design expertise. Inject your brand colors, add your logo, and tailor the content to your specific audience.
Can’t find the perfect template? Let our AI healthcare infographic generator be your design muse — generate a unique, tailored design from your specific flu-related content so your message always hits the mark.
Flu Infographic FAQs
What flu topics work best as infographics?
The strongest seasonal angles are cold-vs-flu symptom comparison, who should get a flu shot (age-tiered recommendations), how flu spreads (transmission timeline), workplace prevention, and what to do if you’re sick. Pair one topic per infographic and time the publish to mid-September for the strongest pre-season reach.
How do I make a vaccination promotion infographic for our clinic?
Use a stat-focused layout: lead with the headline statistic (e.g. “flu vaccine prevents X hospitalizations annually”), follow with a “who’s eligible” age grid, and end with a “where to get yours” block with clinic hours and a QR code. Print at 11×17″ for reception areas or A4 for take-home handouts.
Can I use these templates for a corporate flu prevention campaign?
Yes — corporate wellness teams build a four-asset rhythm in flu season: a launch poster, a “stay home if sick” reminder, a hand-hygiene step infographic, and a clinic-locator email banner. Keep them in one Piktochart template family for visual consistency across Slack, email, and break-room print.
How do I show flu transmission visually without scaring people?
Use a calm color palette (avoid alarming reds), focus on actionable prevention rather than worst-case outcomes, and show the timeline as a step-flow (“Day 1 exposure → Day 2 contagious → Day 3 symptoms”). The goal is informed behaviour, not fear — choose iconography over photography of sick people.
Are CDC and WHO statistics free to use in these designs?
CDC, WHO, and most national public health agencies publish flu data in the public domain — you can reuse the statistics with attribution. Add a small “Source: CDC, 2026” line at the bottom of each infographic and update annually as new flu season data is released (typically each September/October).