Piktochart Templates Infographics / Informational
Informational Infographics
Transform complex data into visually appealing informational infographics. Our customizable templates make it easy to create eye-catching graphics in minutes, no design expertise required.
Informational Infographics
 Informational
Crowdfunding Campaign
Informational
Crowdfunding Campaign
 Informational
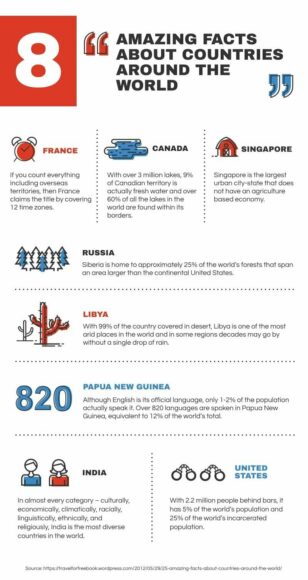
Facts Around The World
Informational
Facts Around The World
 Informational
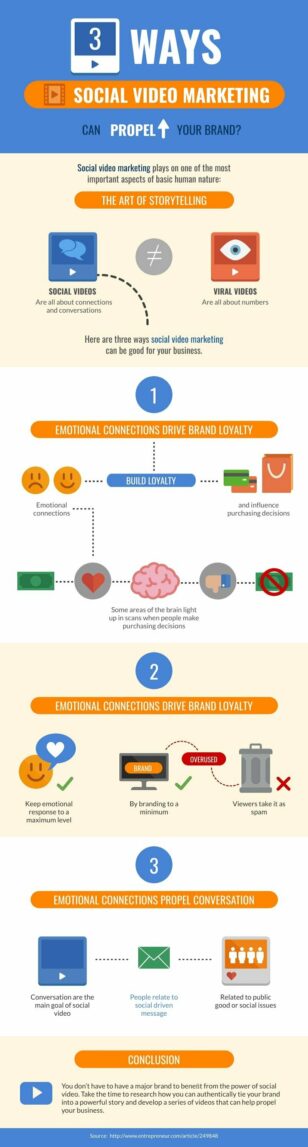
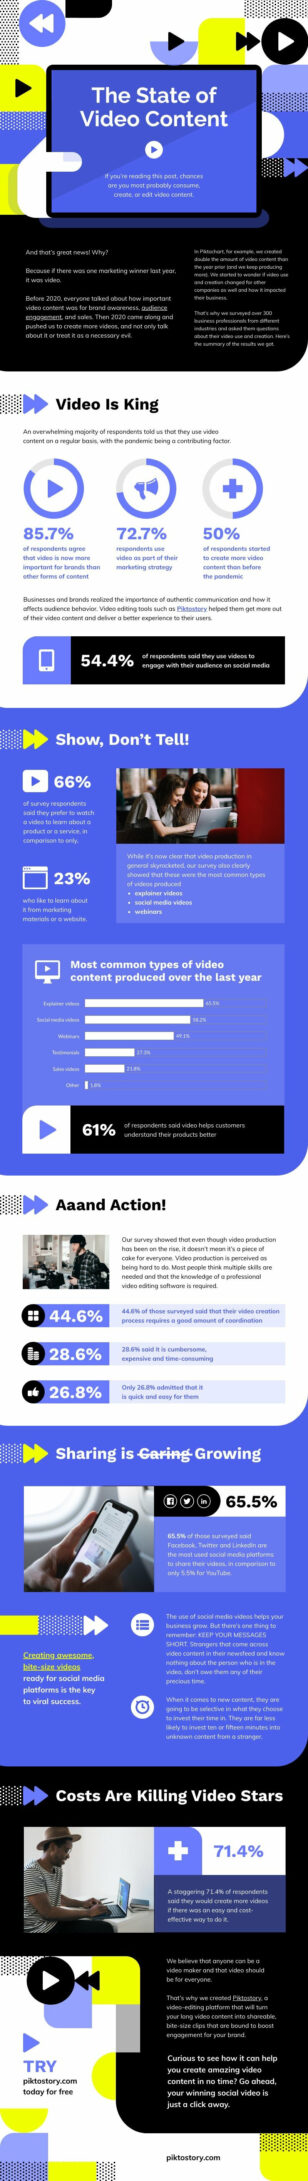
Video Content Marketing
Informational
Video Content Marketing
 Informational
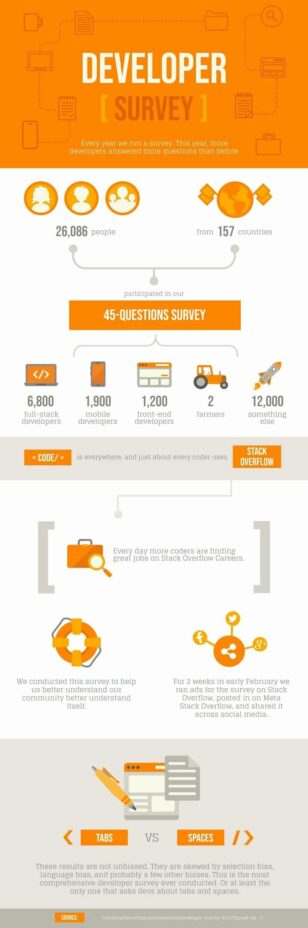
Developer Survey
Informational
Developer Survey
 Informational
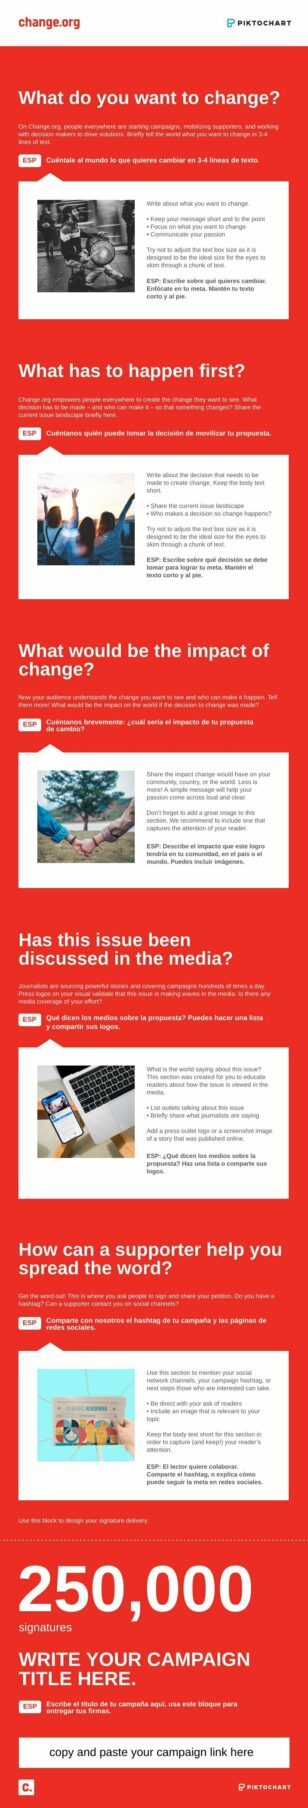
Petition Template
Informational
Petition Template
 Informational
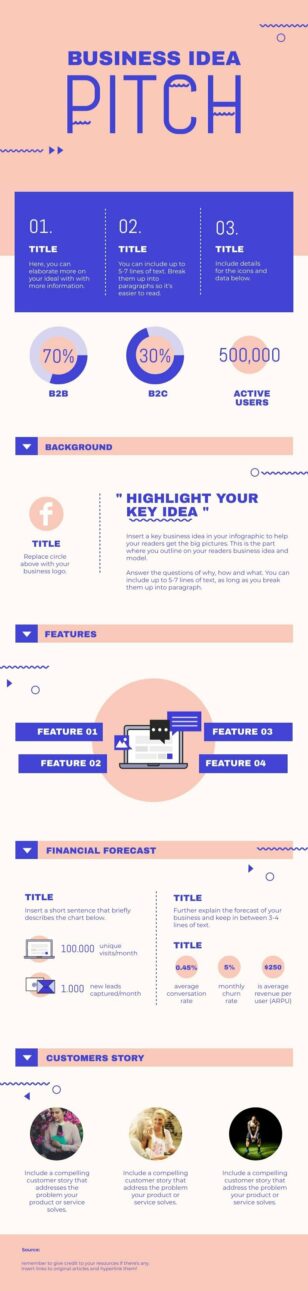
Ideas Pitch
Informational
Ideas Pitch
 Informational
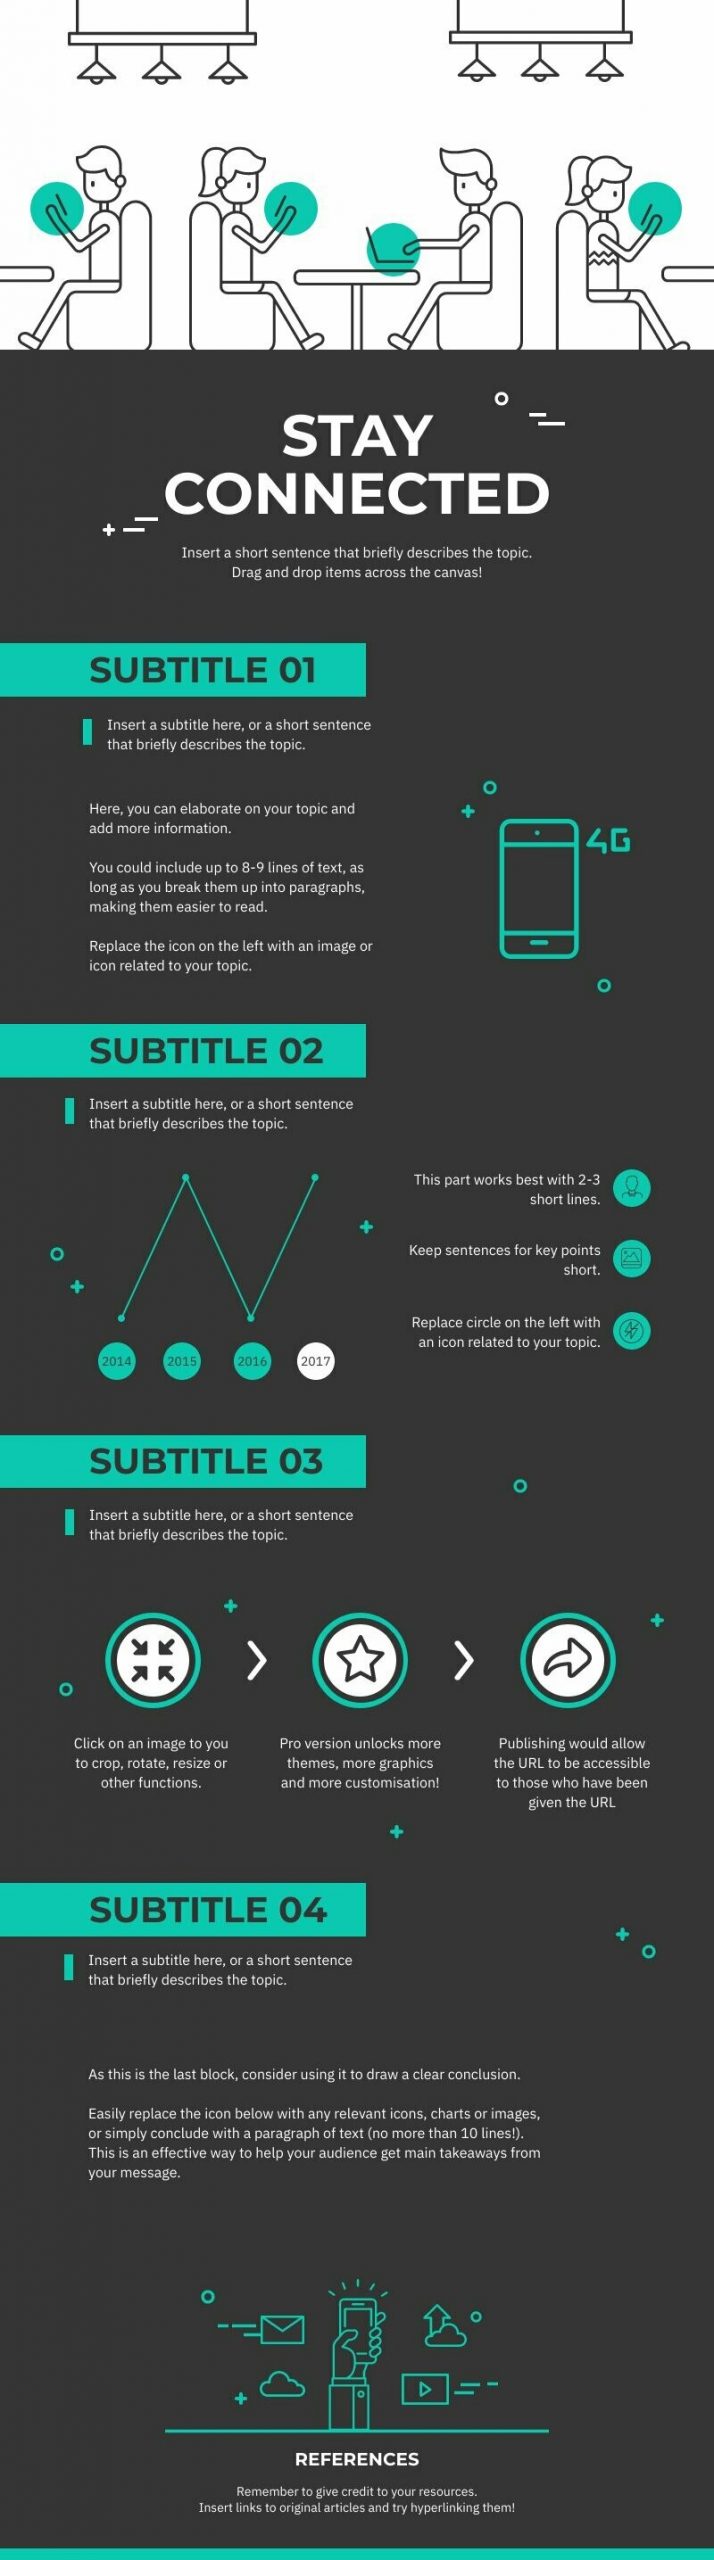
Social Connection
Informational
Social Connection
 Informational
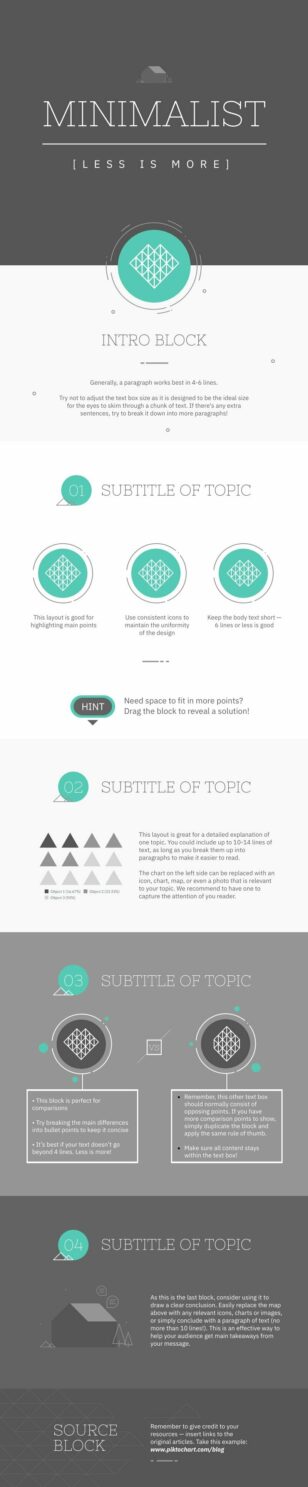
Minimalist Aesthetic
Informational
Minimalist Aesthetic
 Informational
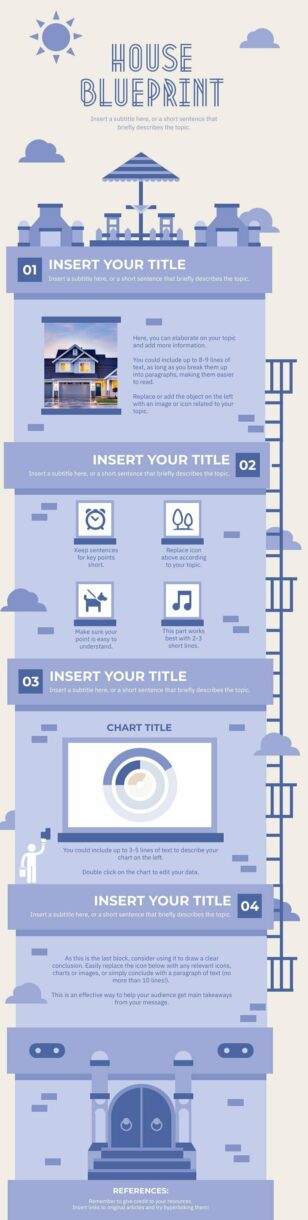
House Designs
Informational
House Designs
 Informational
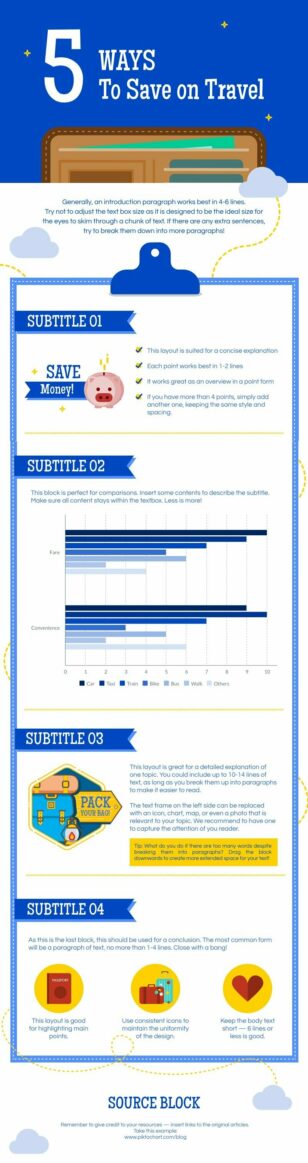
Travel
Informational
Travel
 Informational
Wedding Invitation
Informational
Wedding Invitation
 Informational
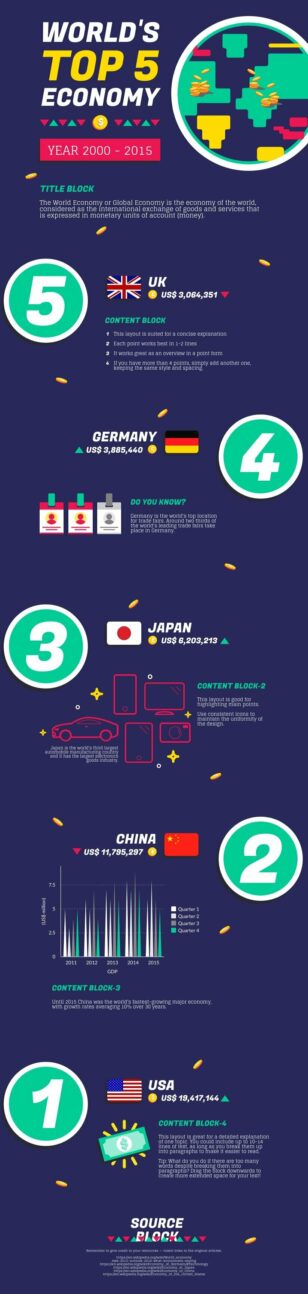
Richest Countries in the World
Informational
Richest Countries in the World
 Informational
Scientific Poster
Informational
Scientific Poster
 Informational
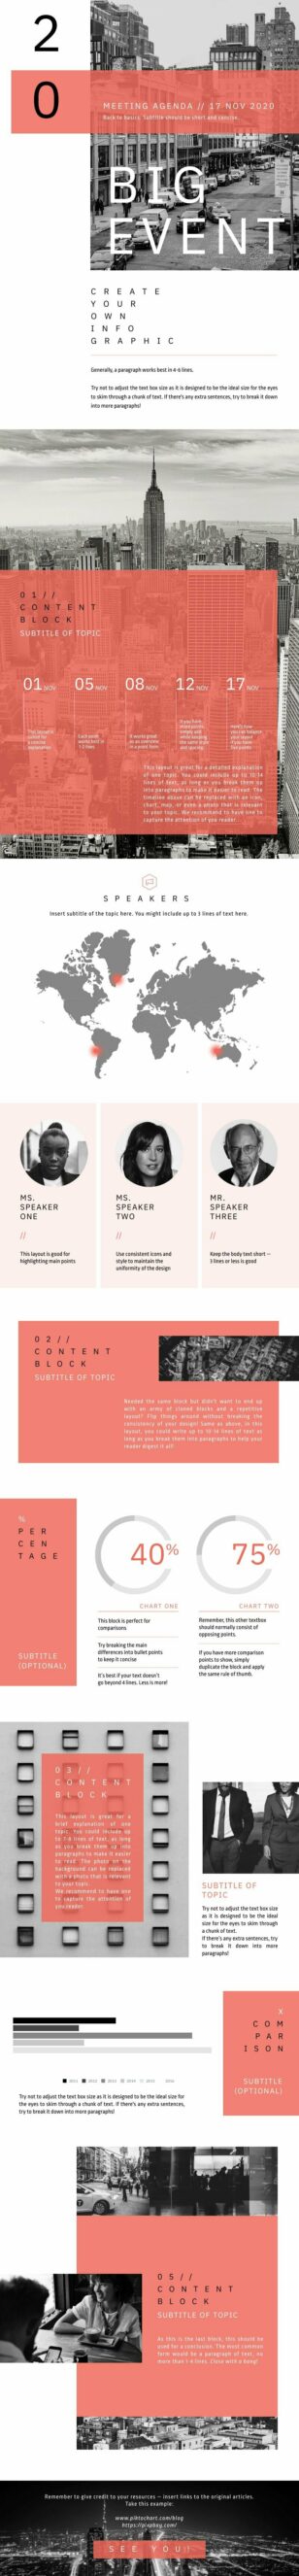
Meeting Minutes
Informational
Meeting Minutes
 Informational
Self Introduction
Informational
Self Introduction
 Informational
Scientific Report
Informational
Scientific Report
 Informational
Game
Informational
Game
 Informational
Cafe Aesthetic
Informational
Cafe Aesthetic
 Informational
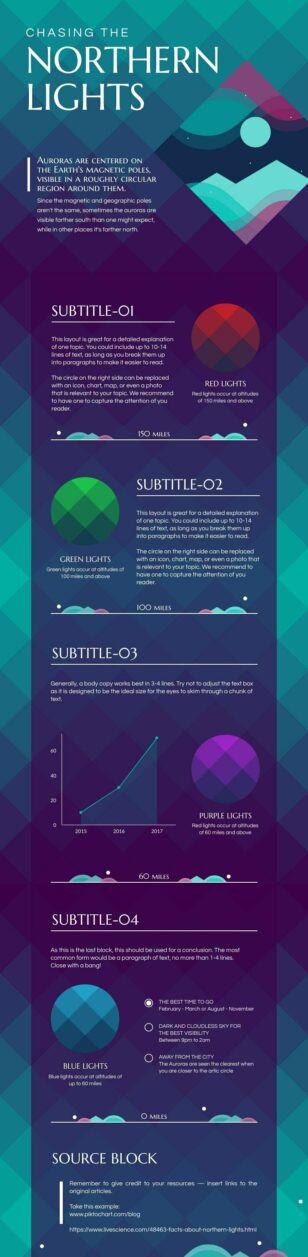
Northern Lights Aesthetic
Informational
Northern Lights Aesthetic
 Informational
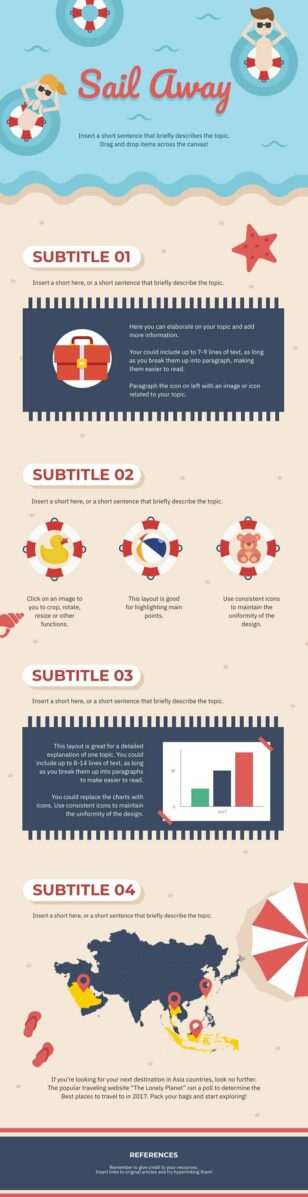
Beach
Informational
Beach
 Informational
Roadmap
Informational
Roadmap
 Informational
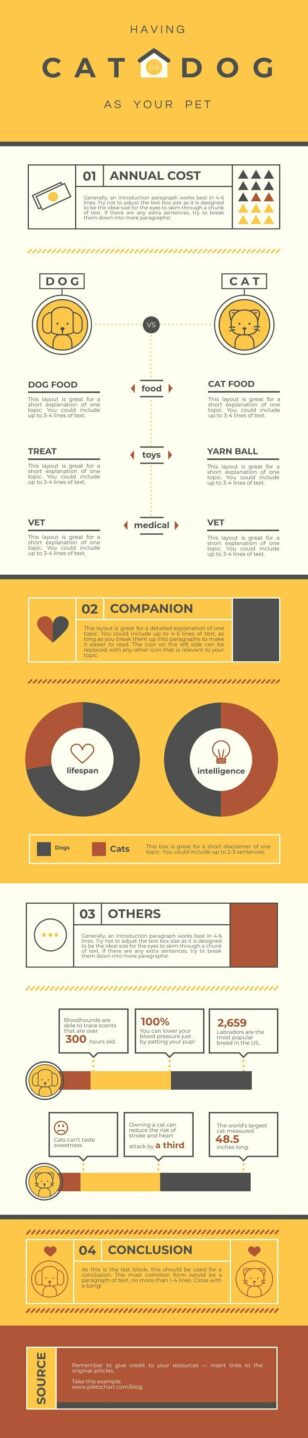
Cats and Dogs
Informational
Cats and Dogs
 Informational
Professional Modern
Informational
Professional Modern
 Informational
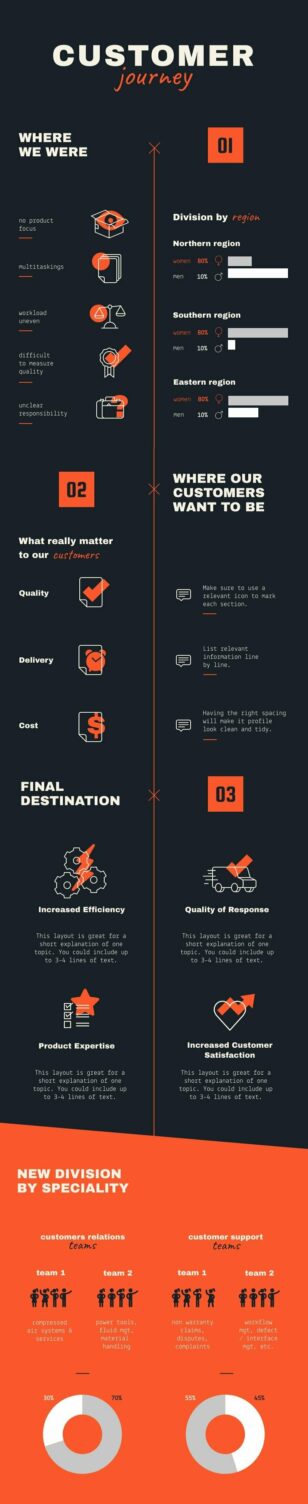
Customer Journey
Informational
Customer Journey
 Informational
Company Values
Informational
Company Values
 Informational
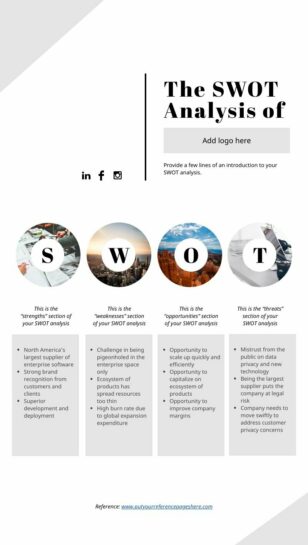
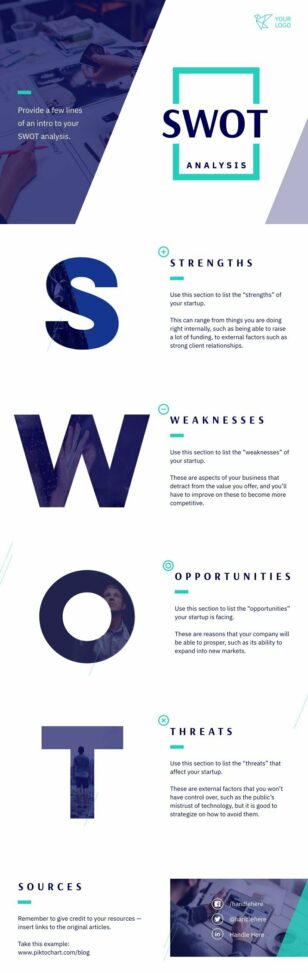
Company SWOT Analysis
Informational
Company SWOT Analysis
 Informational
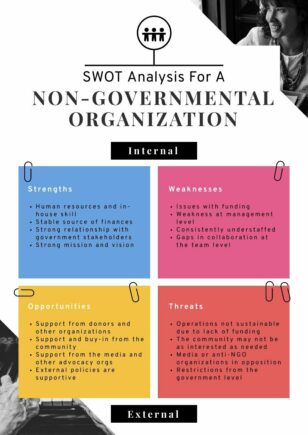
NGO SWOT Analysis
Informational
NGO SWOT Analysis
 Informational
Competitor Analysis
Informational
Competitor Analysis
 Informational
Holiday Newsletter
Informational
Holiday Newsletter
 Informational
Electronic Recruitment
Informational
Electronic Recruitment
 Informational
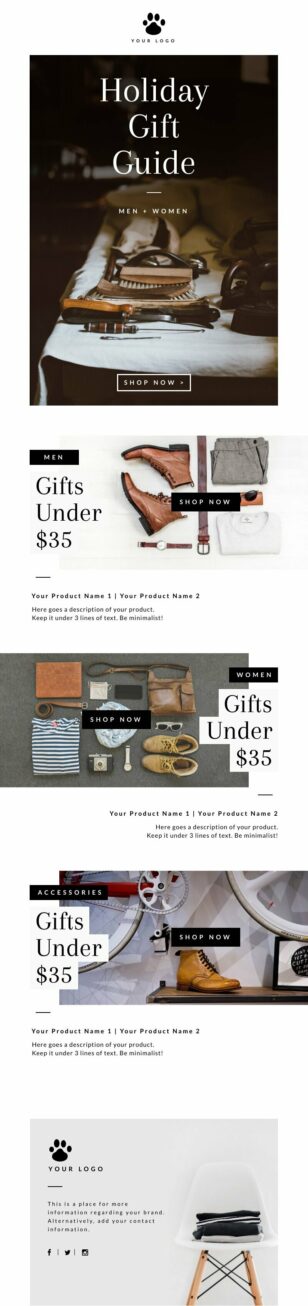
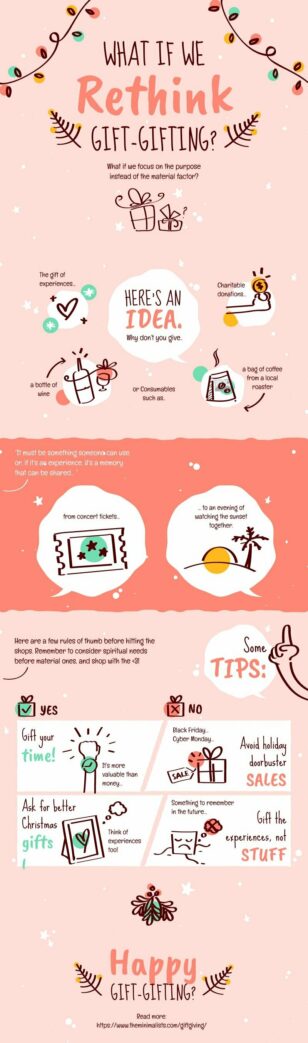
Gift Guide
Informational
Gift Guide
 Informational
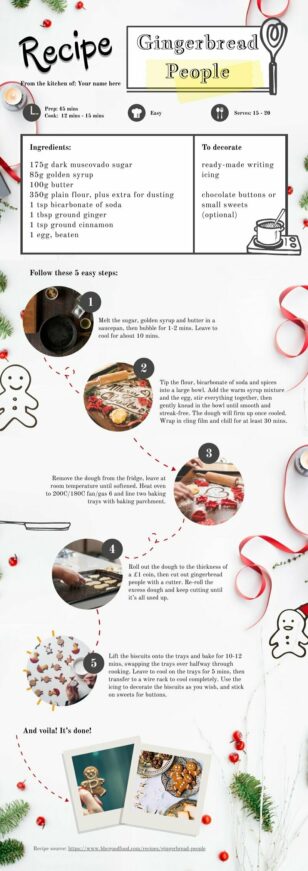
Gingerbread Men
Informational
Gingerbread Men
 Informational
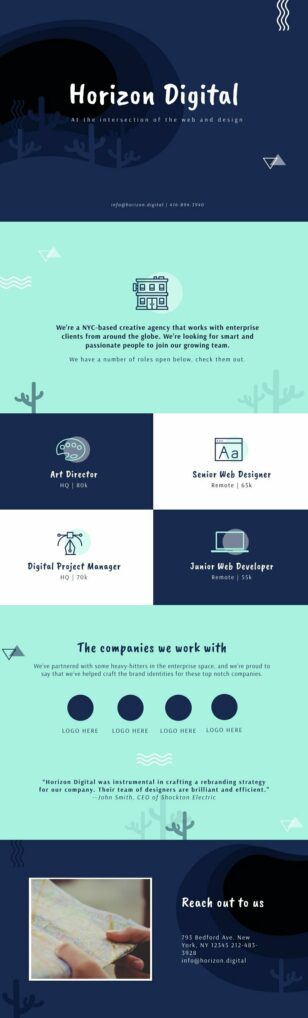
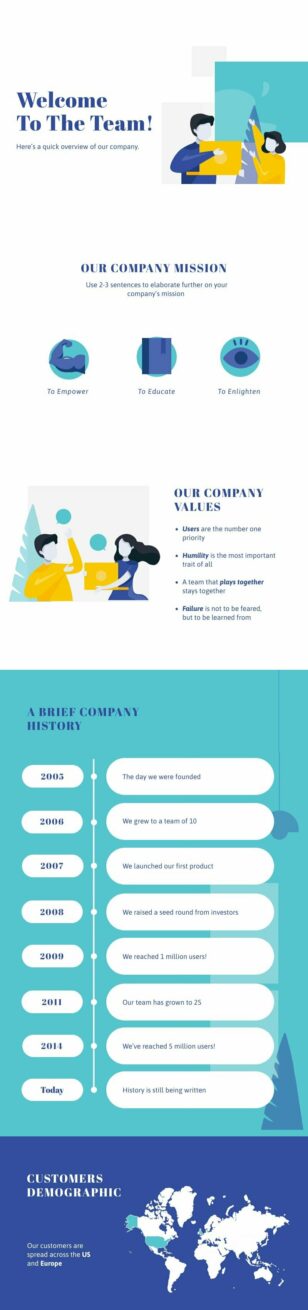
Company Introduction 2
Informational
Company Introduction 2
 Informational
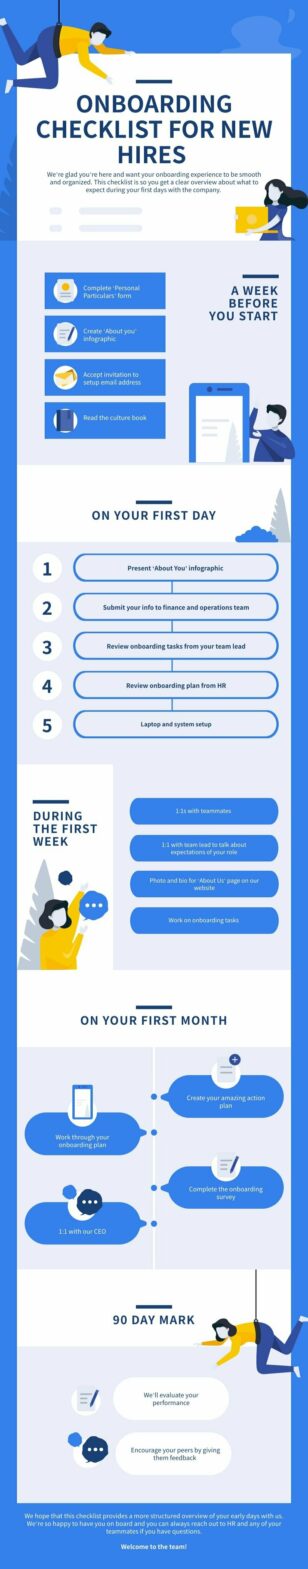
Employee Onboarding Process
Informational
Employee Onboarding Process
 Informational
Annual General Meeting
Informational
Annual General Meeting
 Informational
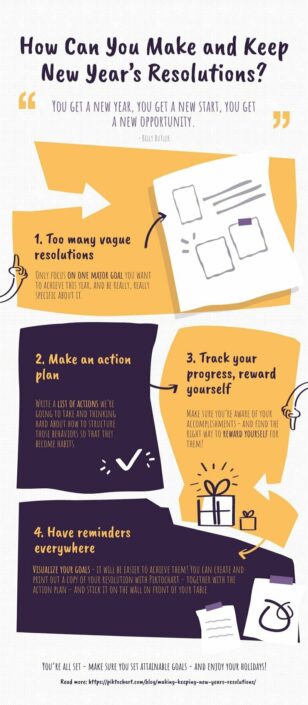
New Year’s Resolutions
Informational
New Year’s Resolutions
 Informational
Minimalist Gifts
Informational
Minimalist Gifts
 Informational
Bubble
Informational
Bubble
 Informational
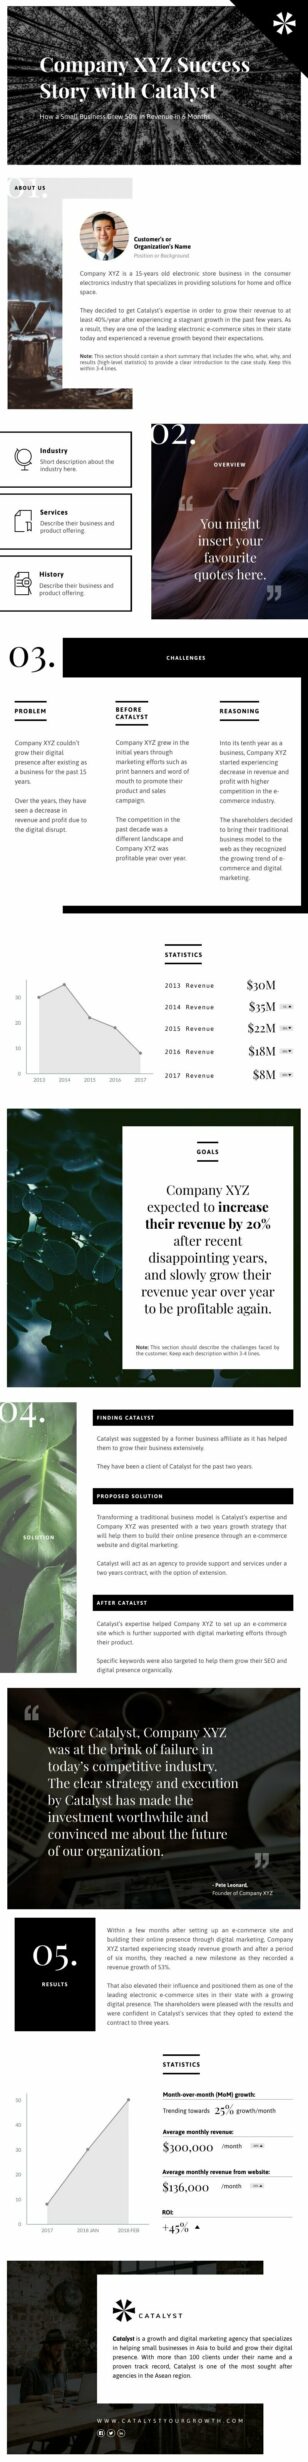
Success Story
Informational
Success Story
 Informational
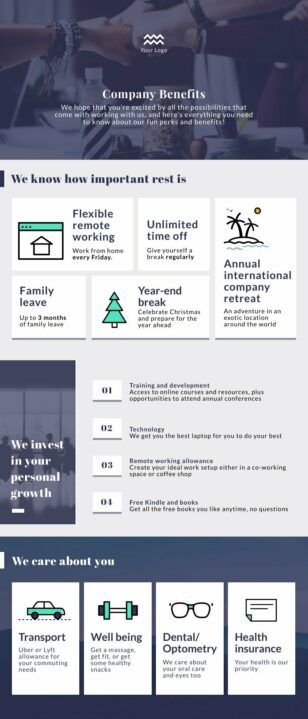
Company Benefits
Informational
Company Benefits
 Informational
Healthy Lifestyle Tips
Informational
Healthy Lifestyle Tips
 Informational
Weekly Newsletter
Informational
Weekly Newsletter
 Informational
Employee Story
Informational
Employee Story
 Informational
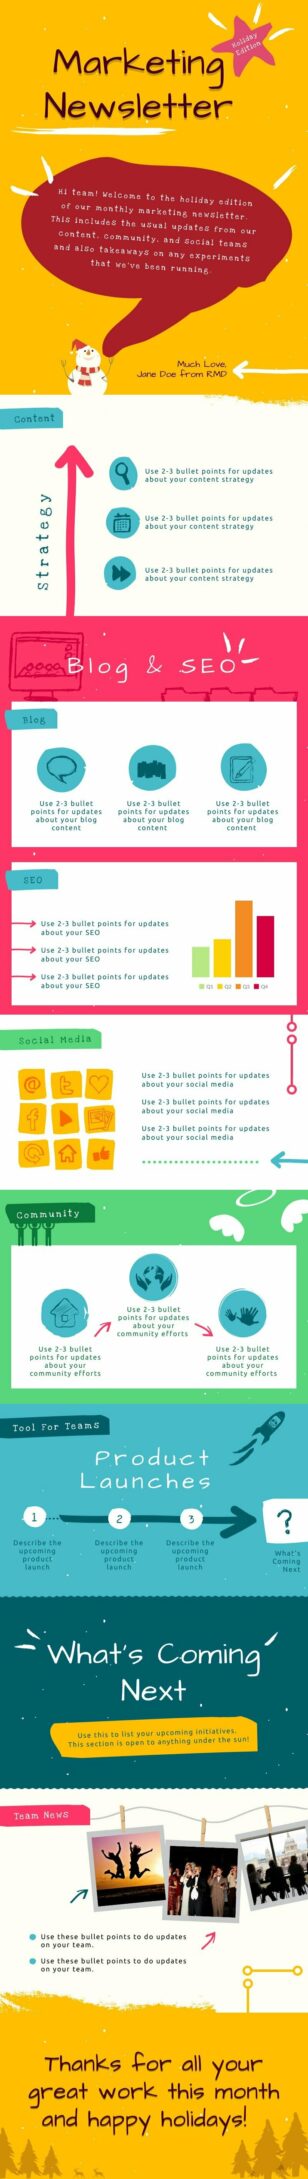
Marketing Newsletter
Informational
Marketing Newsletter
 Informational
All About Me
Informational
All About Me
 Informational
Summit Event
Informational
Summit Event
 Informational
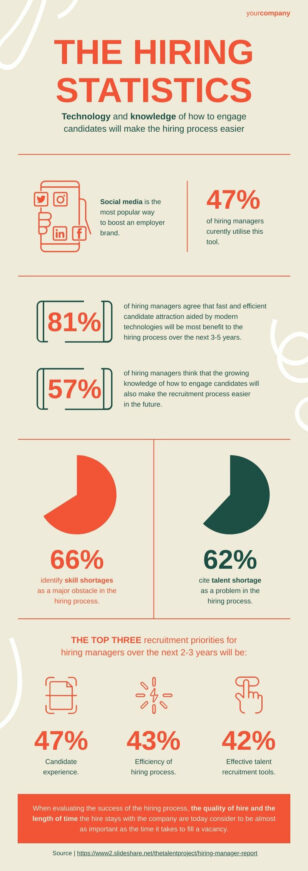
Recruitment Statistics
Informational
Recruitment Statistics
 Informational
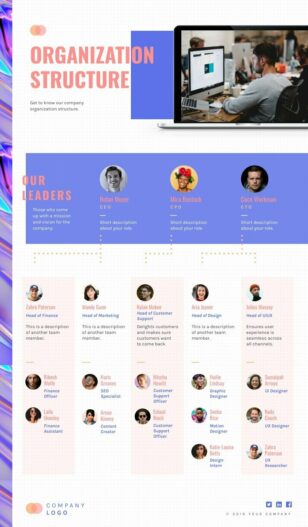
Organizational Chart 2
Informational
Organizational Chart 2
 Informational
How Do Vaccines Work
Informational
How Do Vaccines Work
 Informational
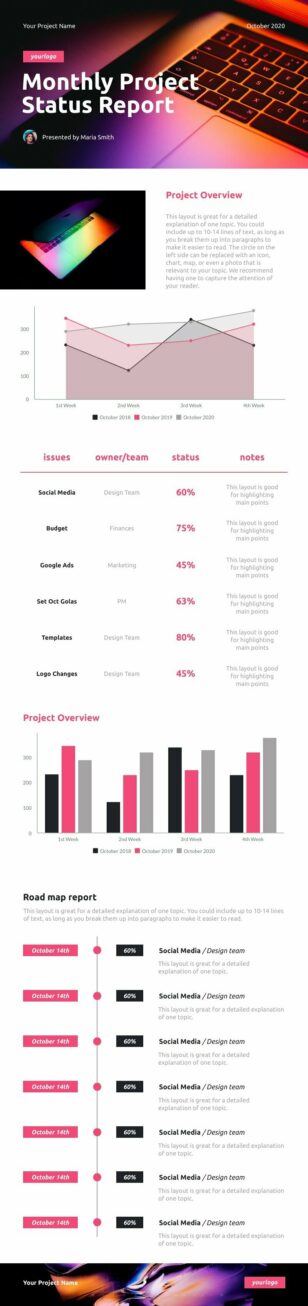
Monthly Project Status Report Template
Informational
Monthly Project Status Report Template
 Informational
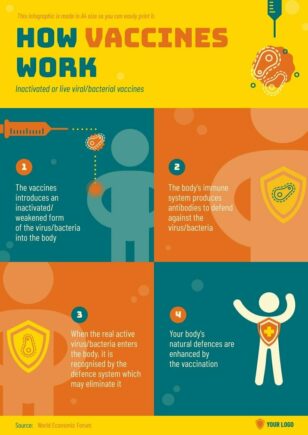
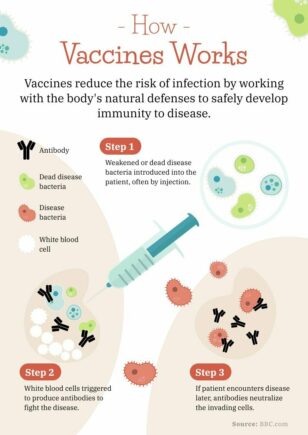
How Vaccines Work
Informational
How Vaccines Work
 Informational
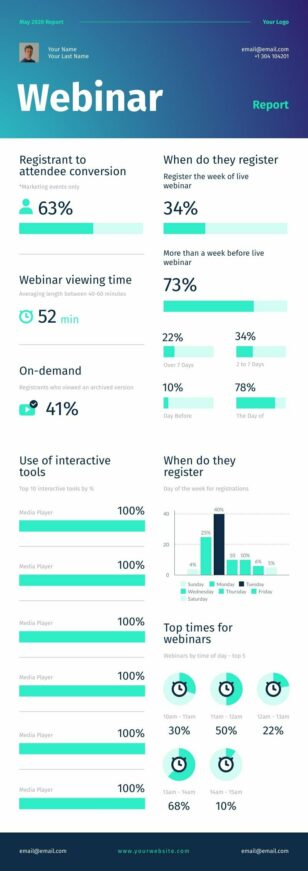
Webinar Report
Informational
Webinar Report
 Informational
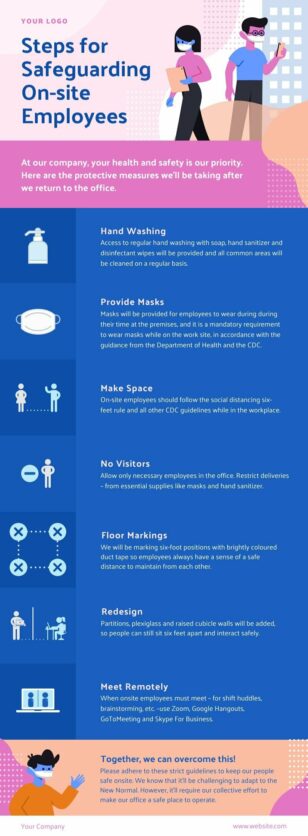
New Normal On-site Safety
Informational
New Normal On-site Safety
 Informational
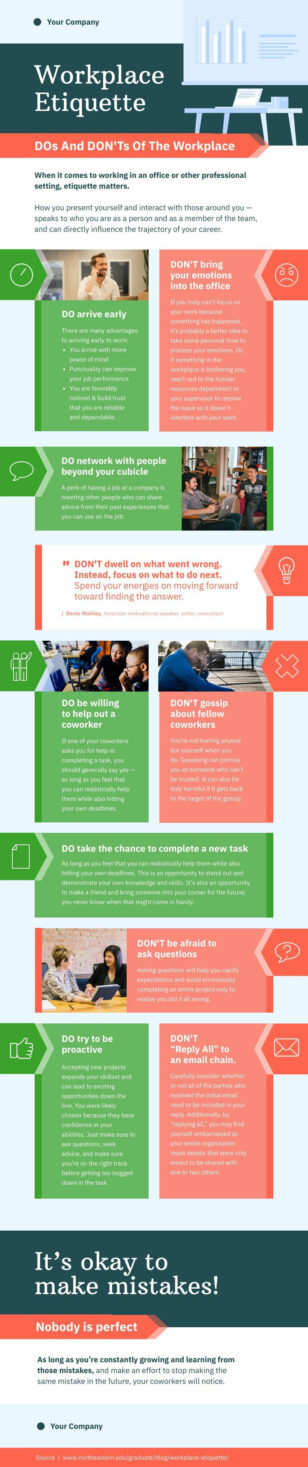
Workplace Etiquette
Informational
Workplace Etiquette
 Informational
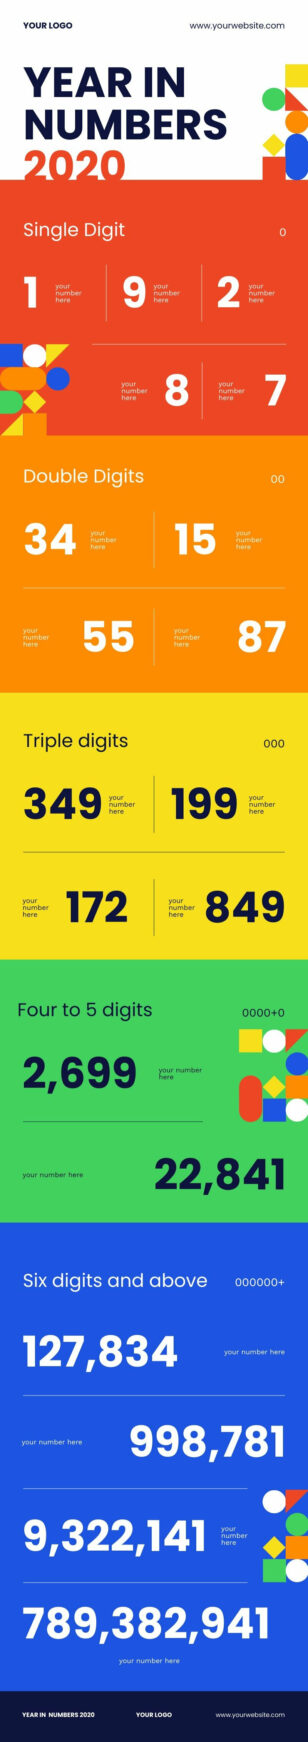
Year in Numbers
Informational
Year in Numbers
 Informational
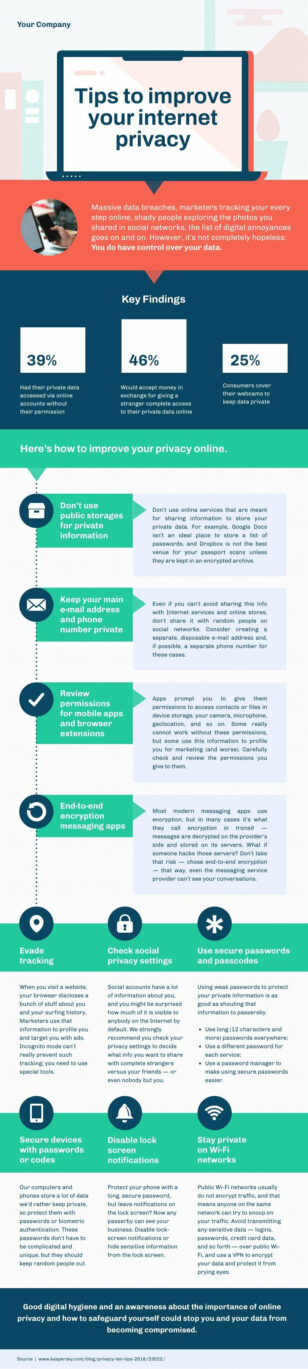
Protect Personal Information
Informational
Protect Personal Information
 Informational
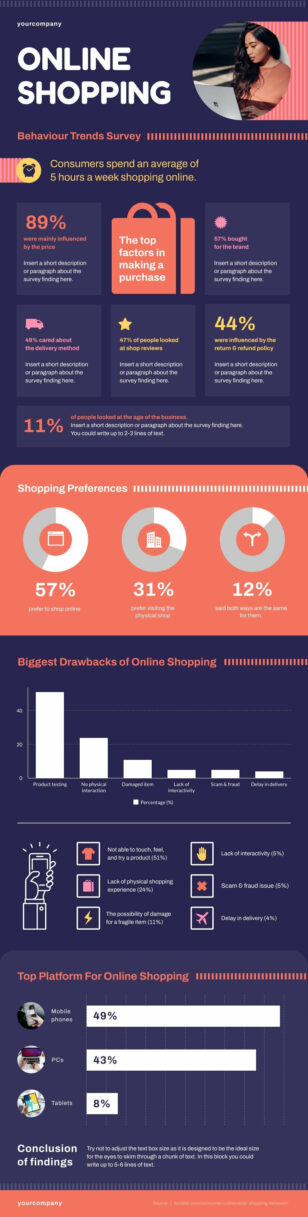
Online Shopping Survey
Informational
Online Shopping Survey
 Informational
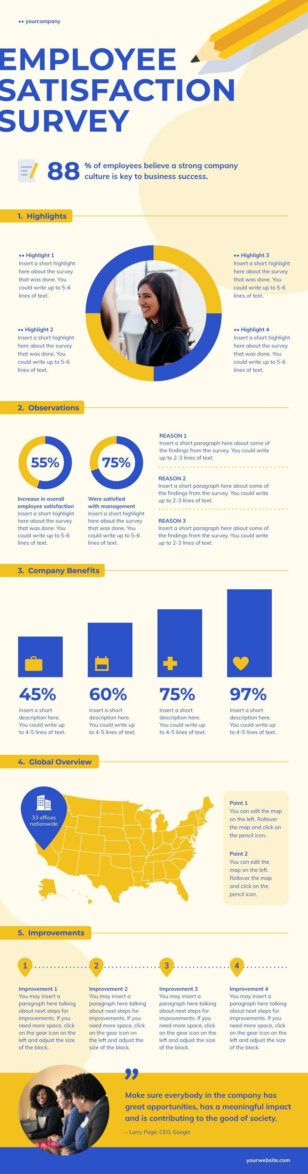
Employee Satisfaction Survey
Informational
Employee Satisfaction Survey
 Informational
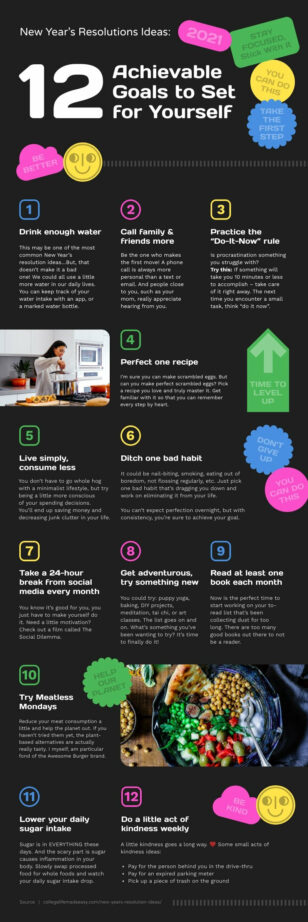
New Year’s Resolution Ideas
Informational
New Year’s Resolution Ideas
 Informational
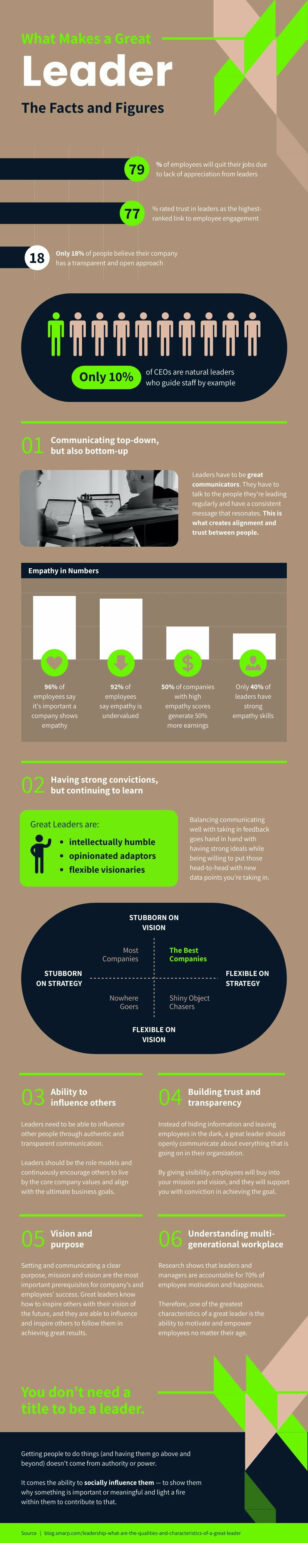
Leadership Statistics
Informational
Leadership Statistics
 Informational
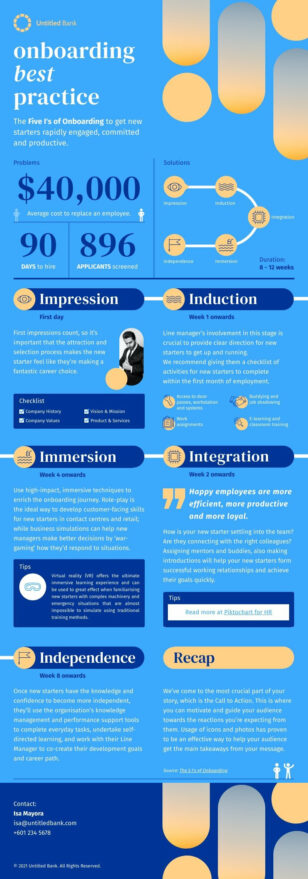
Onboarding Best Practices
Informational
Onboarding Best Practices
 Informational
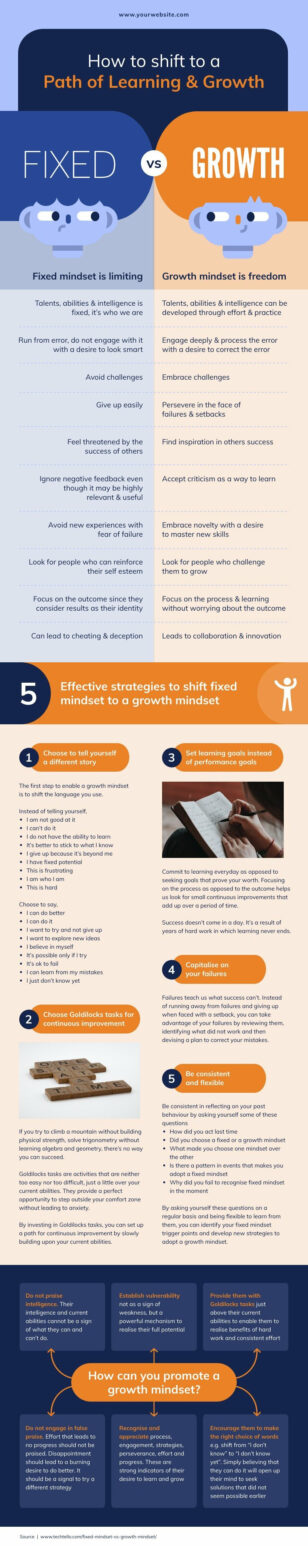
Mindset for Growth
Informational
Mindset for Growth
 Informational
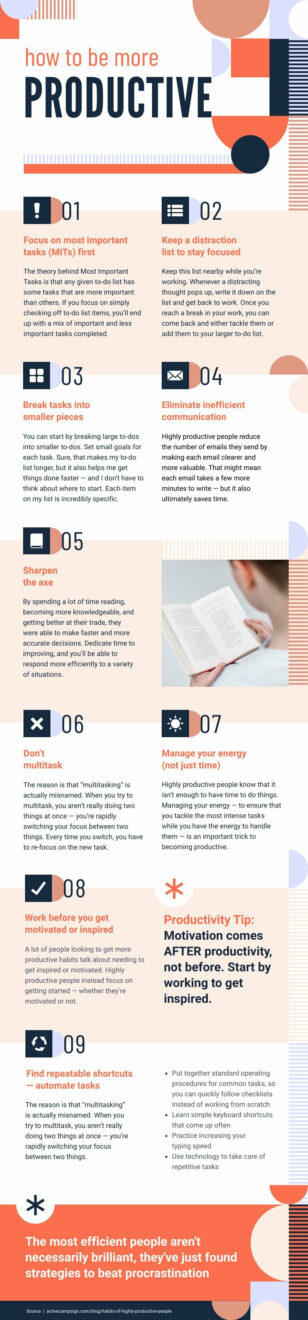
How to Concentrate on Studies
Informational
How to Concentrate on Studies
 Informational
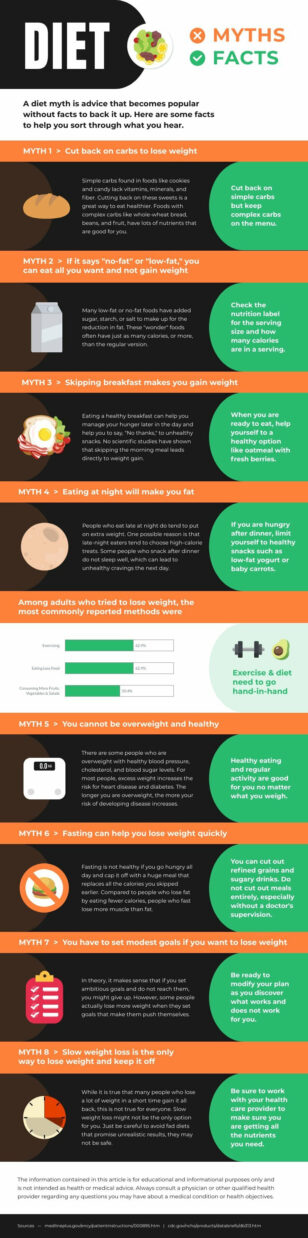
Food Myths
Informational
Food Myths
 Informational
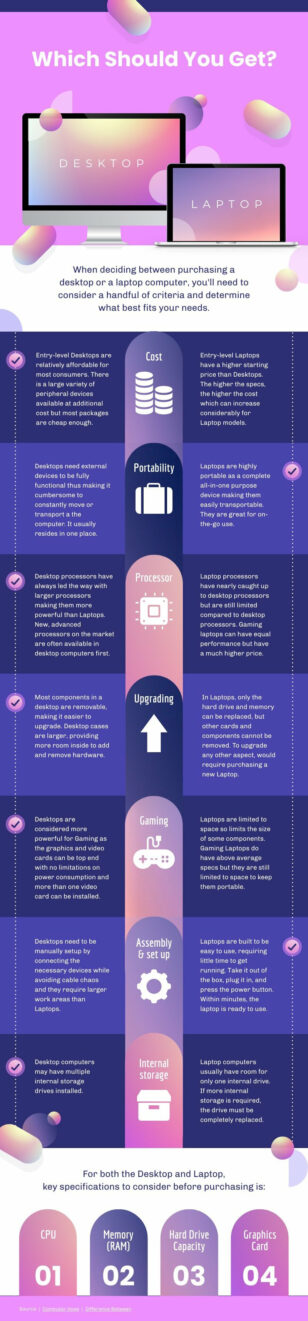
Desktop vs Laptop
Informational
Desktop vs Laptop
 Informational
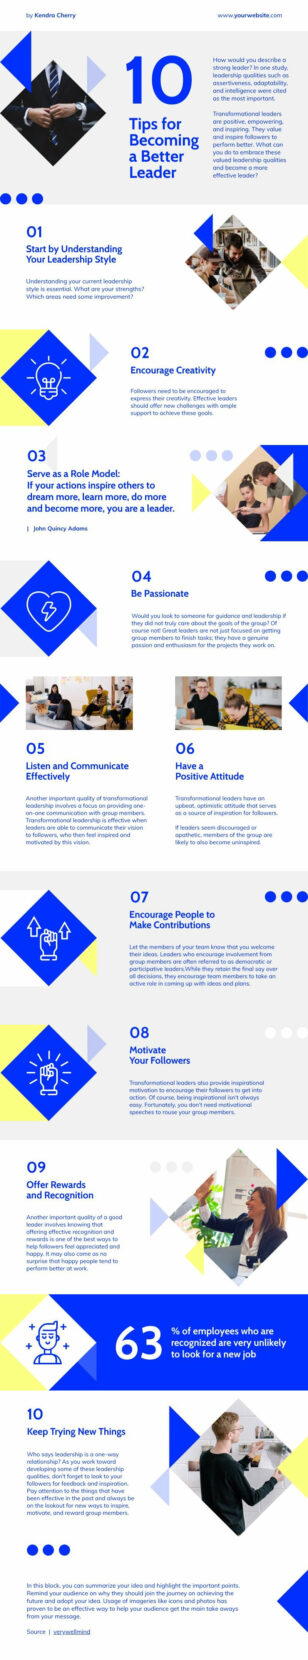
10 Tips For Becoming A Better Manager
Informational
10 Tips For Becoming A Better Manager
 Informational
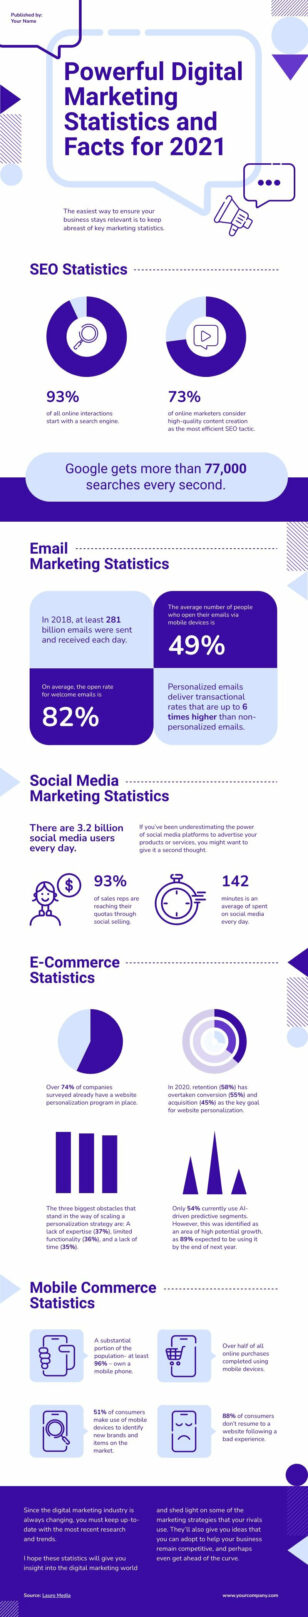
Digital Marketing Facts
Informational
Digital Marketing Facts
 Informational
How to Work From Home Effectively
Informational
How to Work From Home Effectively
 Informational
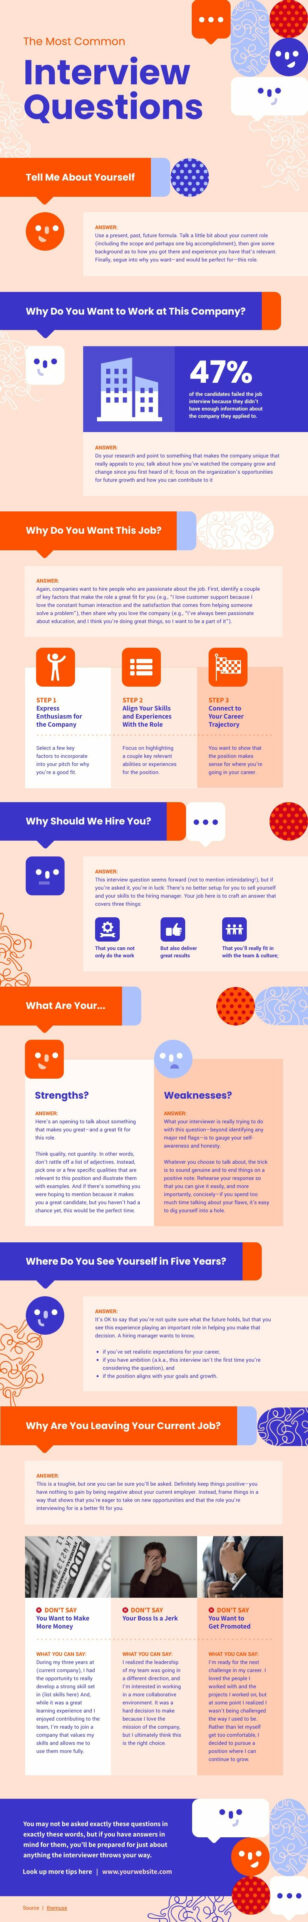
Job Interview Questions and Answers
Informational
Job Interview Questions and Answers
 Informational
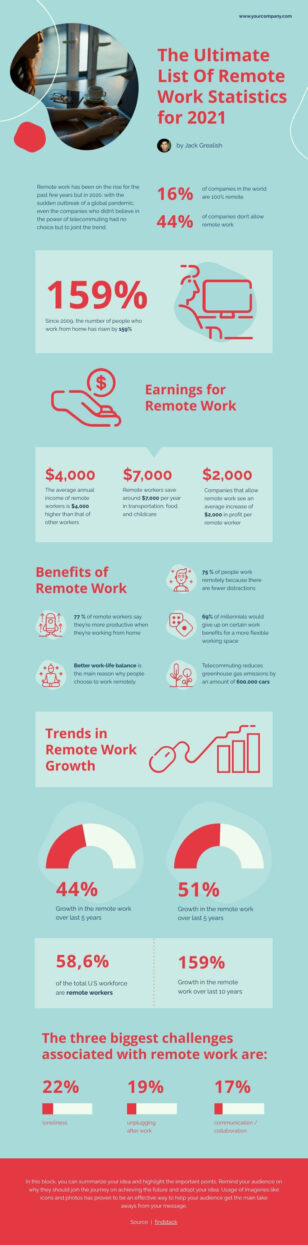
Work From Home Statistics
Informational
Work From Home Statistics
 Informational
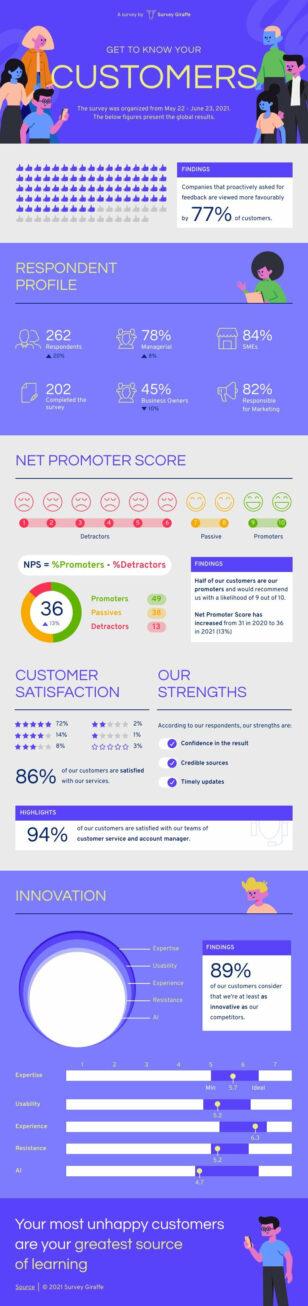
NPS Survey
Informational
NPS Survey
 Informational
Video Stats
Informational
Video Stats
 Informational
Talent Acquisition
Informational
Talent Acquisition
 Informational
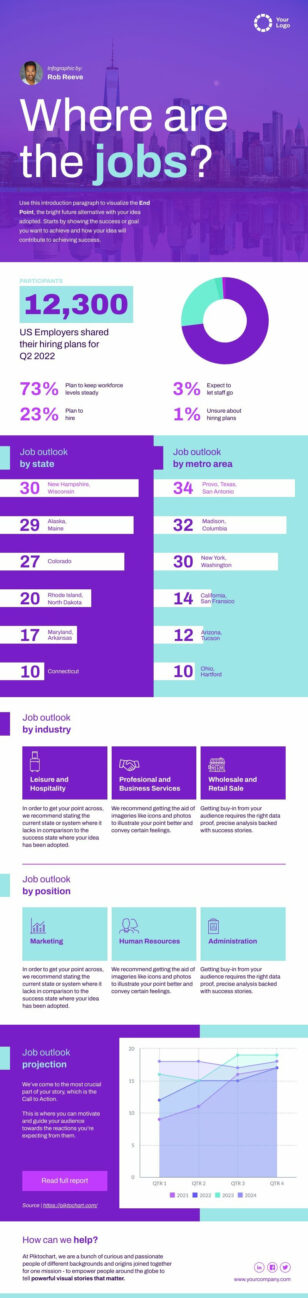
Unemployment Statistics
Informational
Unemployment Statistics
 Informational
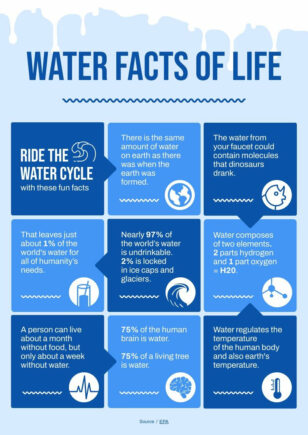
Water Facts of Life
Informational
Water Facts of Life
 Informational
Environmental Degradation
Informational
Environmental Degradation
 Informational
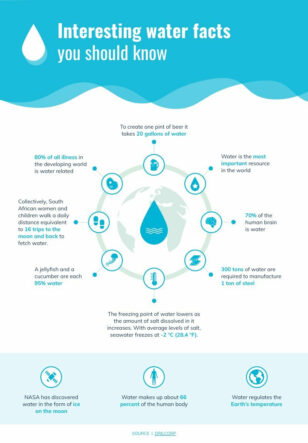
Fun Facts About Water
Informational
Fun Facts About Water
 Informational
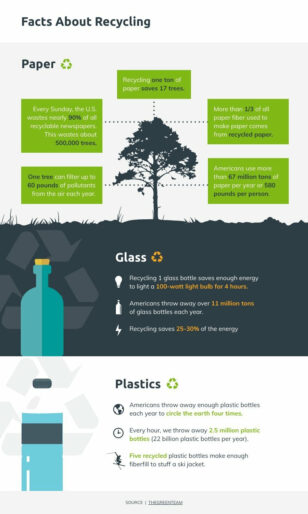
Recycling Facts
Informational
Recycling Facts
 Informational
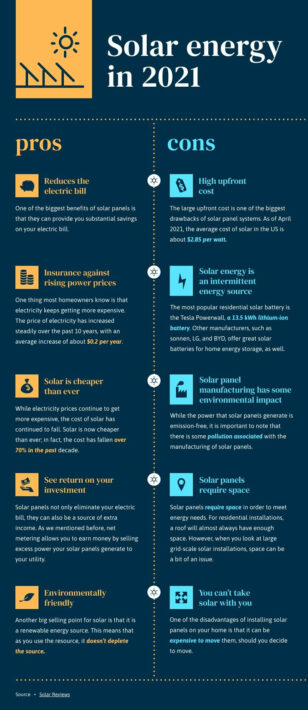
Advantages and Disadvantages of Solar Energy
Informational
Advantages and Disadvantages of Solar Energy
 Informational
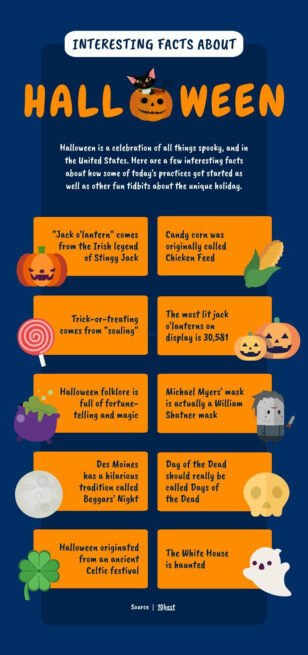
Halloween Facts
Informational
Halloween Facts
 Informational
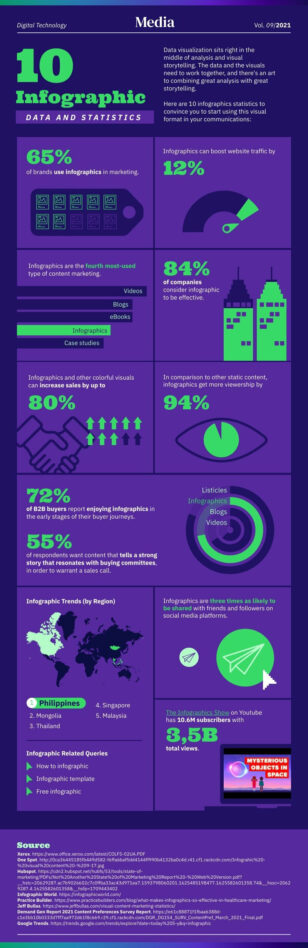
Statistical Infographic
Informational
Statistical Infographic
 Informational
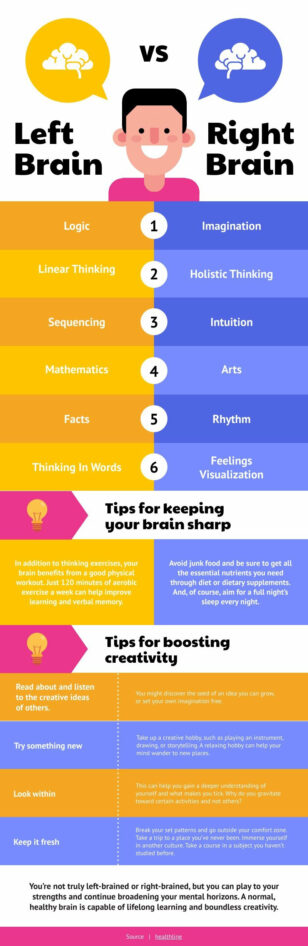
Left Brain vs Right Brain
Informational
Left Brain vs Right Brain
 Informational
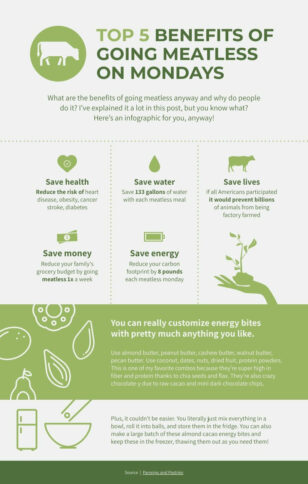
Meatless Mondays
Informational
Meatless Mondays
 Informational
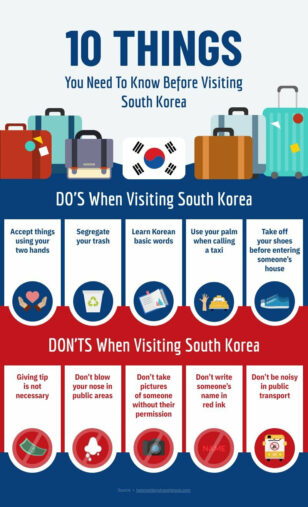
Do’s and Don’ts in South Korea
Informational
Do’s and Don’ts in South Korea
 Informational
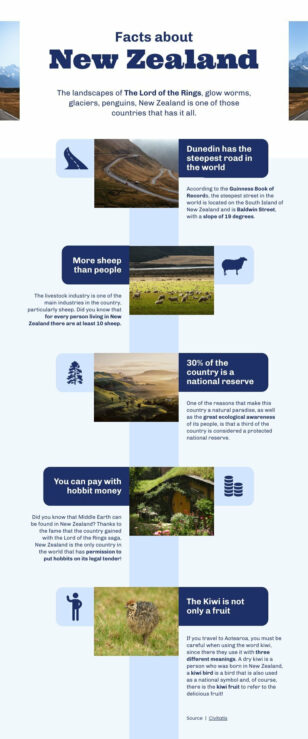
Facts About New Zealand
Informational
Facts About New Zealand
 Informational
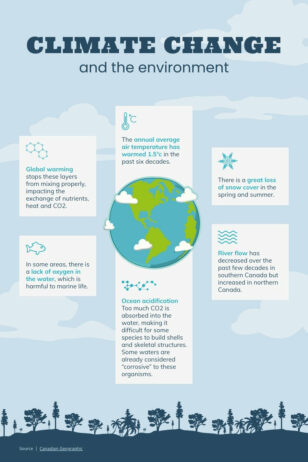
Climate Change and the Environment
Informational
Climate Change and the Environment
 Informational
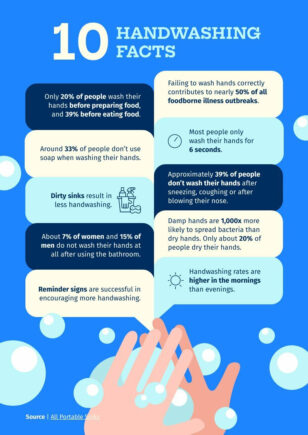
Handwashing Facts
Informational
Handwashing Facts
 Informational
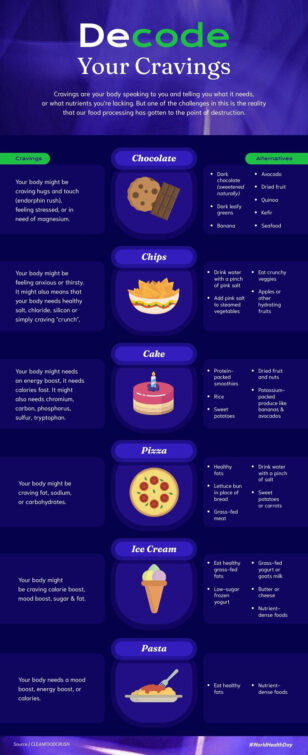
Decode Your Cravings
Informational
Decode Your Cravings
 Informational
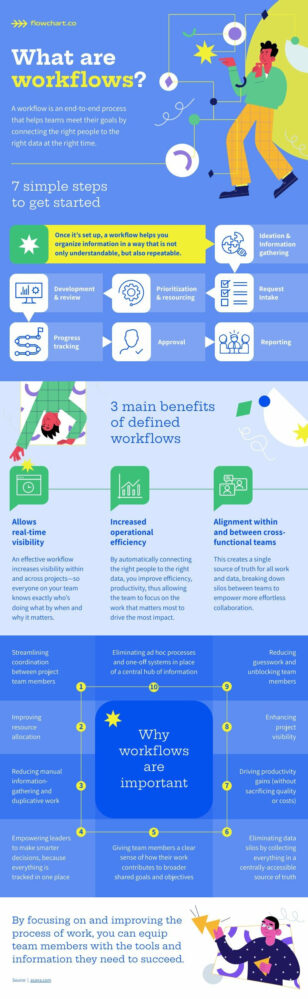
Workflow Benefits
Informational
Workflow Benefits
 Informational
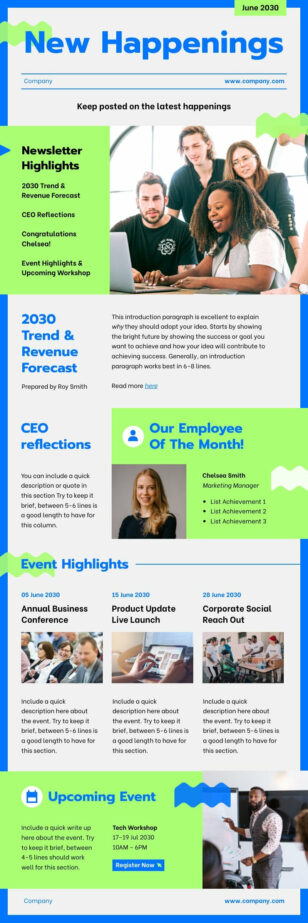
Company Newsletter Highlights
Informational
Company Newsletter Highlights
 Informational
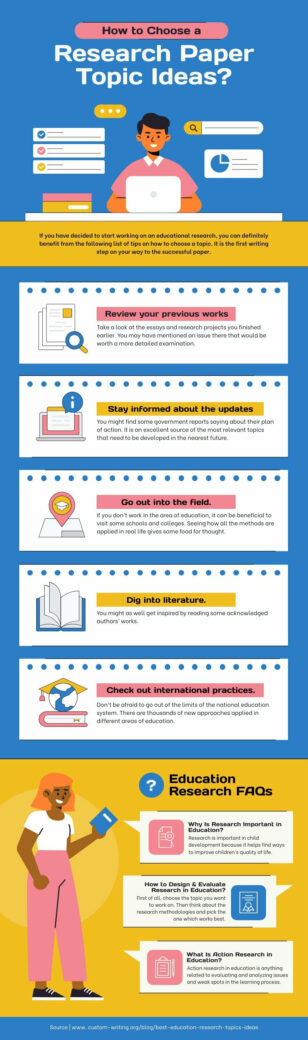
How to Choose a Research Paper Topic Ideas?
Informational
How to Choose a Research Paper Topic Ideas?
 Informational
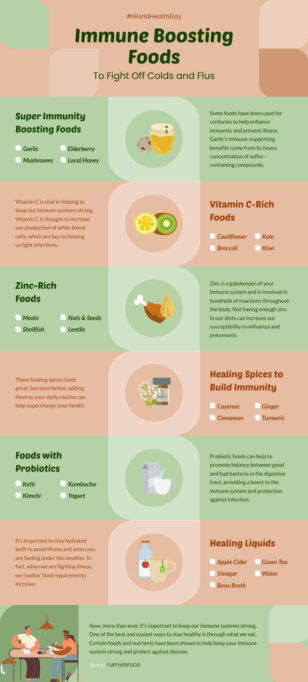
Immune-Boosting Foods
Informational
Immune-Boosting Foods
 Informational
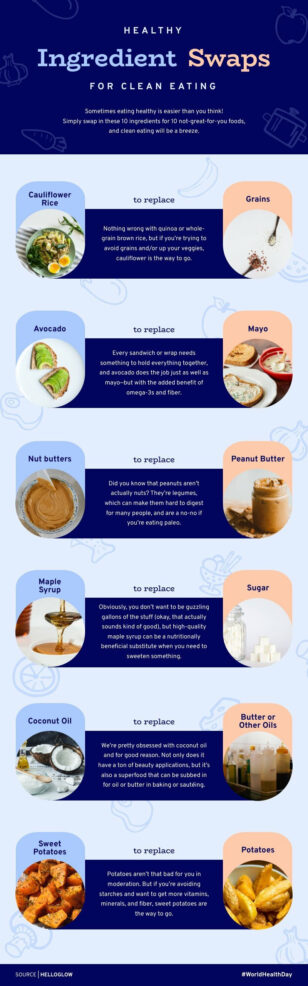
Healthy Ingredient Swaps
Informational
Healthy Ingredient Swaps
 Informational
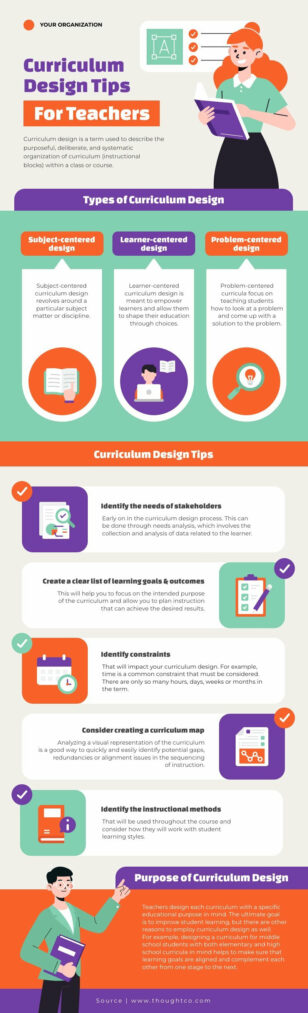
Curriculum Design Tips for Teachers
Informational
Curriculum Design Tips for Teachers
 Informational
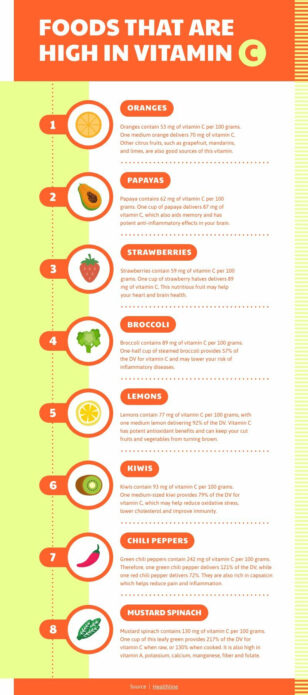
Foods That Are High in Vitamin C
Informational
Foods That Are High in Vitamin C
 Informational
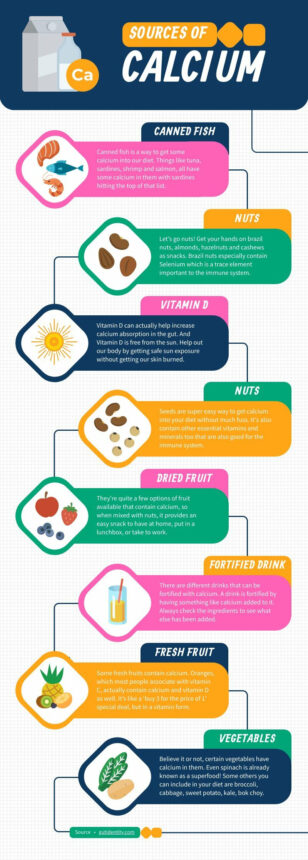
Sources of Calcium
Informational
Sources of Calcium
 Informational
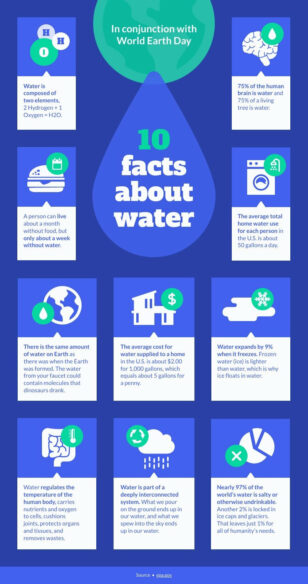
10 Facts About Water
Informational
10 Facts About Water
 Informational
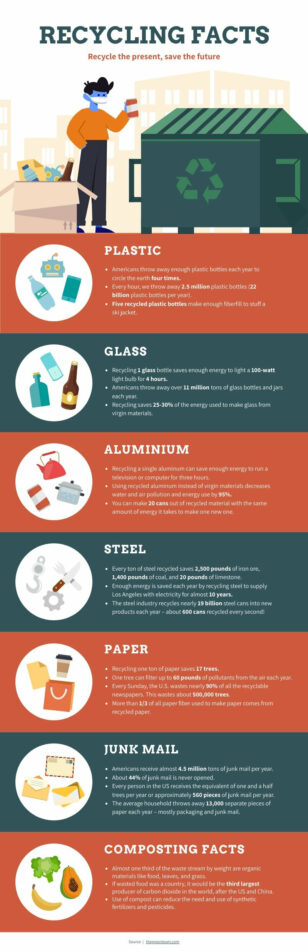
Interesting Recycling Facts
Informational
Interesting Recycling Facts
 Informational
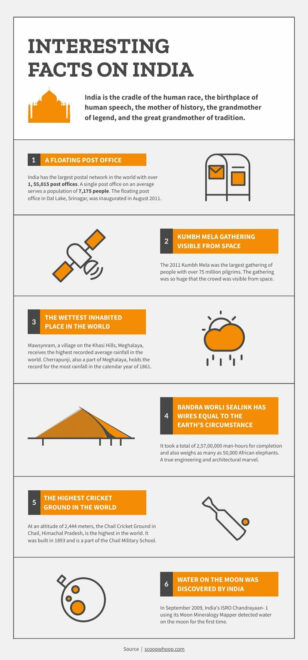
Interesting Facts on India
Informational
Interesting Facts on India
 Informational
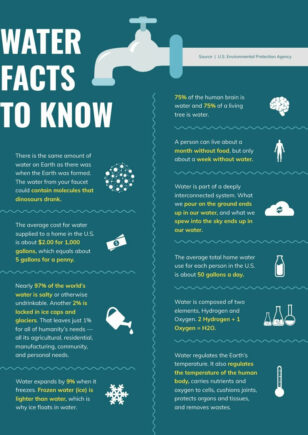
Water Facts to Know
Informational
Water Facts to Know
 Informational
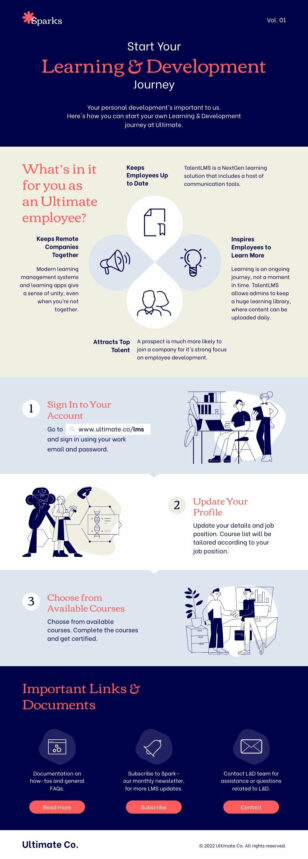
Learning & Development Newsletter
Informational
Learning & Development Newsletter
 Informational
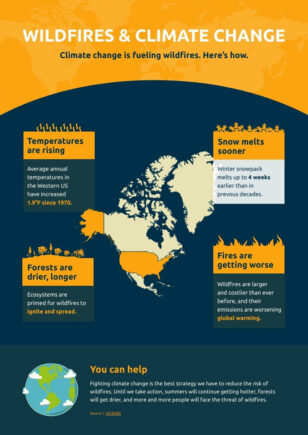
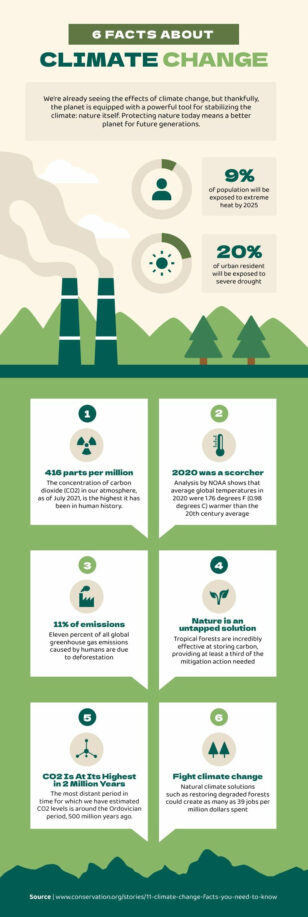
6 Facts About Climate Change
Informational
6 Facts About Climate Change
 Informational
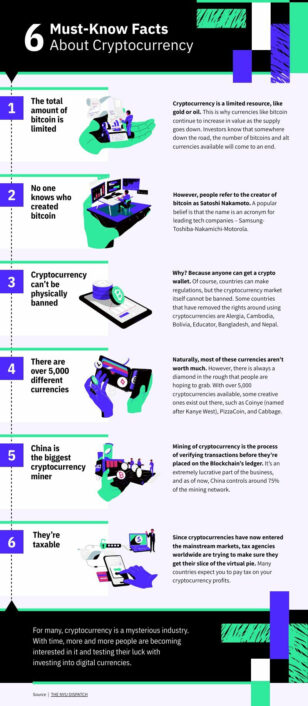
6 Must-Know Facts About Cryptocurrency
Informational
6 Must-Know Facts About Cryptocurrency
 Informational
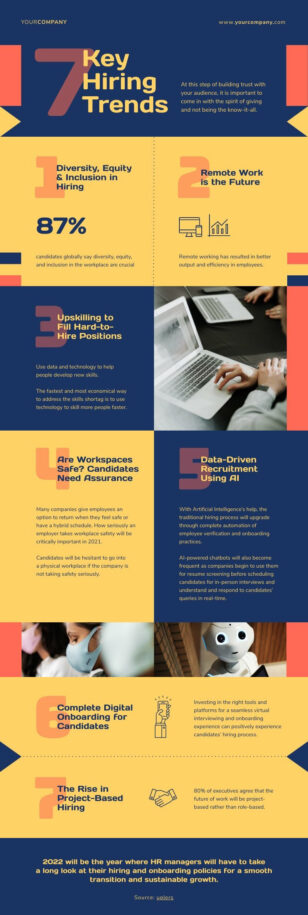
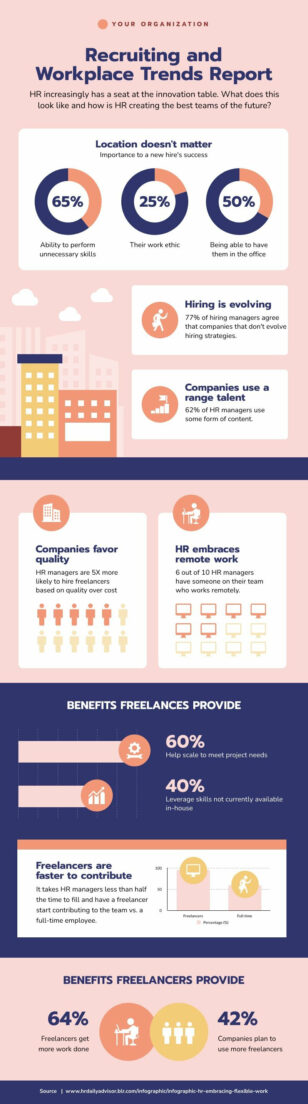
Recruiting and Workplace Trends Report
Informational
Recruiting and Workplace Trends Report
 Informational
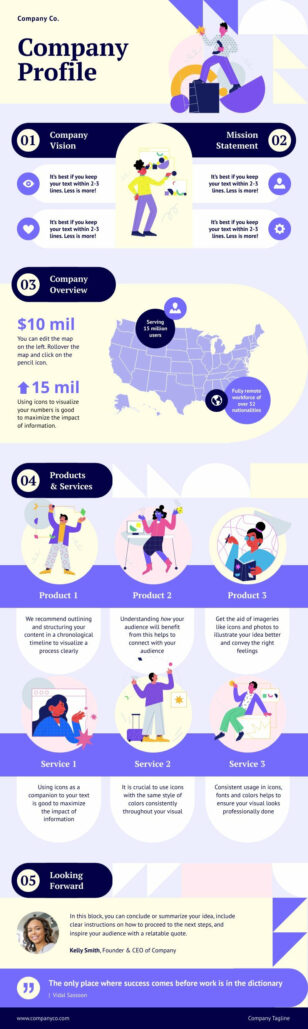
Creative Company Profile
Informational
Creative Company Profile
 Informational
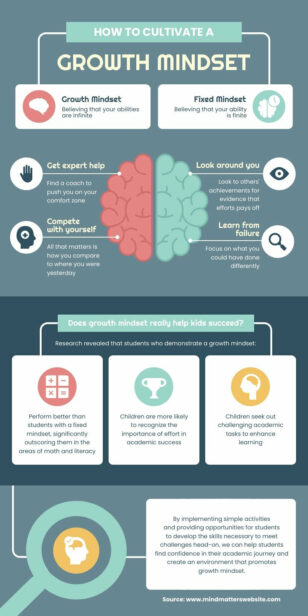
How to Cultivate a Growth Mindset
Informational
How to Cultivate a Growth Mindset
 Informational
B2B Graphic Design Statistics and Insights
Informational
B2B Graphic Design Statistics and Insights
 Informational
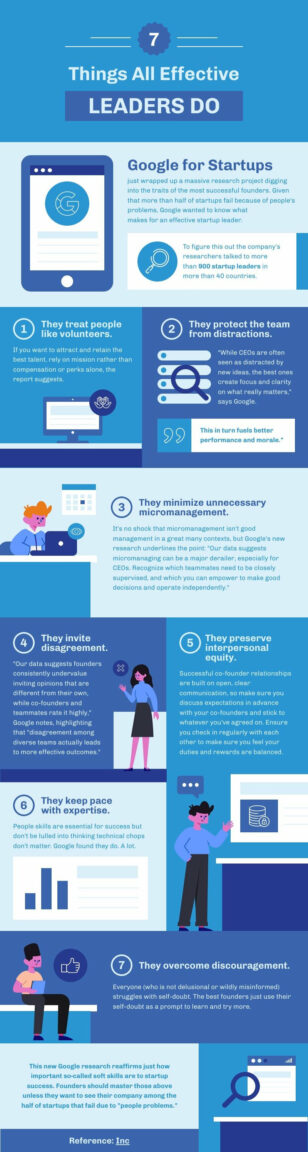
7 Things All Effective Leaders Do
Informational
7 Things All Effective Leaders Do
 Informational
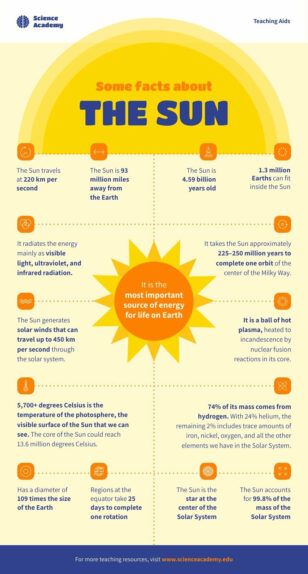
Facts About The Sun
Informational
Facts About The Sun
 Informational
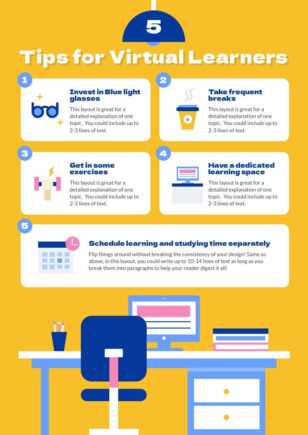
5 Tips for Virtual Learners
Informational
5 Tips for Virtual Learners
 Informational
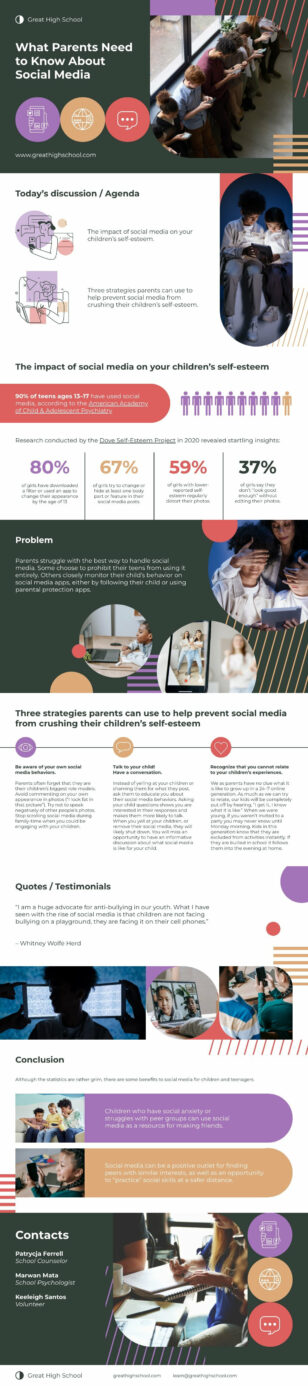
What Parents Need to Know About Social Media Widescreen
Informational
What Parents Need to Know About Social Media Widescreen
 Informational
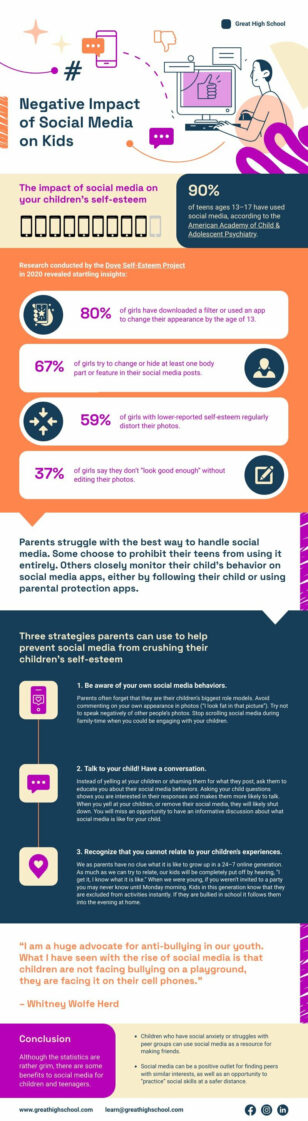
Negative Impact of Social Media on Kids
Informational
Negative Impact of Social Media on Kids
 Informational
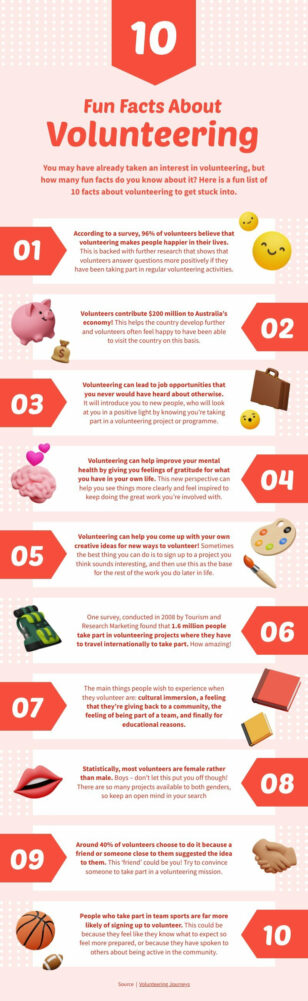
10 Fun Facts About Volunteering
Informational
10 Fun Facts About Volunteering
 Informational
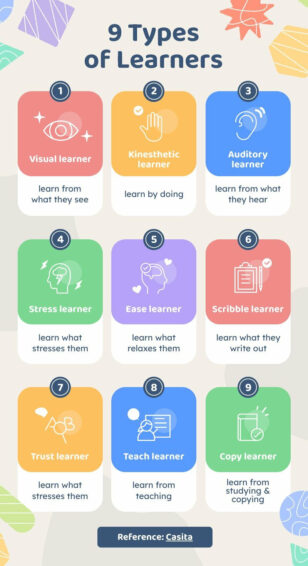
9 Types of Learners
Informational
9 Types of Learners
 Informational
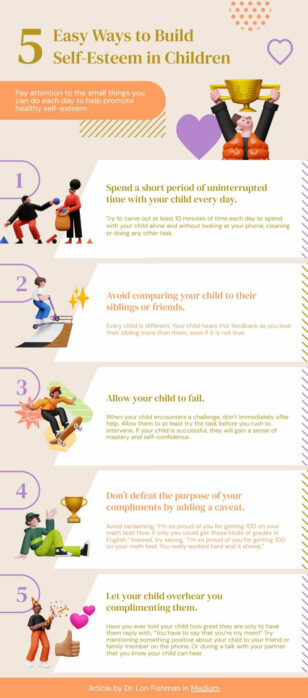
5 Easy Ways to Build Self-Esteem in Children
Informational
5 Easy Ways to Build Self-Esteem in Children
 Informational
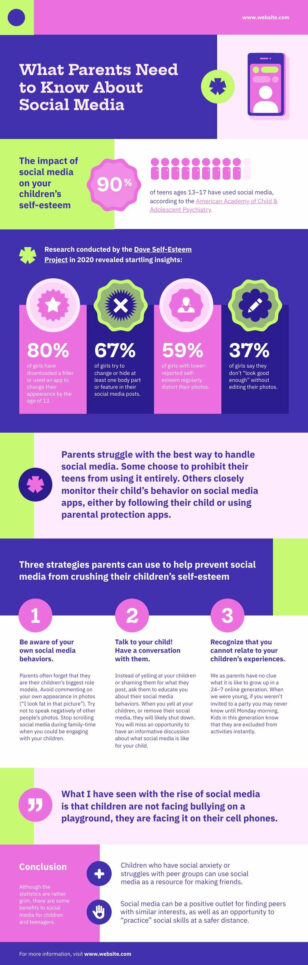
The Impact Of Social Media On Children’s Self-Esteem
Informational
The Impact Of Social Media On Children’s Self-Esteem
 Informational
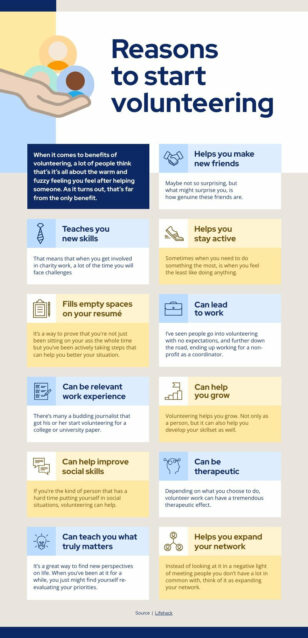
Reasons To Start Volunteering
Informational
Reasons To Start Volunteering
 Informational
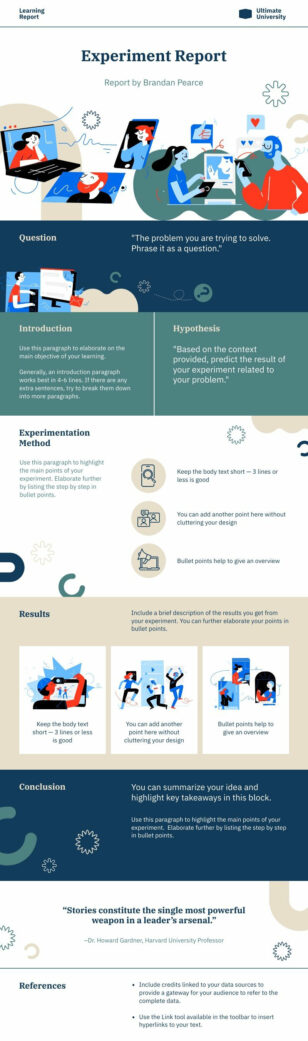
Experiment Report
Informational
Experiment Report
 Informational
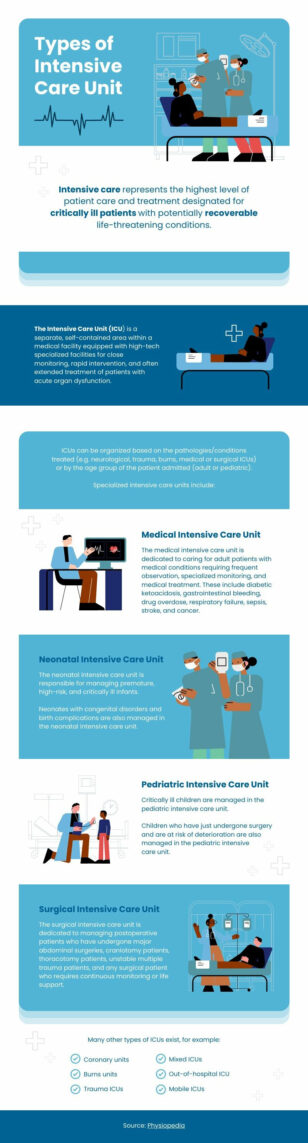
Types of ICU
Informational
Types of ICU
 Informational
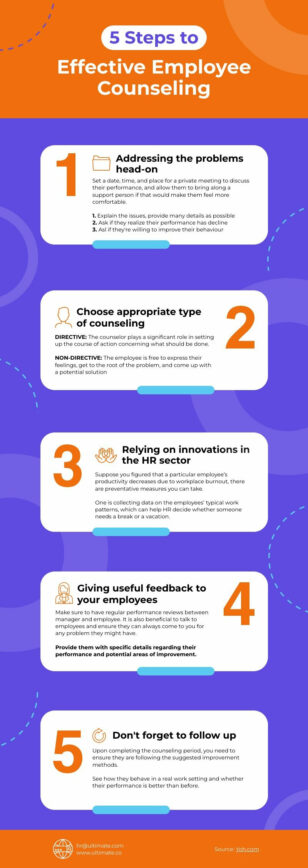
Employee Counseling
Informational
Employee Counseling
 Informational
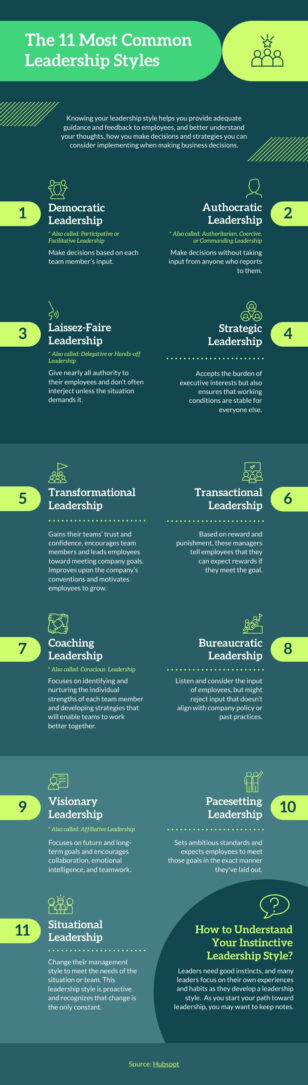
Simple Types of Leadership
Informational
Simple Types of Leadership
 Informational
Minimalist Leadership Styles
Informational
Minimalist Leadership Styles
 Informational
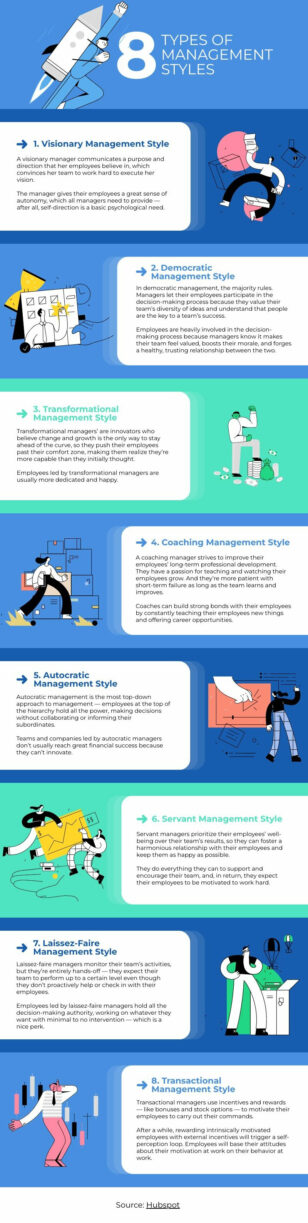
Modern Management Styles
Informational
Modern Management Styles
 Informational
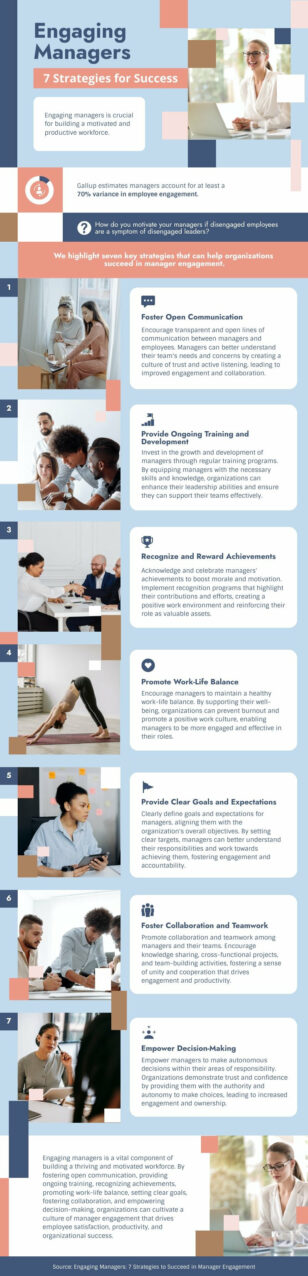
Engaging Managers
Informational
Engaging Managers
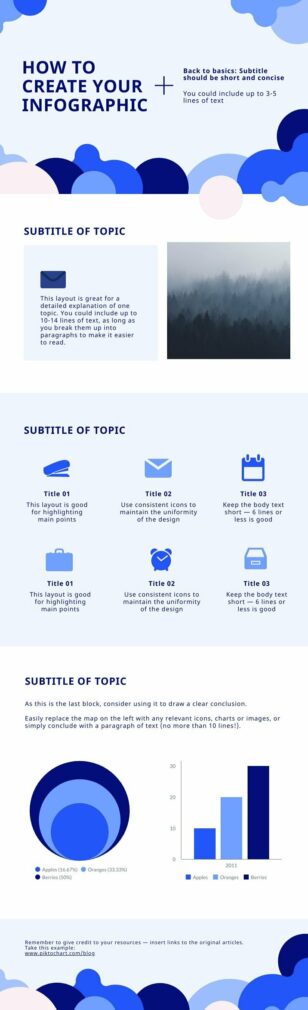
Informational infographic templates for explainers and guides
Informational infographics serve as powerful tools for communicating complex ideas, statistics, and processes in a visually appealing format. By combining text, images, and data visualizations, these graphics help you convey information more effectively than traditional text-based content alone.
With Piktochart’s extensive library of informational infographic templates, you can easily create compelling visuals for various purposes. From business reports and educational materials to social media posts and presentations, our templates cover a wide range of topics and industries. Each template is fully customizable, allowing you to adapt the design to your specific needs and brand identity.
Our user-friendly editor makes it simple to modify colors, fonts, icons, and layouts without any graphic design experience. You can quickly input your data, adjust elements, and add your own images to create professional-looking infographics in minutes, saving you time and resources while still producing high-quality visual content that engages your audience and helps them retain information more effectively.
Start exploring our diverse collection of informational infographic templates today and elevate your communication strategy. Whether you’re a marketer, educator, or business professional, Piktochart provides the tools you need to transform your data and ideas into visually stunning and informative graphics.
Want an informational infographic in seconds? Try our AI design generator — describe your topic and the tool produces a visual you can refine in our editor.
Informational Infographics FAQs
What’s the best structure for an informational infographic?
Lead with a single clear headline, then break the content into 4–6 numbered or icon-led sections so readers can scan top to bottom — every Piktochart informational template follows this flow.
How long should an informational infographic be?
Aim for one screen-height of content (around 800–1500 px tall) so the whole story is visible without scrolling — Piktochart’s templates are sized for this.
Can I turn a blog post or article into an infographic?
Yes — pull out the 5–7 most important data points or steps from your article and drop them into a Piktochart template; no need to start from scratch.
How do I make sure my infographic is readable on mobile?
Use Piktochart’s mobile preview to check legibility, and stick to short text blocks and large icons — informational infographics scale much better than text-heavy ones.
Can I export an informational infographic for use in presentations?
Yes — export to PNG to embed in slides, PDF for handouts, or PPTX to drop the whole infographic directly into PowerPoint.