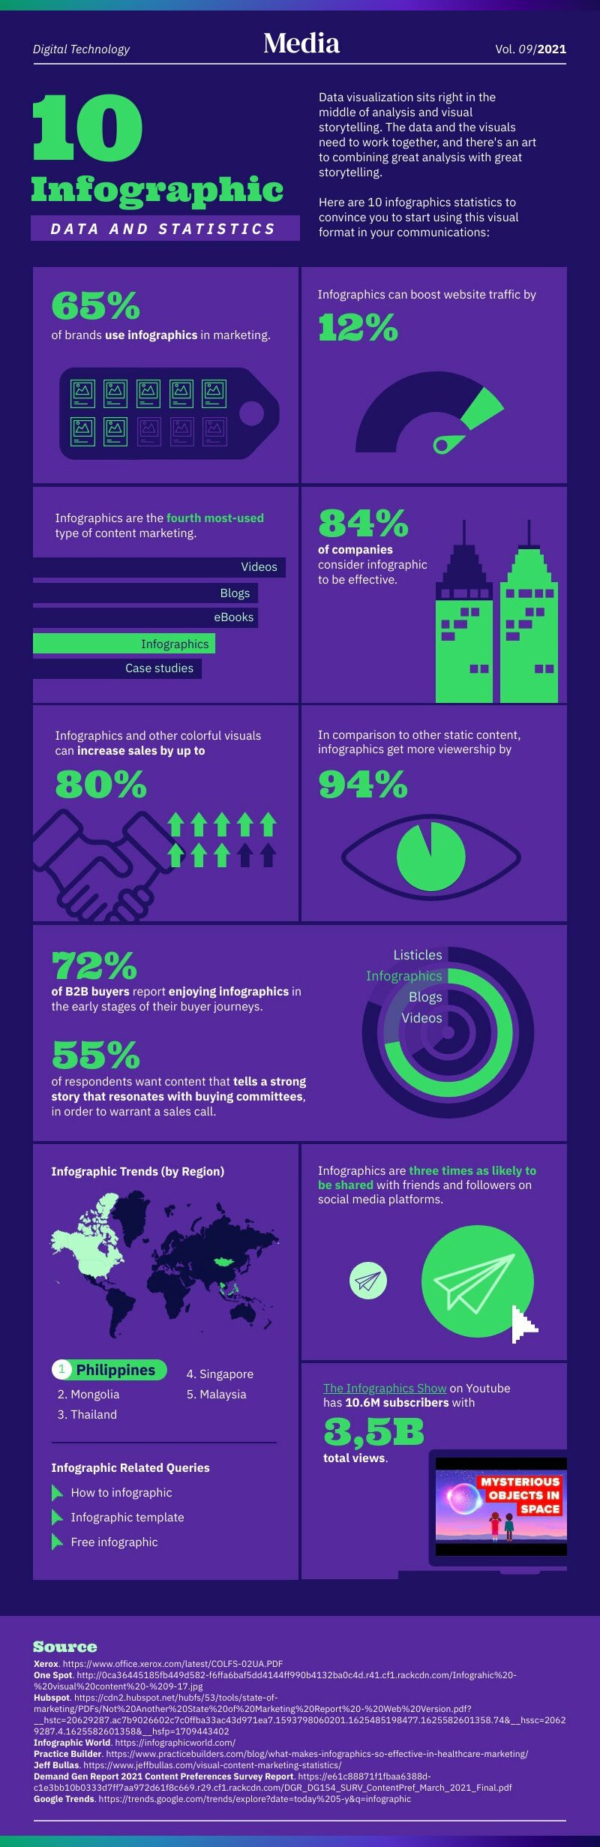
Statistical Infographic
Infographics
Edit for freeYou'll be asked to log in or sign up for a free Piktochart account first.
This infographic template is great for visualizing statistics and facts. With ten different blocks to highlight data and statistics, you have plenty of options to utilize them all or add on more blocks. The color contrast in this infographic template provides a modern appeal to the visual that would draw your audience's attention. This infographic template has been designed for the data and visuals to work together, combining great analysis and storytelling. Easily replace the text and add icons, images, and illustrations to make it your own. Personalize with brand assets and unlock more features with Pro. Get started now.
Available File Type
Customization
100% customizable
Tags
Template Details
Data Visualization Made Easy With Statistical Infographic Templates
Statistical infographics bridge the gap between raw data and compelling storytelling. They capture attention, simplify complex information, and make your insights memorable. But creating these visuals can be challenging, especially if you’re not a design expert.
Our platform solves this problem by offering an intuitive solution for crafting professional statistical infographics. With a wide range of customizable templates, you can transform your data into visually striking presentations without spending hours learning complex design software. Simply input your statistics, adjust colors and fonts to match your brand, and watch your data come to life.
Whether you’re a marketer showcasing campaign results, a researcher presenting findings, or a student explaining complex concepts, our tool empowers you to create impactful statistical infographics quickly and easily. Say goodbye to bland spreadsheets and hello to visuals that make your audience sit up and take notice. After all, why settle for number crunching when you can be a data Picasso?
More Templates Like This
 Infographics
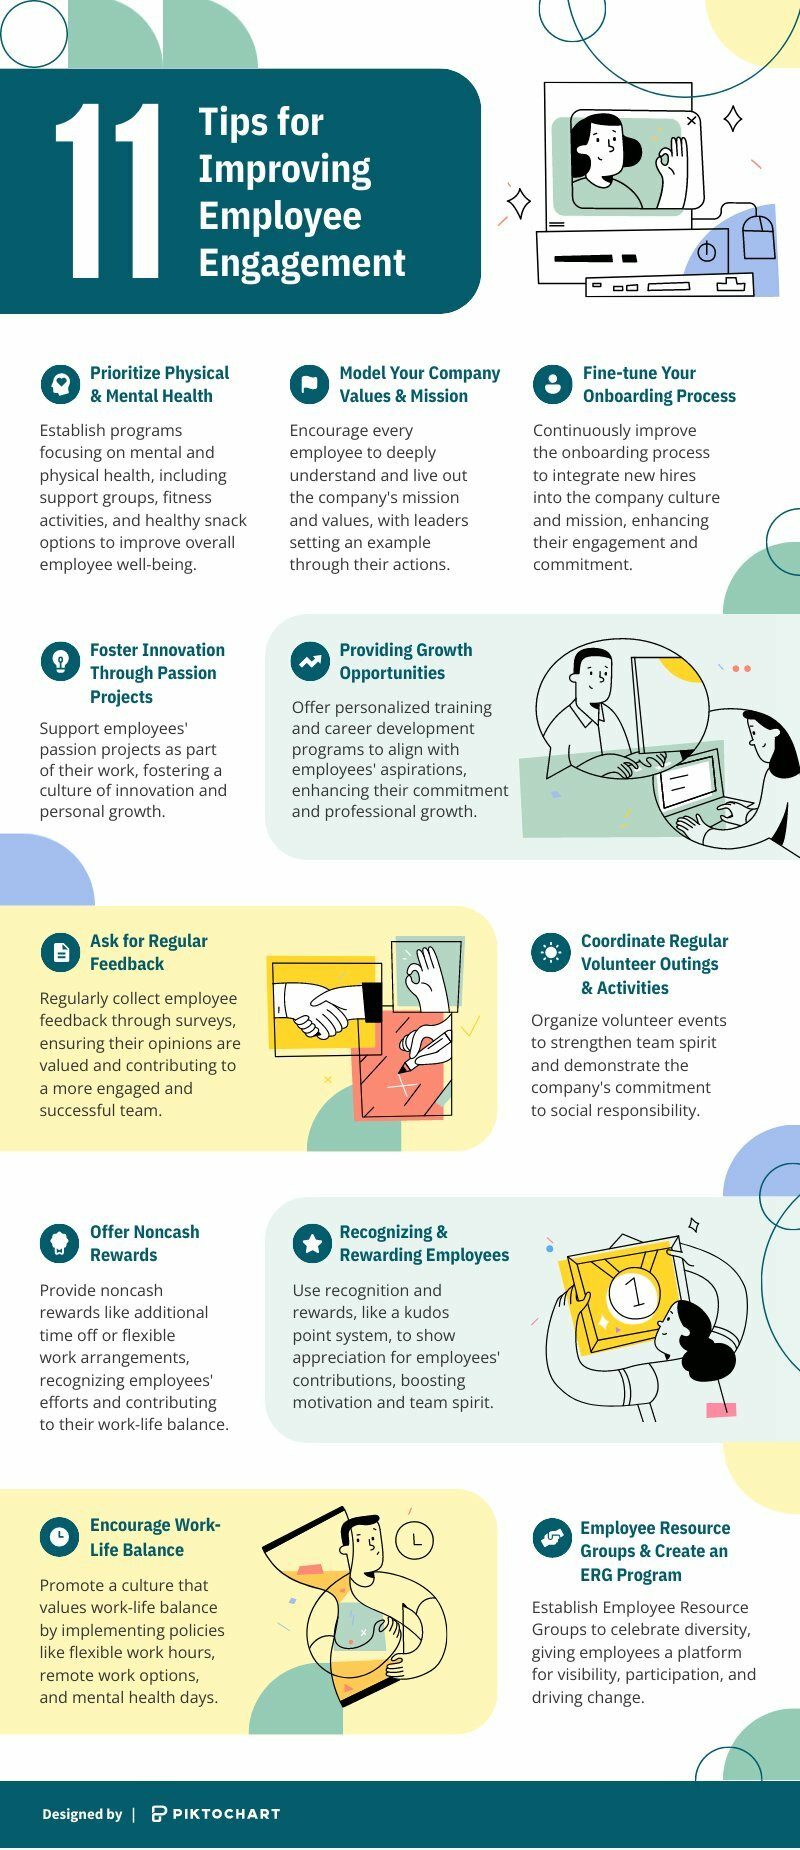
Tips for Improving Employee Engagement
Infographics
Tips for Improving Employee Engagement
 Infographics
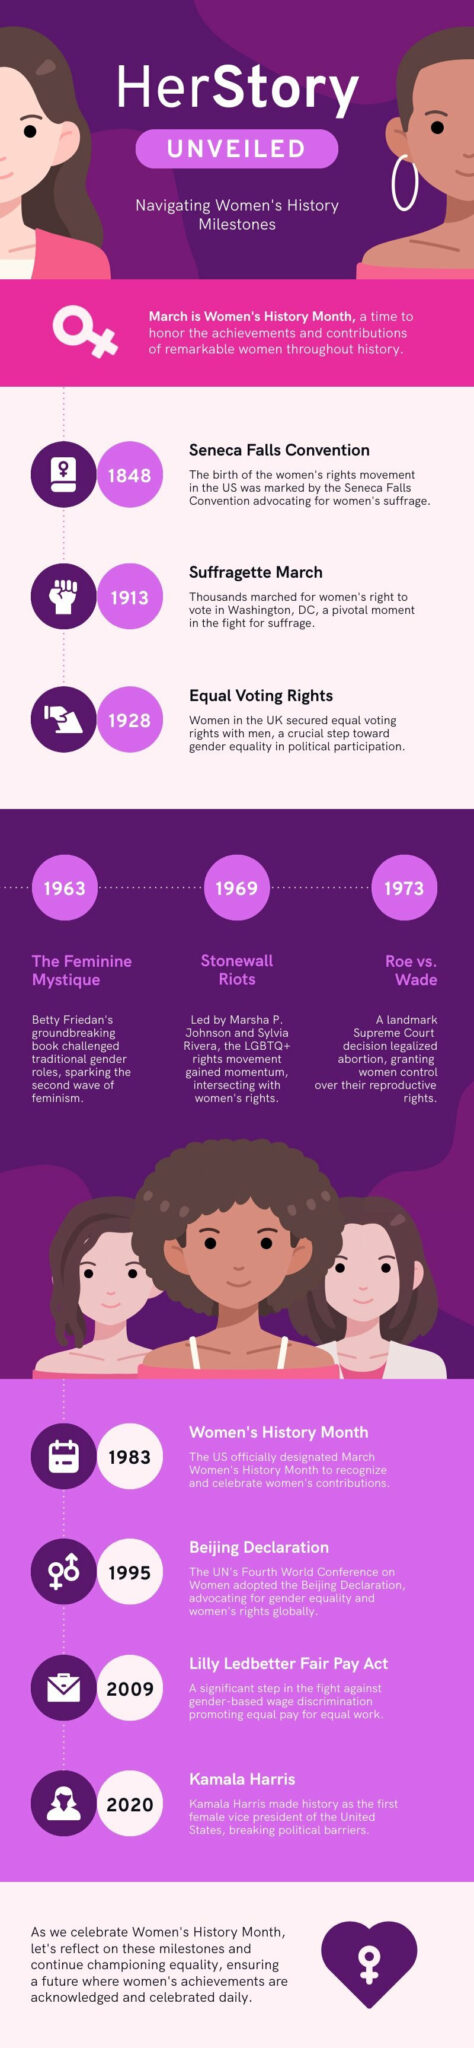
International Women’s Day Infographic
Infographics
International Women’s Day Infographic
 Infographics
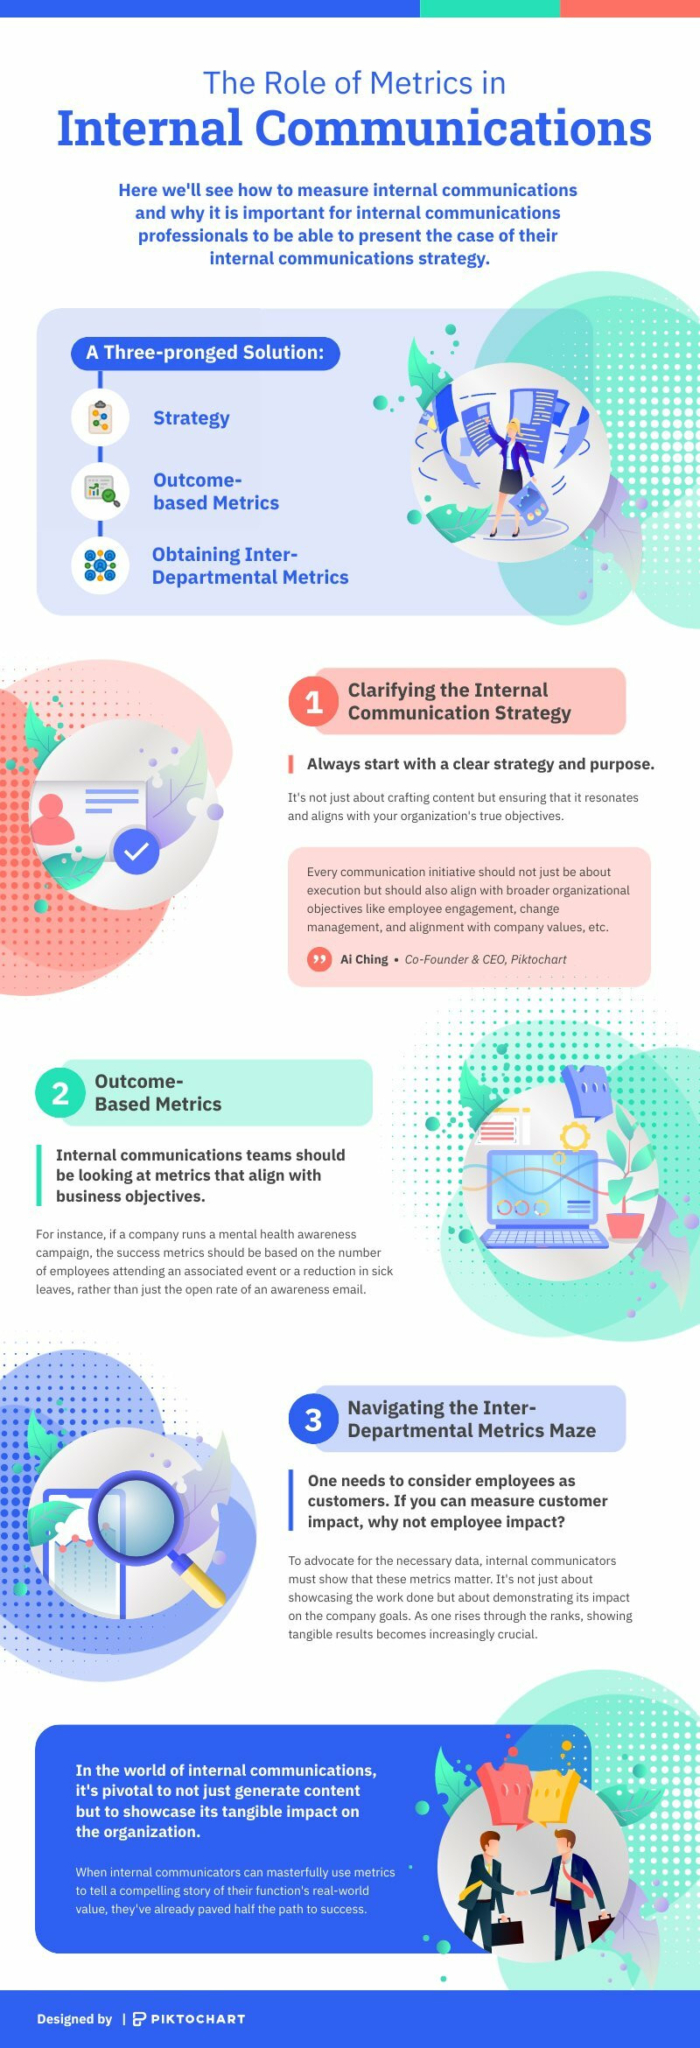
The Role Of Metrics In Internal Communications
Infographics
The Role Of Metrics In Internal Communications
 Infographics
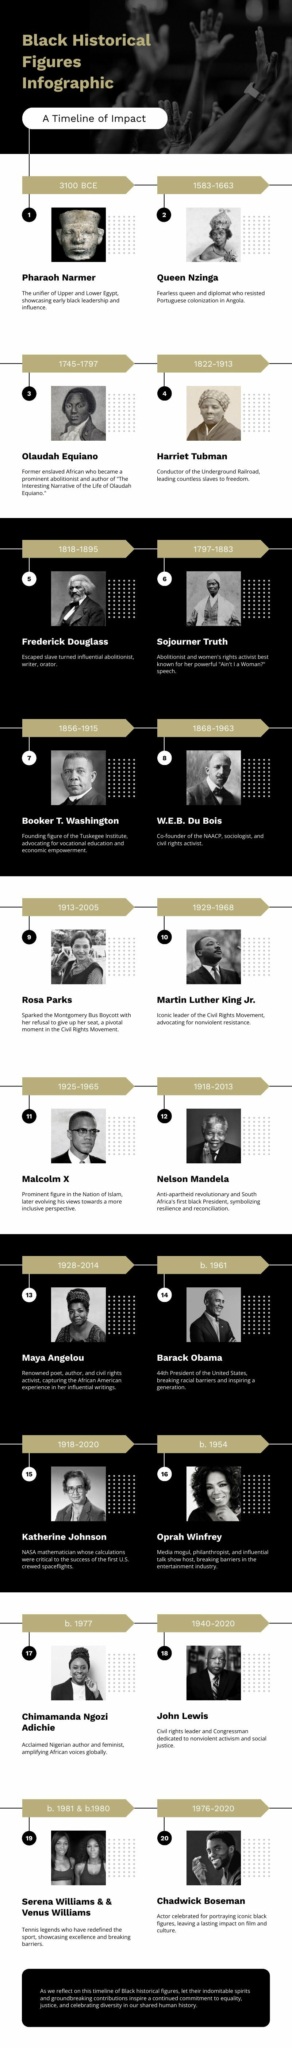
Black Historical Figures Infographic
Infographics
Black Historical Figures Infographic
 Infographics
Facts About Women’s History Month
Infographics
Facts About Women’s History Month
 Infographics
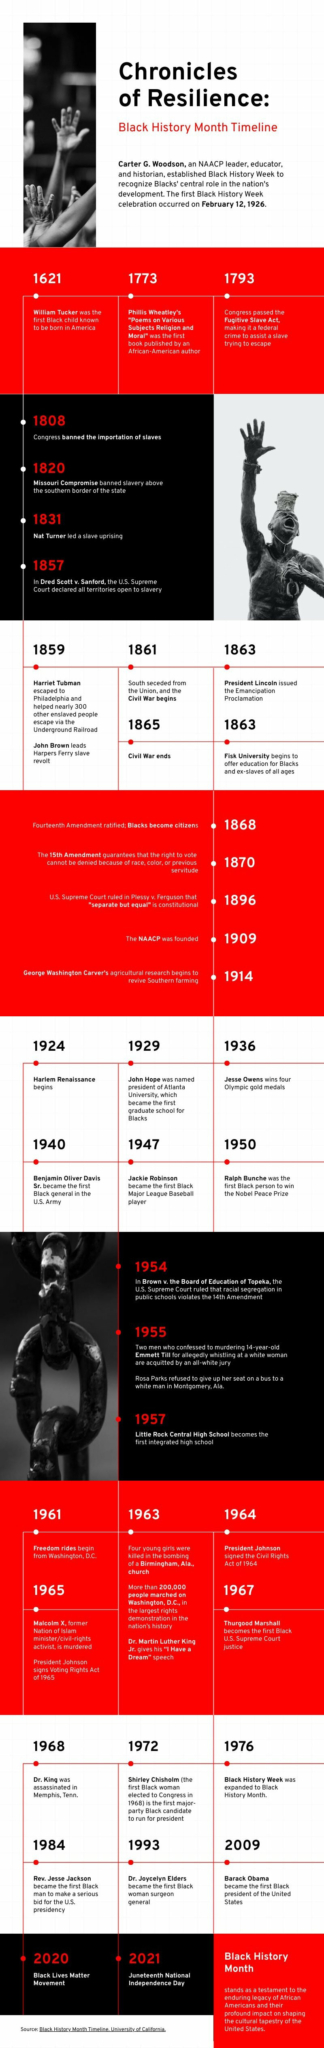
History of Black History Month Infographic
Infographics
History of Black History Month Infographic
 Infographics
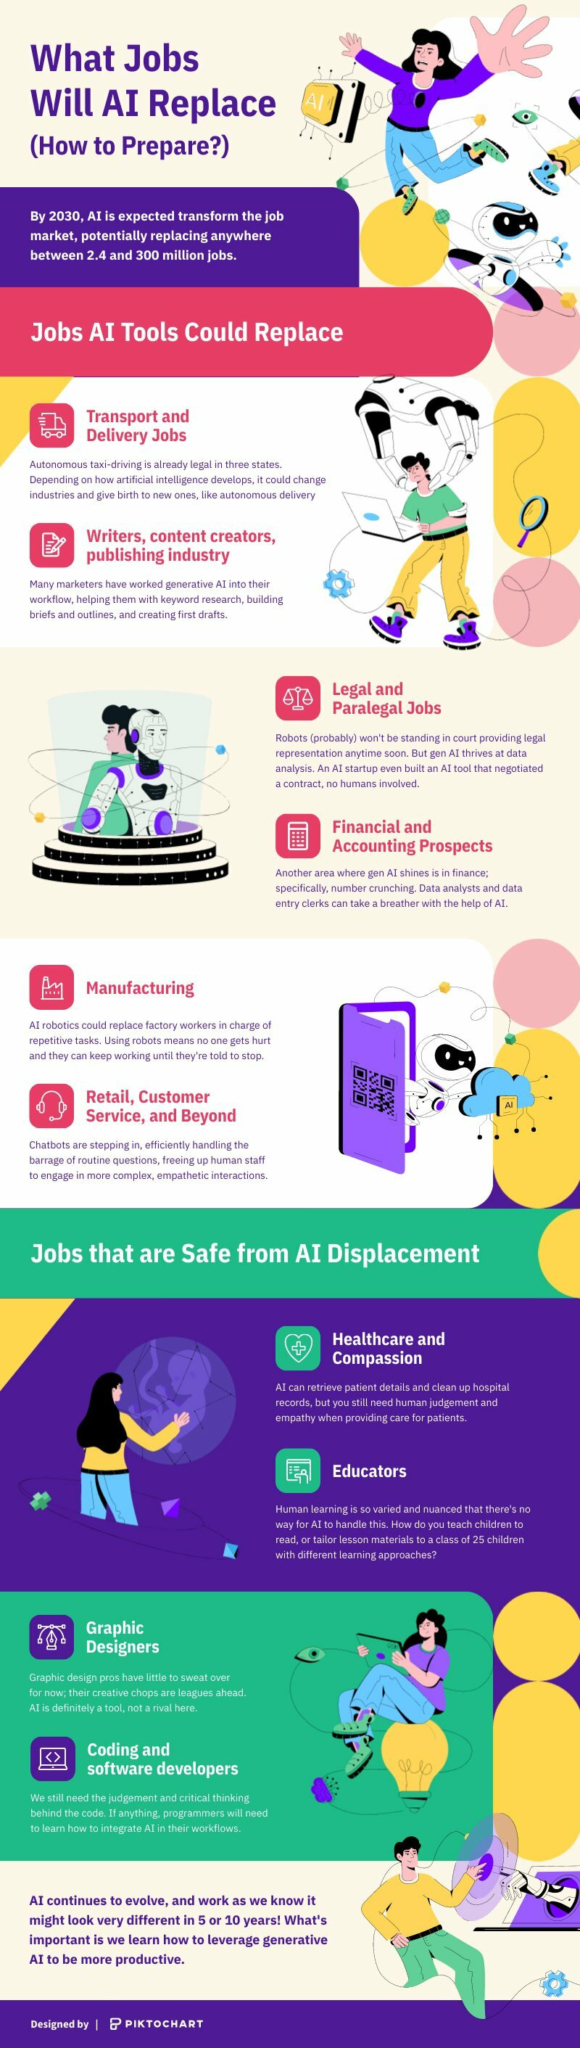
What Jobs Will AI Replace
Infographics
What Jobs Will AI Replace
 Infographics
AI Carbon Footprint
Infographics
AI Carbon Footprint
 Infographics
Modern Mental Health Statistics
Infographics
Modern Mental Health Statistics
 Infographics
Artificial Intelligence Statistics
Infographics
Artificial Intelligence Statistics
 Infographics
Mental Health Facts
Infographics
Mental Health Facts
 Infographics
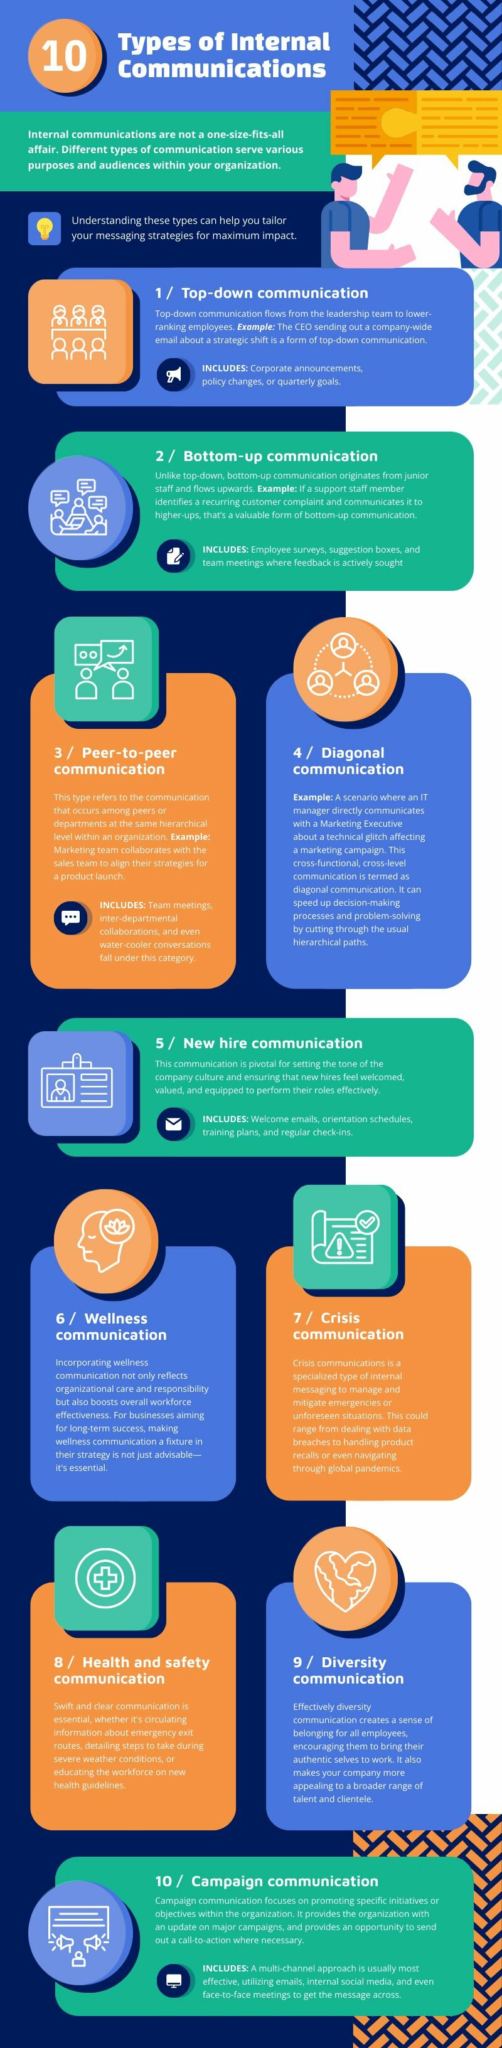
Types of Internal Communications
Infographics
Types of Internal Communications