The simplest and fastest way to create financial reports

Quick Creation
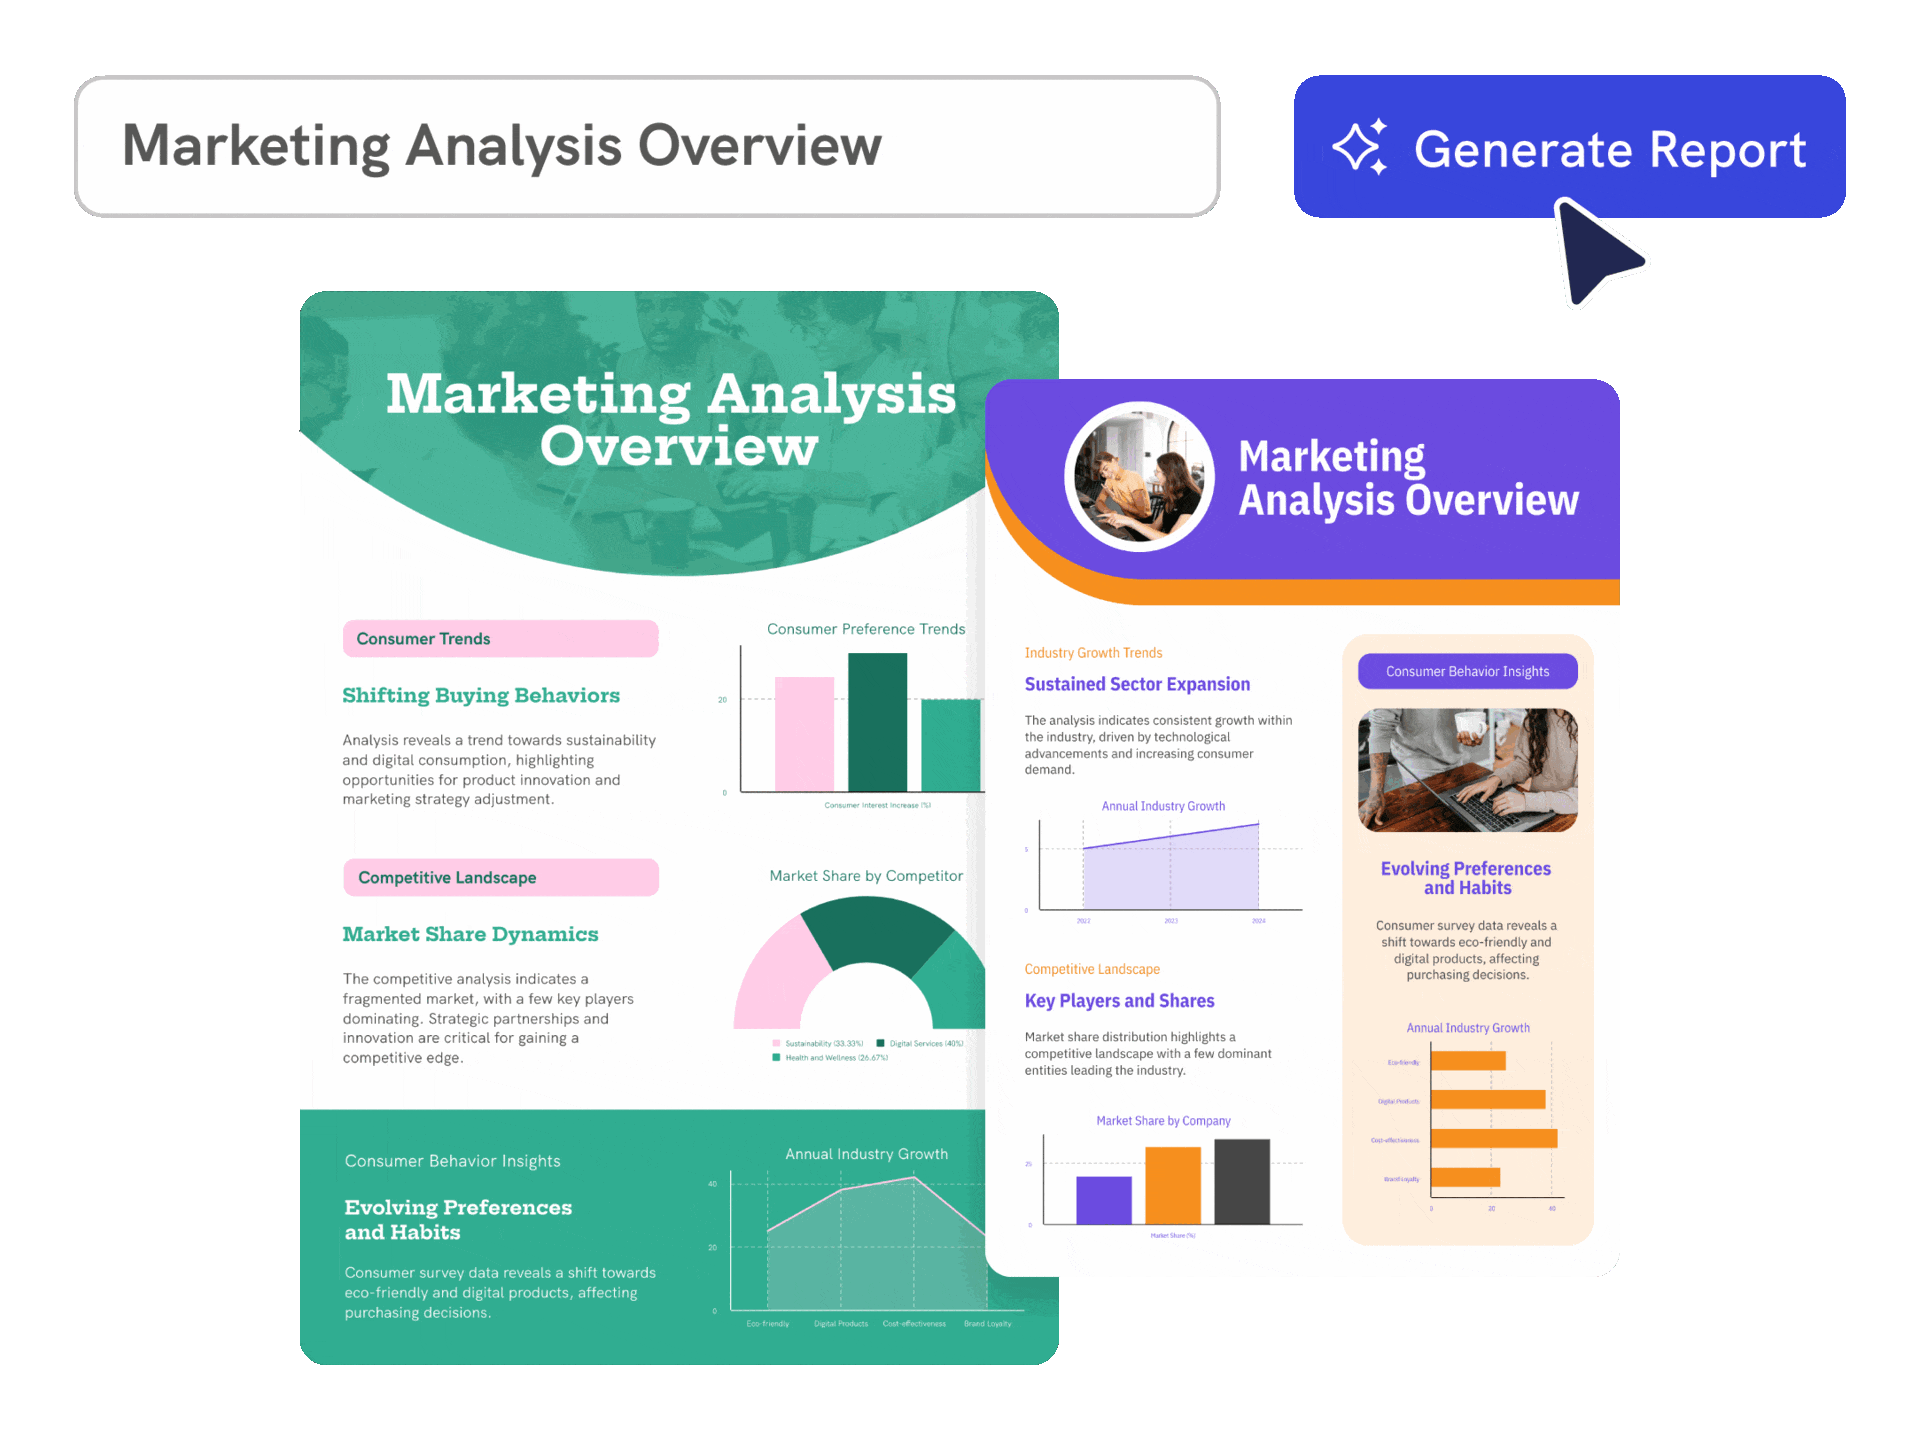
Turn financial data into a visual report
Describe the reporting period, key metrics, and audience. Piktochart AI creates an editable financial report draft with sections, charts, and data layout ready to customize.
Start creating

Elevated Presentation
Start from notes, summaries, or uploaded data
Paste a financial summary or upload a supported document. Piktochart AI organizes the numbers and narrative into a structured visual report that stakeholders can scan quickly.
Generate visual from document
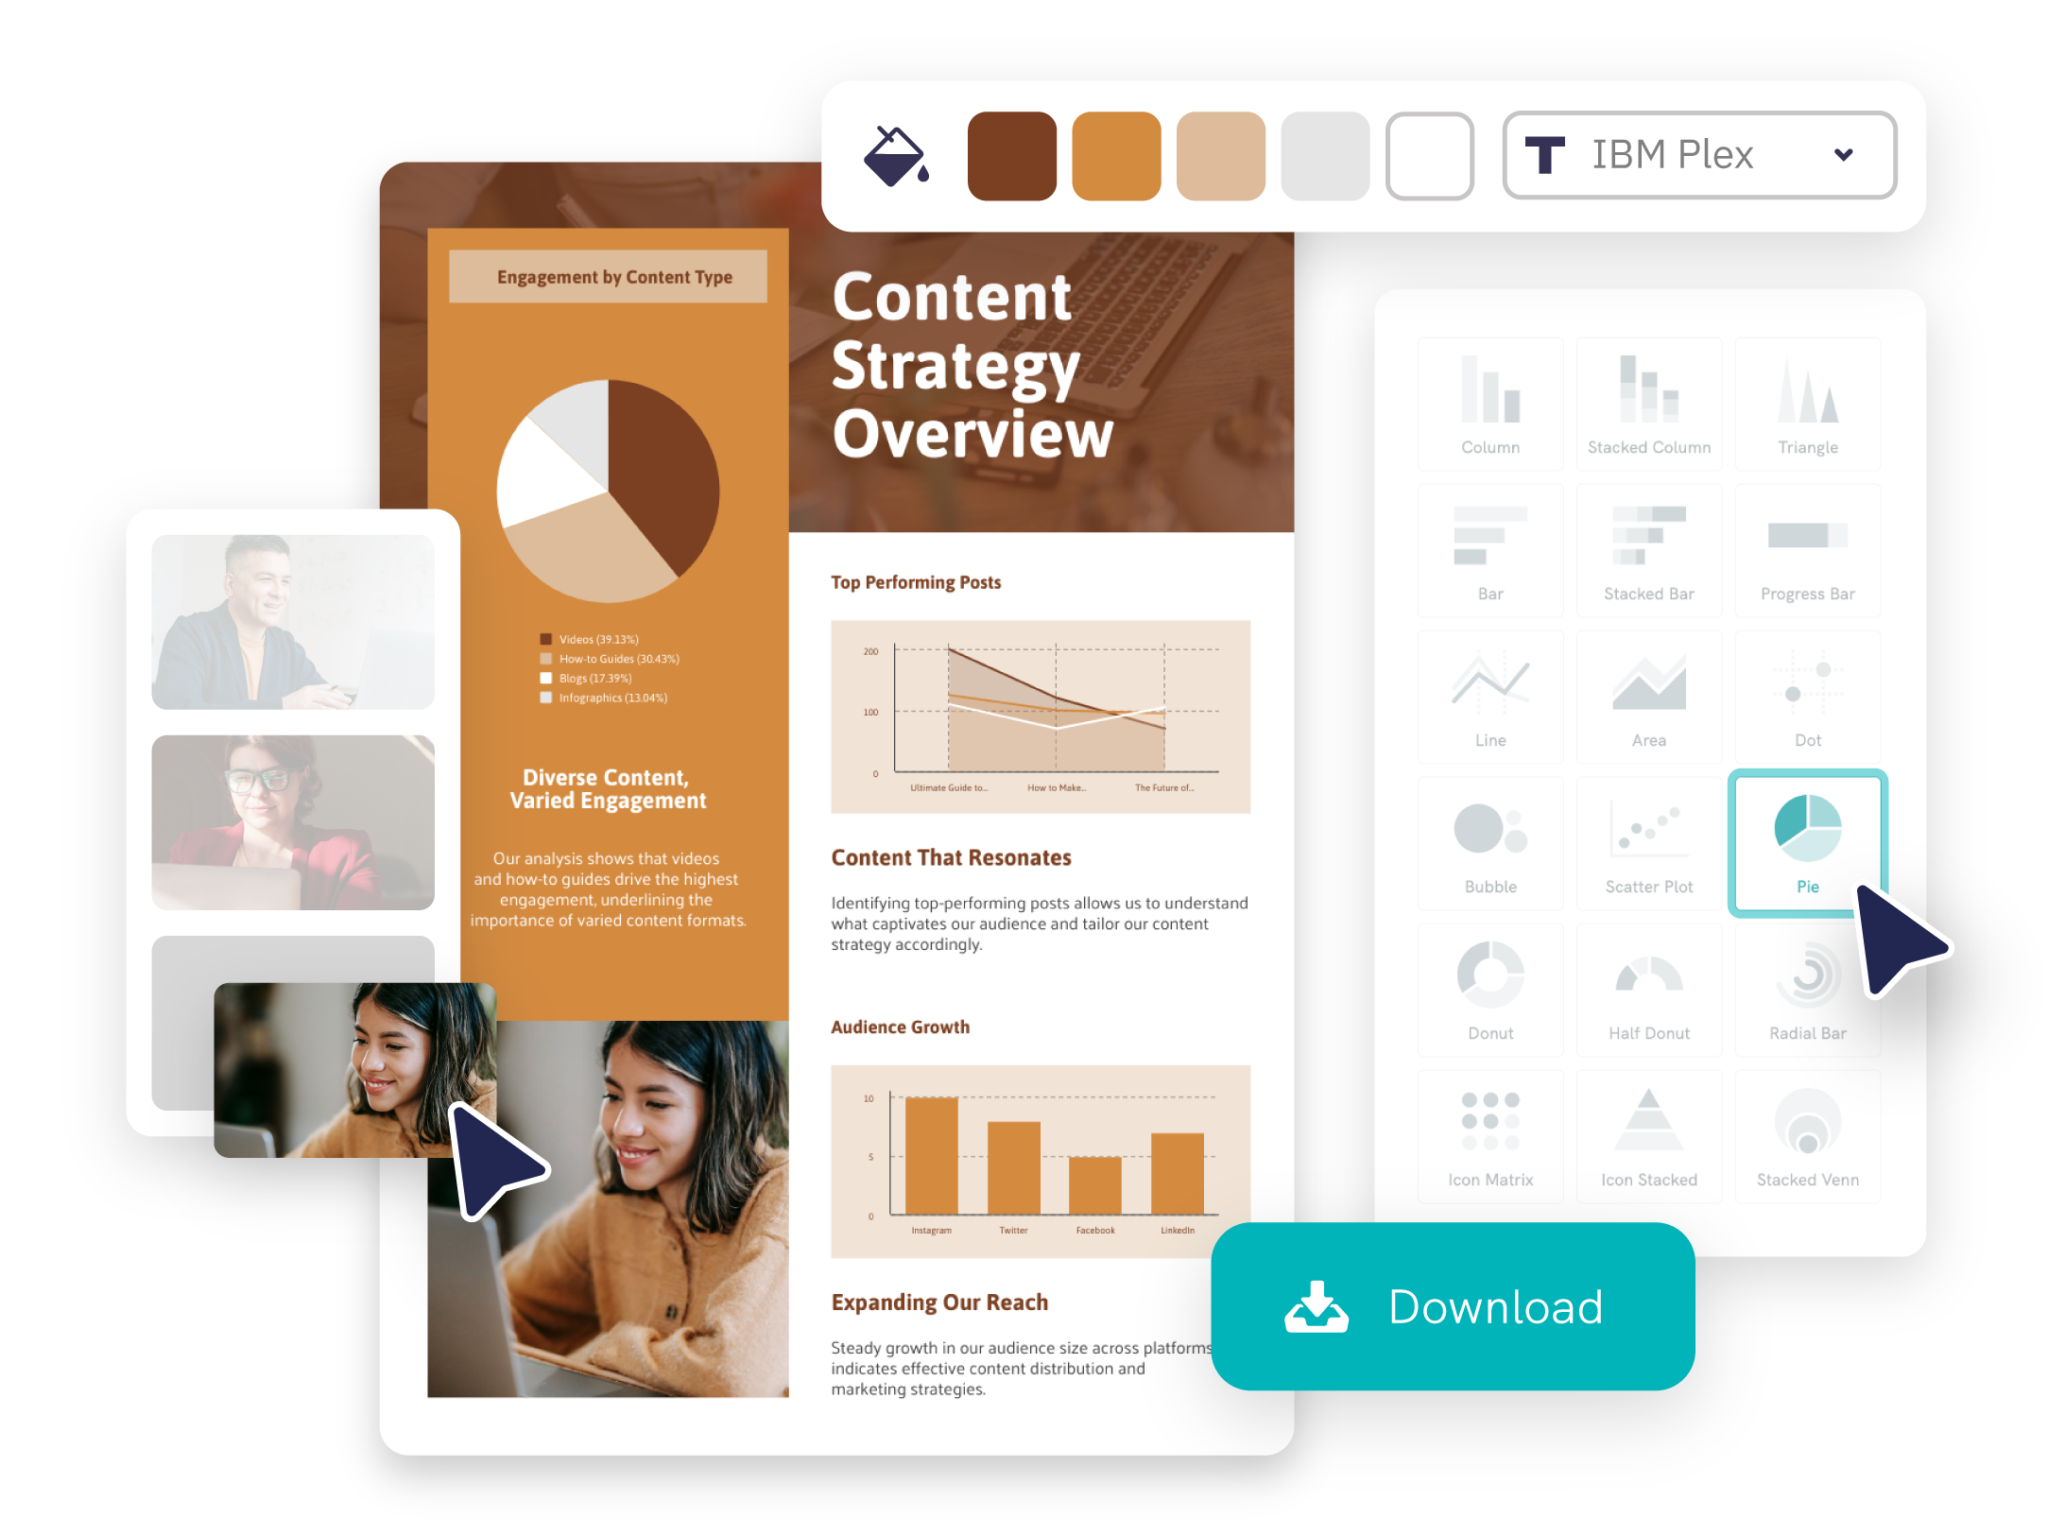
Easy Customization
Customize charts, sections, and branding
Edit chart types, colors, fonts, labels, images, and section layout in Piktochart’s editor so the report matches your company’s style and compliance requirements.
Start creating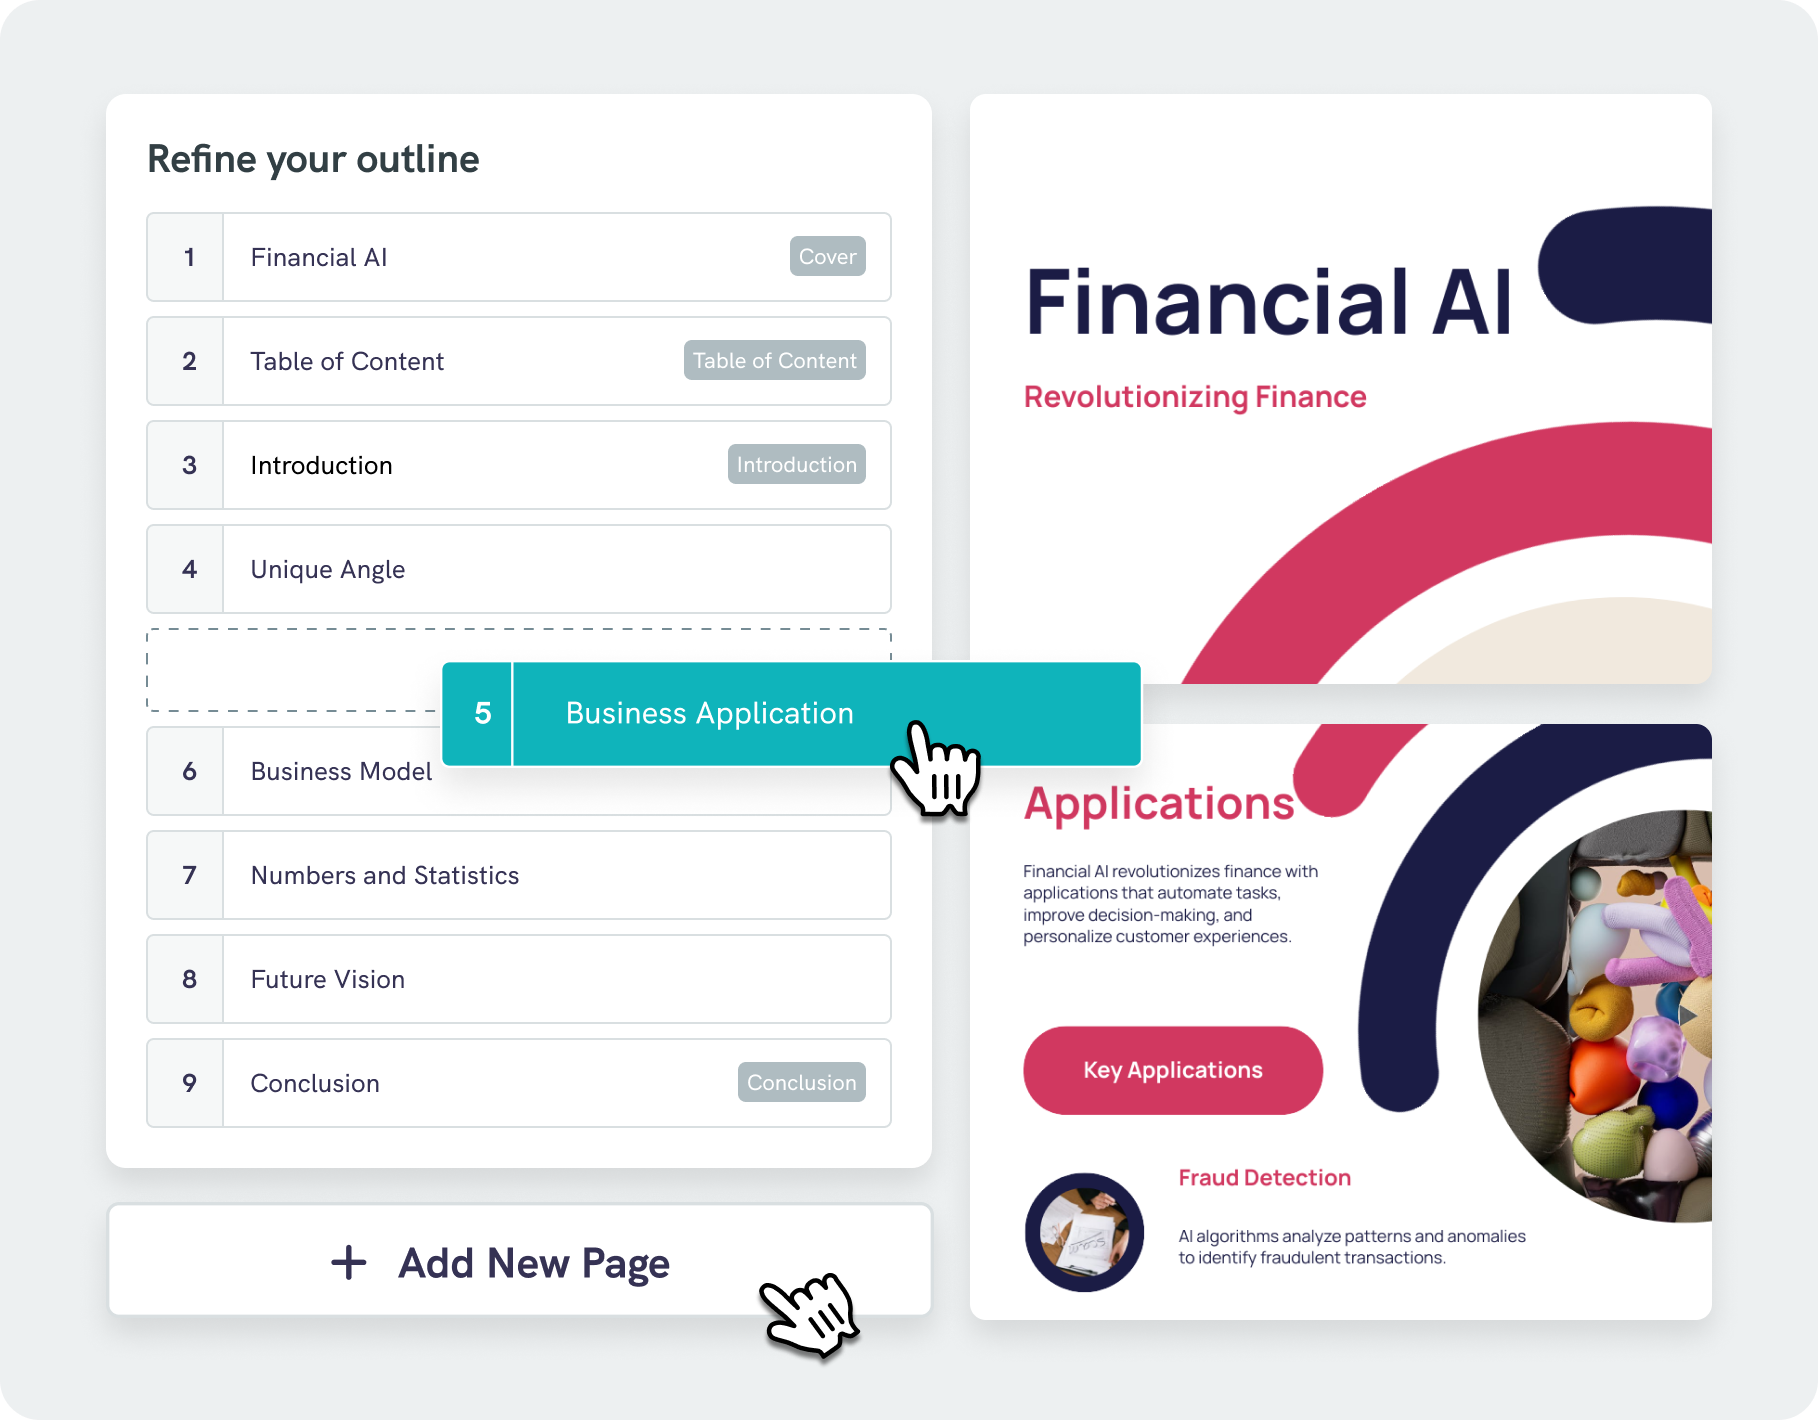
Simplified Document Structuring
Export in presentation-ready formats
Download the finished financial report as a PDF, PNG, or shareable link. Piktochart gives you output options that work for board meetings, investor decks, and internal reviews.
Start creatingTrusted by Industry Leaders

Executives and C-suite Leaders
- To assess company performance, market trends, and financial health to make informed, high-level strategic decisions that drive growth and profitability.
- To provide clear, data-backed updates to investors, board members, and other key stakeholders, ensuring transparency and fostering confidence in the organization’s direction.
- For monitoring company-wide metrics through reports, tracking KPIs to evaluate overall business health, operational efficiency, and goal achievement.

Marketing Managers
- To evaluate the effectiveness of marketing campaigns, assessing metrics such as conversion rates, ROI, and customer engagement to refine strategies and optimize future efforts.
- Provide valuable insights into market trends, customer preferences, and competitive analysis to identify opportunities.
- For tracking expenditures and performance against budgeted allocations, ensuring that marketing initiatives are cost-effective and aligned with overall business goals.

Business Analysts
- Analyze large datasets to identify trends and insights, turning complex data into actionable information for decision-making.
- To effectively communicate findings and recommendations to stakeholders, facilitating collaboration and understanding.
- For tracking key performance indicators (KPIs) through reports to evaluate the effectiveness of strategies and identify areas for improvement.

Project and Product Managers
- To monitor the status of project milestones and deliverables, ensuring the project is on schedule and identifying any potential delays.
- To assess resource allocation and utilization, and make informed decisions to keep the project on track.
- To communicate project updates, risks, and outcomes to stakeholders, ensuring alignment and transparency throughout the project lifecycle.
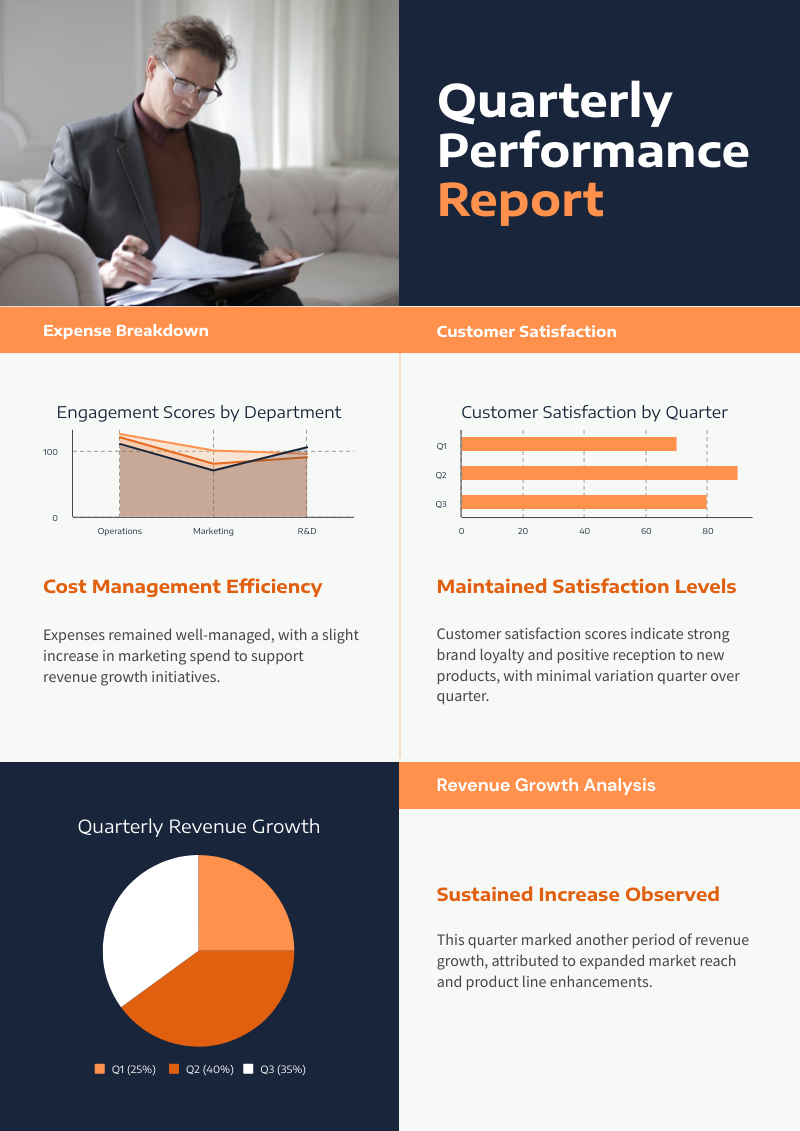
Reports created using Piktochart AI
How to create a financial report with AI
1. Describe your financial report
Start with a quarterly summary, budget overview, revenue breakdown, expense data, or uploaded financial document. Add the audience, purpose, tone, and any must-include details so the AI can shape a useful first draft.
2. Generate the first visual draft
Piktochart AI turns your prompt or content into an editable financial report with structure, hierarchy, and visual direction already in place.
3. Customize the design
Open the draft in Piktochart’s editor to adjust copy, colors, fonts, icons, images, sections, and brand details. Every generated visual remains editable.
4. Share or download
Use the finished financial report in presentations, campaigns, classes, reports, applications, or team updates. Free accounts can start with 60 AI credits every month.
Discover other types of documents you can generate with Piktochart AI


Ready to create financial reports with AI?
Join more than 14 million people who already use Piktochart to turn information into clearer visuals.