Experience the future of creating clear and compelling charts

Seamless Creation
Create charts from prompts or data
Describe the data story or paste the numbers you want to visualize, and Piktochart AI helps create an editable chart draft.
Start creating
Full Customization
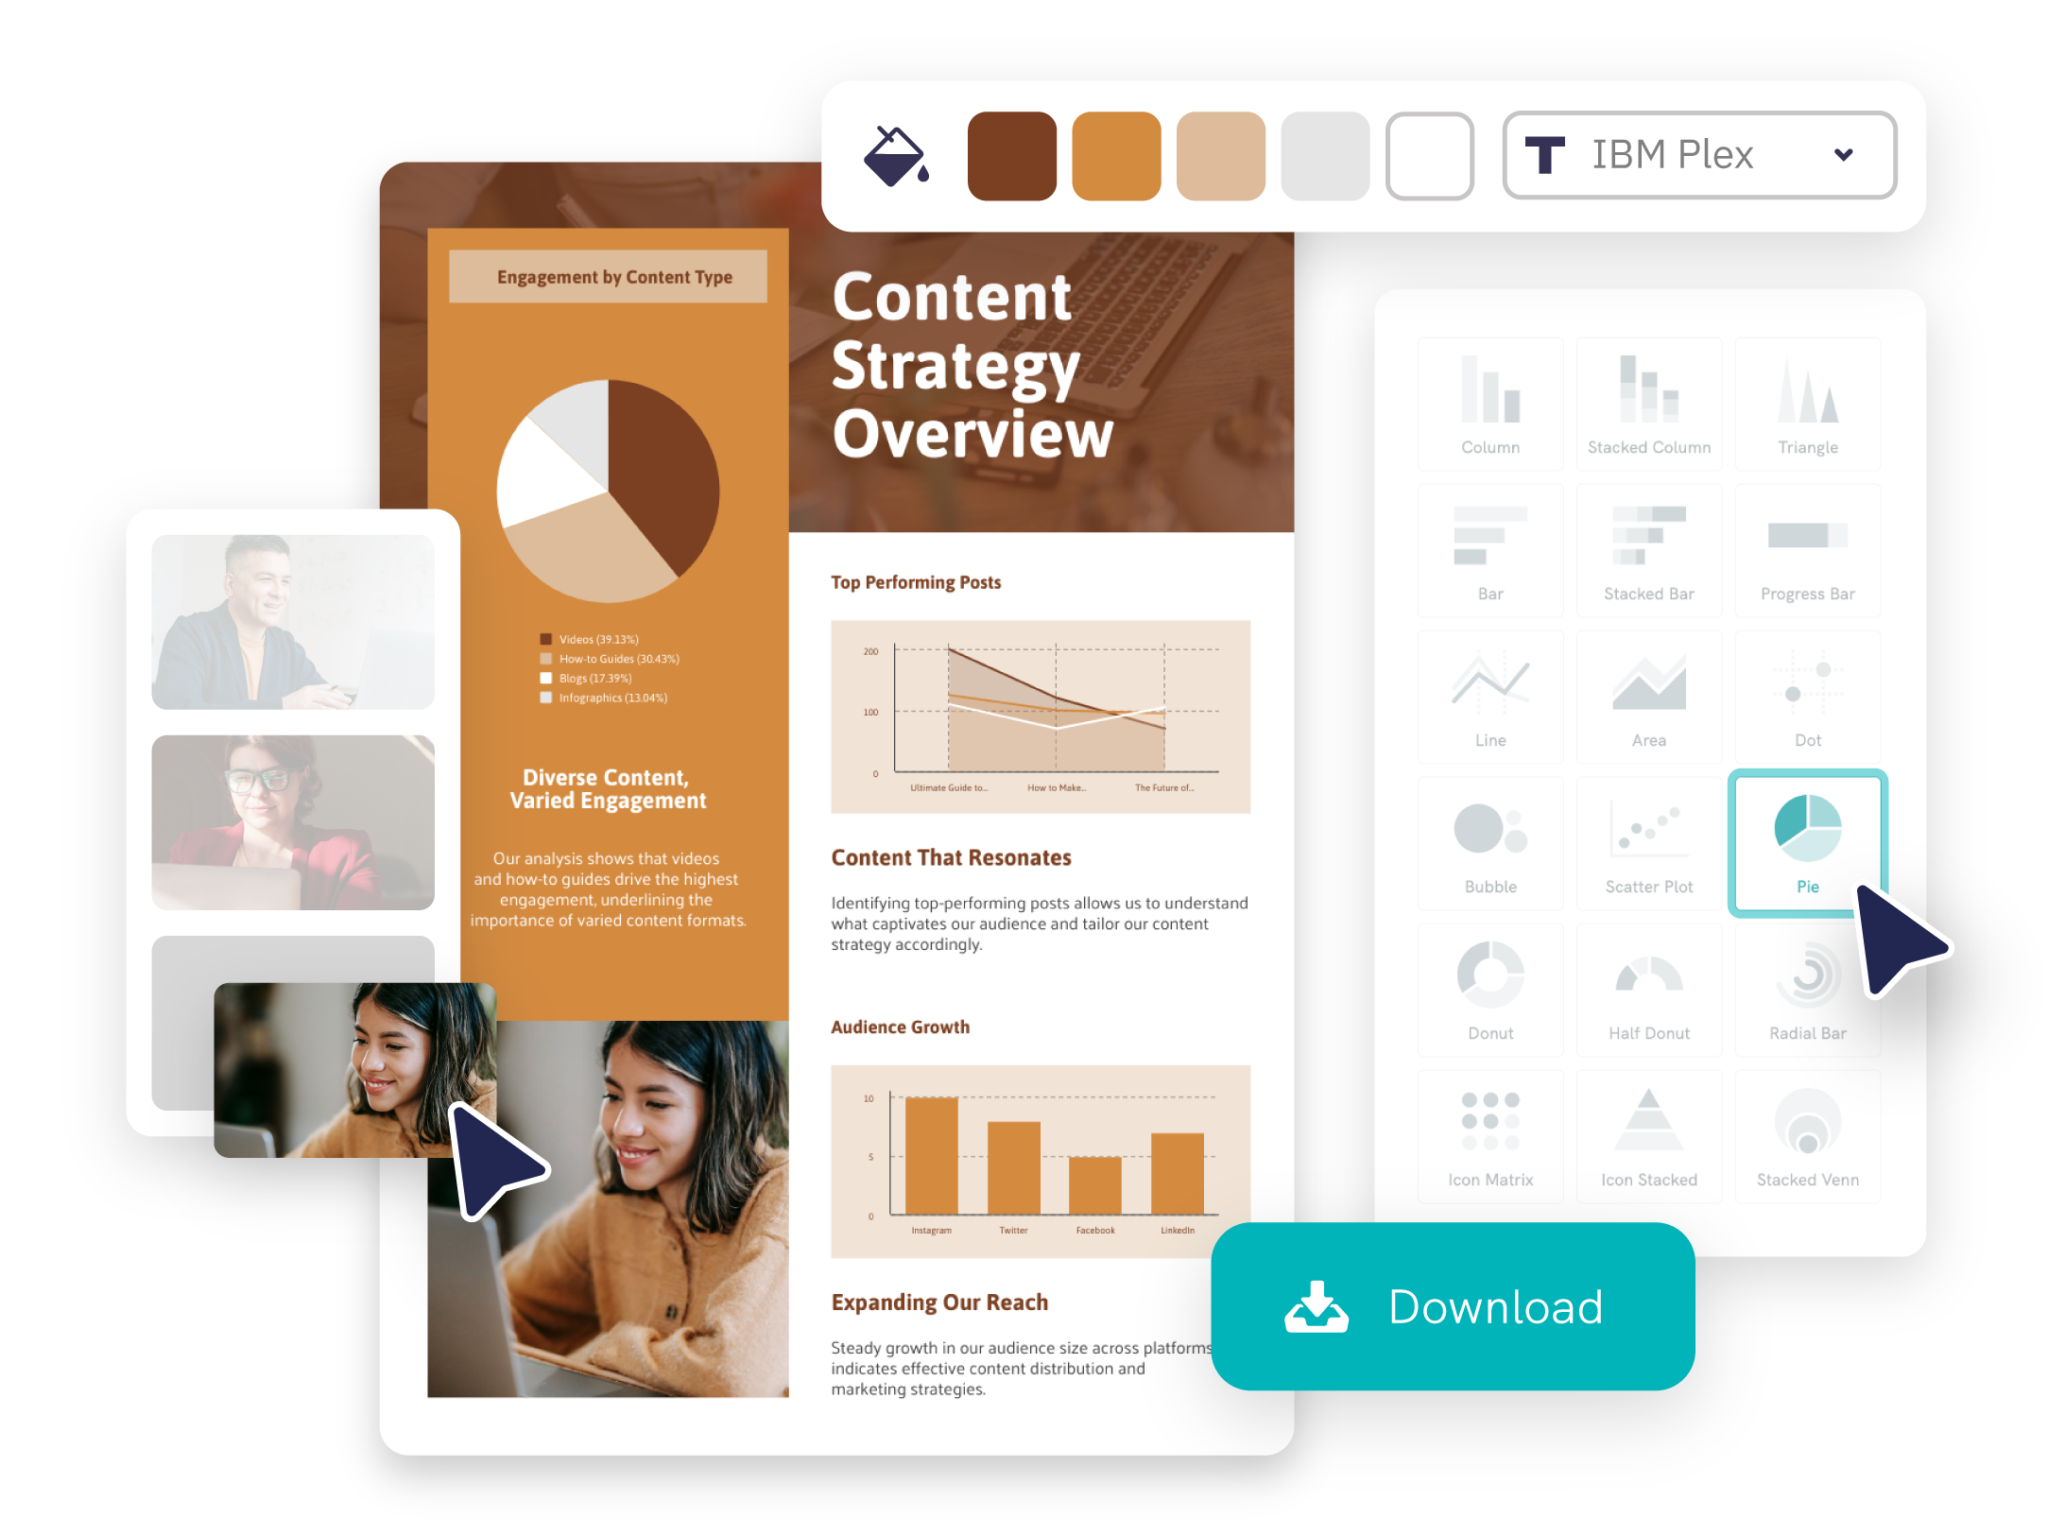
Choose the right visual for the message
Use charts to compare categories, show trends, explain proportions, or highlight a key data point in reports and presentations.
Start creating
Effortless Design Process
Edit chart labels and design details
Refine labels, colors, fonts, values, legends, icons, and layout so the chart is clear, accurate, and presentation ready.
Generate visual from documentTrusted by Industry Leaders

Marketers
- Visualize marketing campaign results, customer demographics, and market trends, facilitating data-driven decision-making.
- Engaging, easy-to-understand reports for clients, showcasing campaign performance, ROI, and key marketing metrics.
- Identify emerging trends and forecasting future market movements.

HR and Learning and Development Reports
- Highlight progress, identify areas for improvement, and facilitate effective performance reviews.
- Visually represent the impact and effectiveness of training programs.
- Compile and interpret data on workforce diversity, employee satisfaction, and organizational culture.

NGOs and Government Organizations
- Illustrate impact on communities by showcasing progress on projects, beneficiary stories, and fund utilization, essential for donor reports and stakeholder updates.
- Reports on donation usage, program effectiveness, and organizational financial health.
- Analyze program data, helping to assess effectiveness, identify areas for improvement, and inform future project planning and resource allocation.

Researchers
- Transform complex datasets into clear, comprehensible visuals, aiding in the presentation of research findings.
- Easy sharing and editing of reports, essential for multi-author studies and publications.
- Prepare reports for academic journals or conferences, aligning with publication standards.
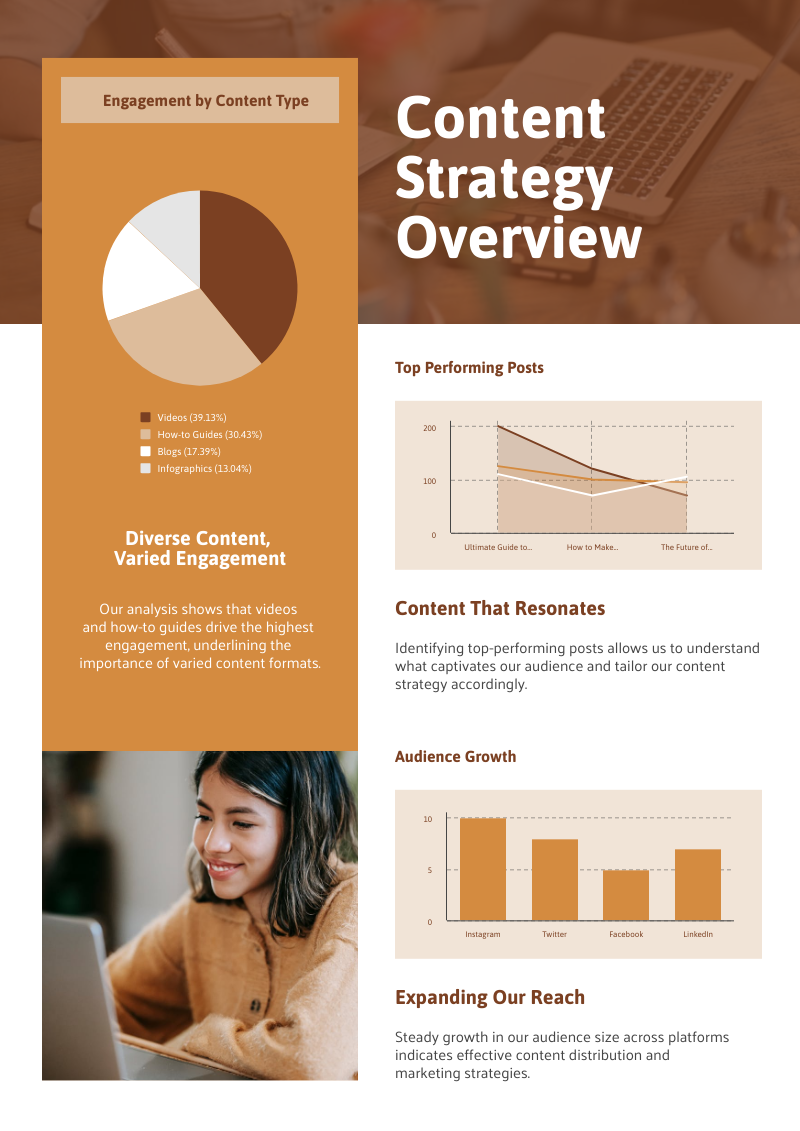
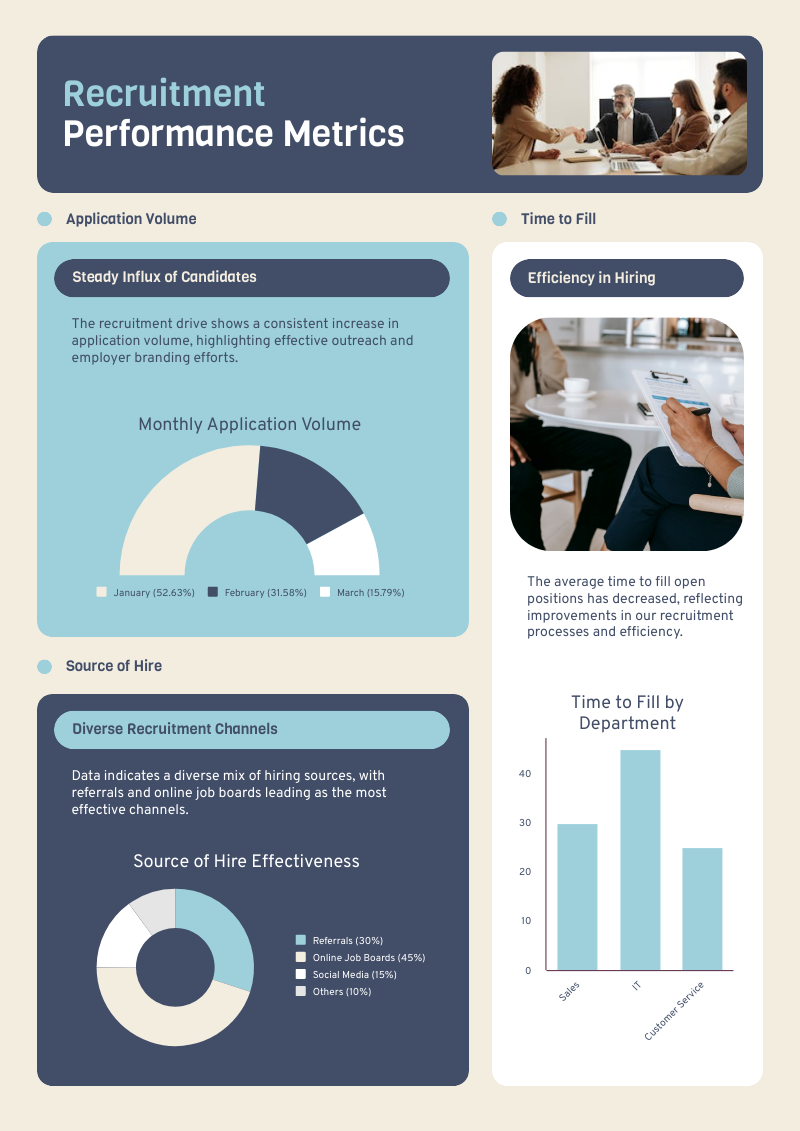
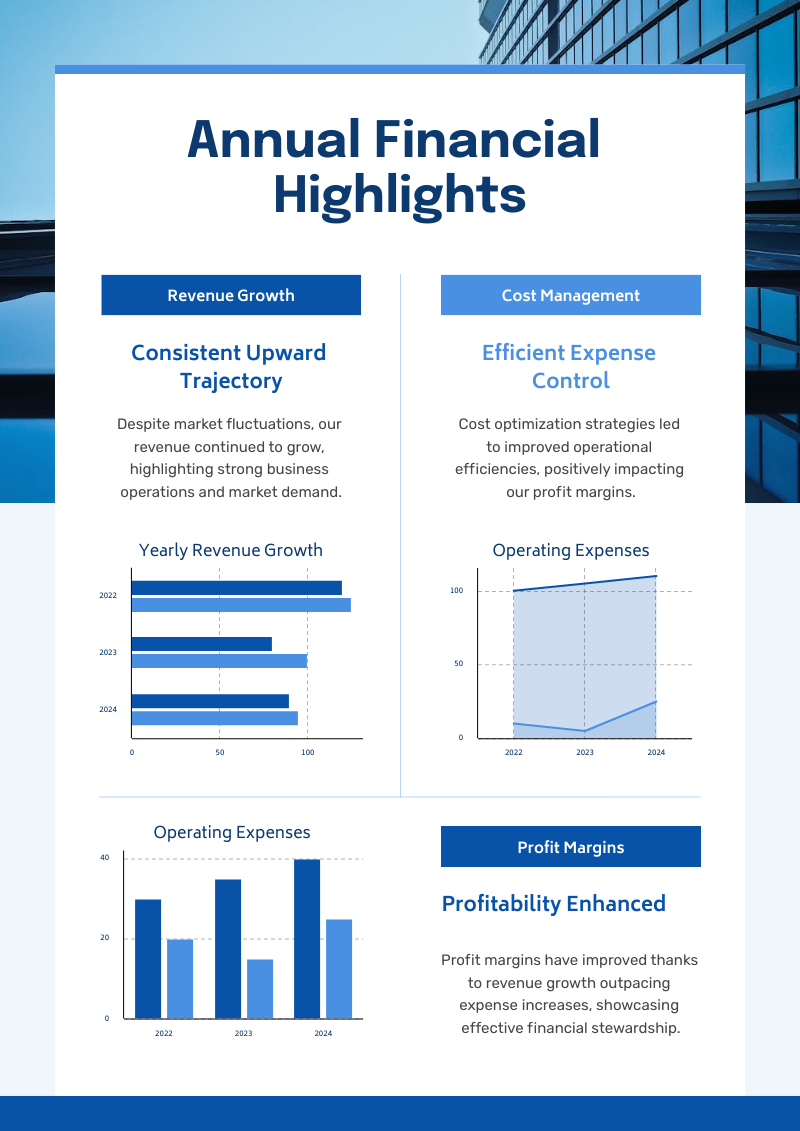
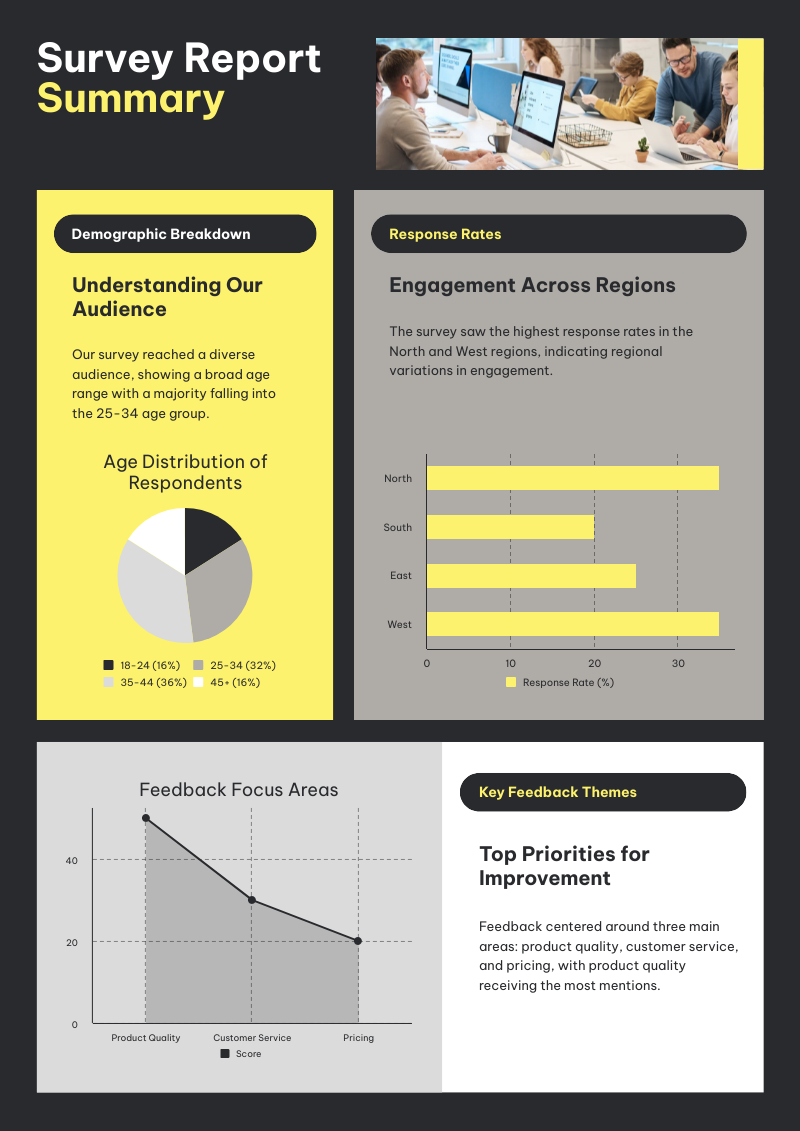
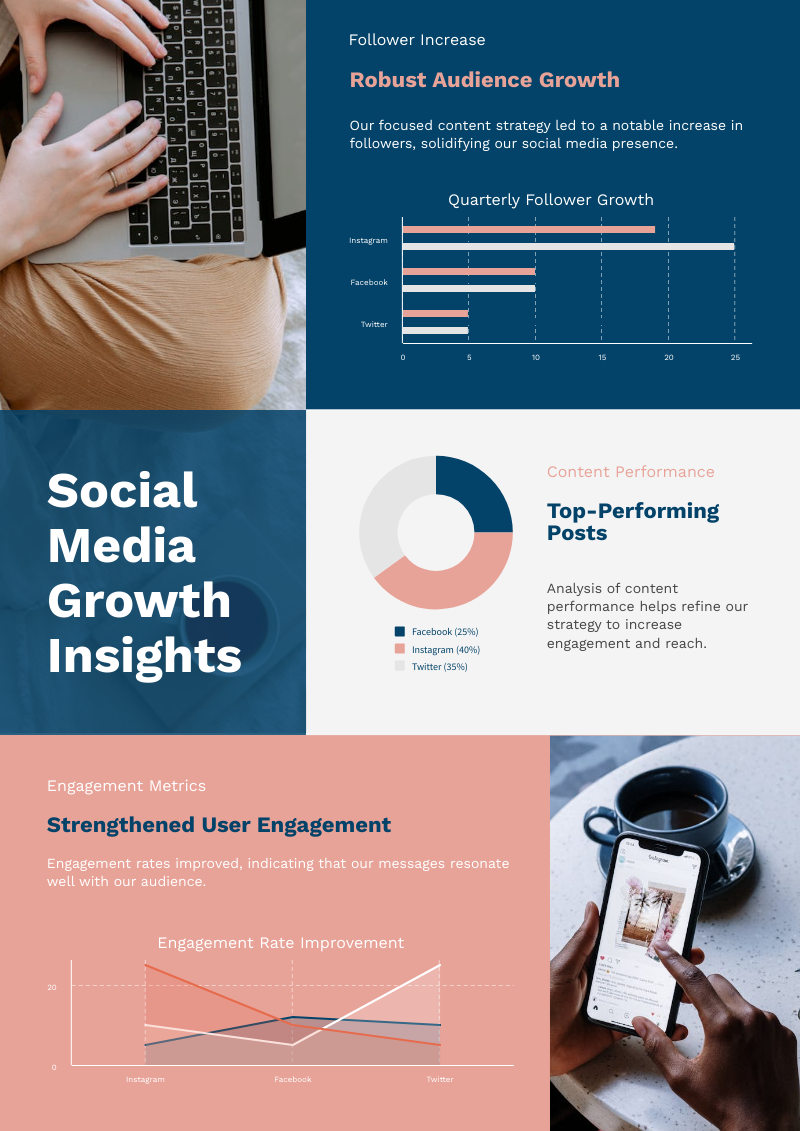
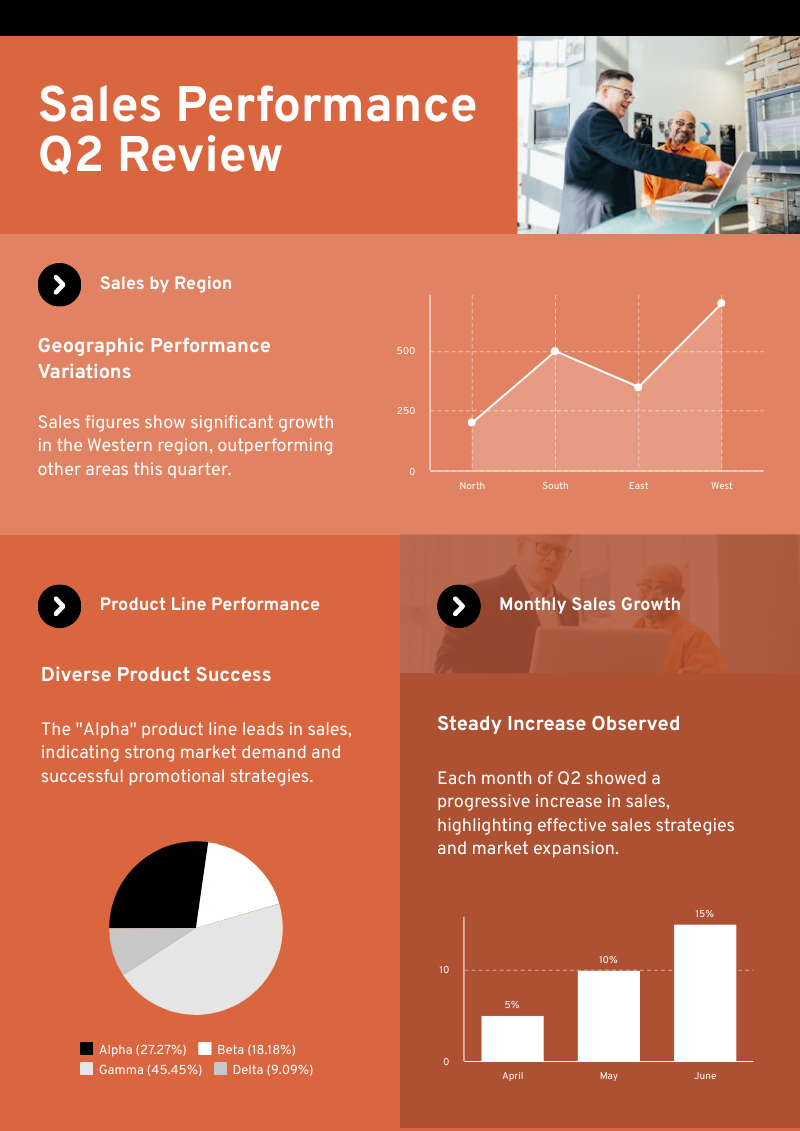
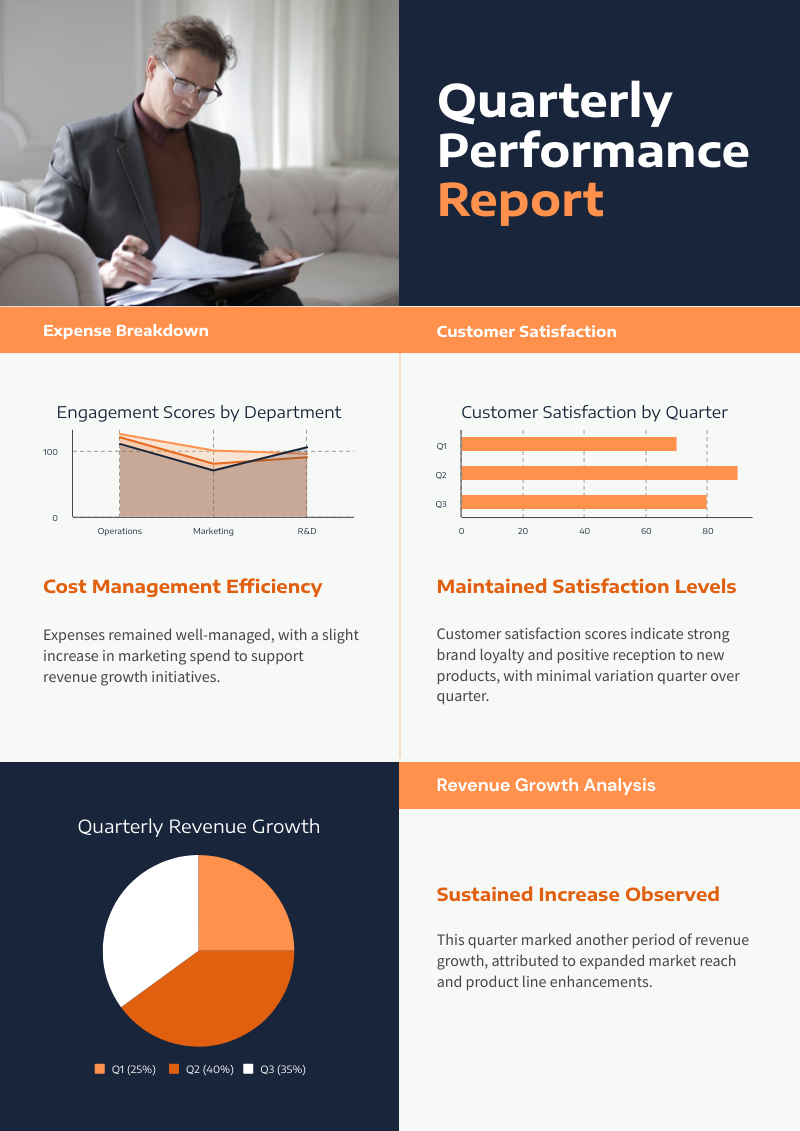
Charts created using Piktochart’s AI-powered chart generator


How to create a chart with AI
1. Describe your chart
Start with a data table, pasted numbers, comparison points, report notes, or a chart description. Add the audience, purpose, tone, and must-have details so Piktochart AI can create a useful first draft.
2. Generate the first visual draft
Piktochart AI turns your prompt or content into an editable chart with a clear structure and visual direction.
3. Customize the design
Edit copy, colors, fonts, icons, images, sections, and brand details in Piktochart’s editor. Every generated visual remains editable.
4. Share or download
Use the finished chart in campaigns, presentations, reports, classes, proposals, or team updates. Free accounts include 60 AI credits every month.
What can you create with an AI chart generator?
Piktochart AI helps you create bar charts, line charts, pie charts, comparison charts, report visuals, dashboard snippets, and presentation charts without starting from a blank canvas.
Bar Charts
Generate a first draft for bar charts from a short prompt, then customize the content, layout, and visuals in Piktochart’s editor.
Line Charts
Generate a first draft for line charts from a short prompt, then customize the content, layout, and visuals in Piktochart’s editor.
Pie Charts
Generate a first draft for pie charts from a short prompt, then customize the content, layout, and visuals in Piktochart’s editor.
Comparison Charts
Generate a first draft for comparison charts from a short prompt, then customize the content, layout, and visuals in Piktochart’s editor.
Ready to create charts with AI?
Join more than 14 million people who already use Piktochart to turn information into clearer visuals.