“Piktochart AI is the easiest and fastest way to create visually appealing infographics!”
Aurelius Tjin
YouTuber and Digital Creator

Instant Creation
Generate any visual from a prompt
Describe what you need and Piktochart AI creates an editable visual draft, whether it is an infographic, poster, report, or social media graphic.
Start for free
Easy Upload
Skip the blank canvas entirely
Start from an AI-generated layout with structure, hierarchy, and copy placement already in place. Then refine the design in Piktochart’s editor.
Start for free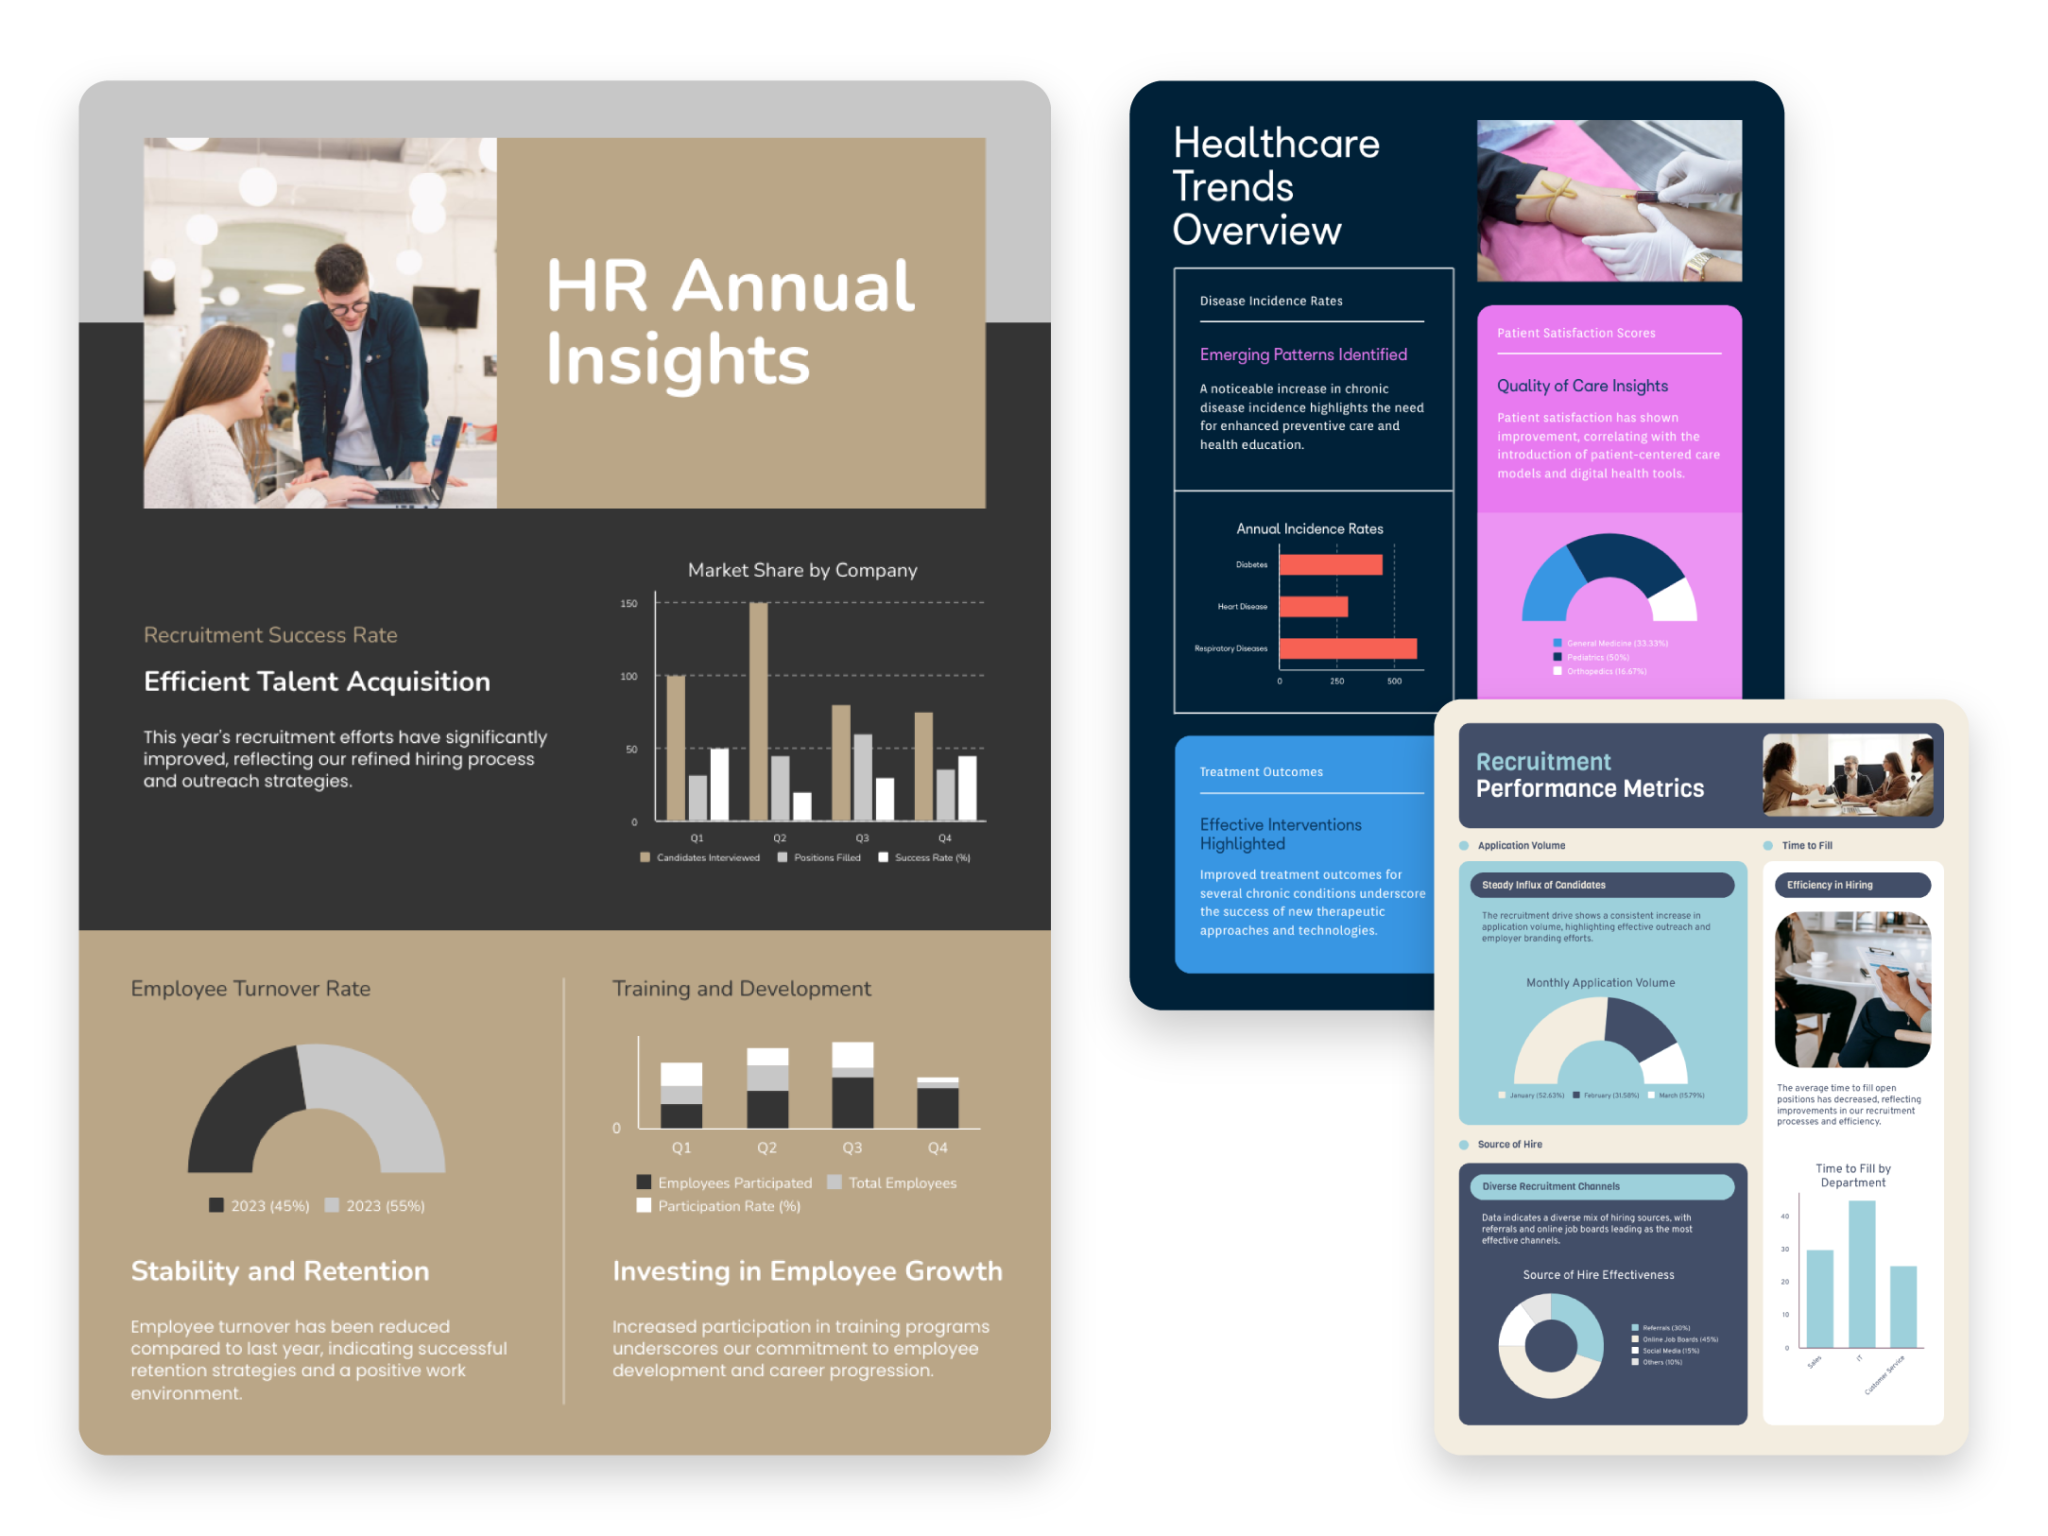
Complete Customization
Create visuals for every channel and audience
Use one tool to make content for social media, internal comms, marketing campaigns, classroom resources, and client presentations.
Start for free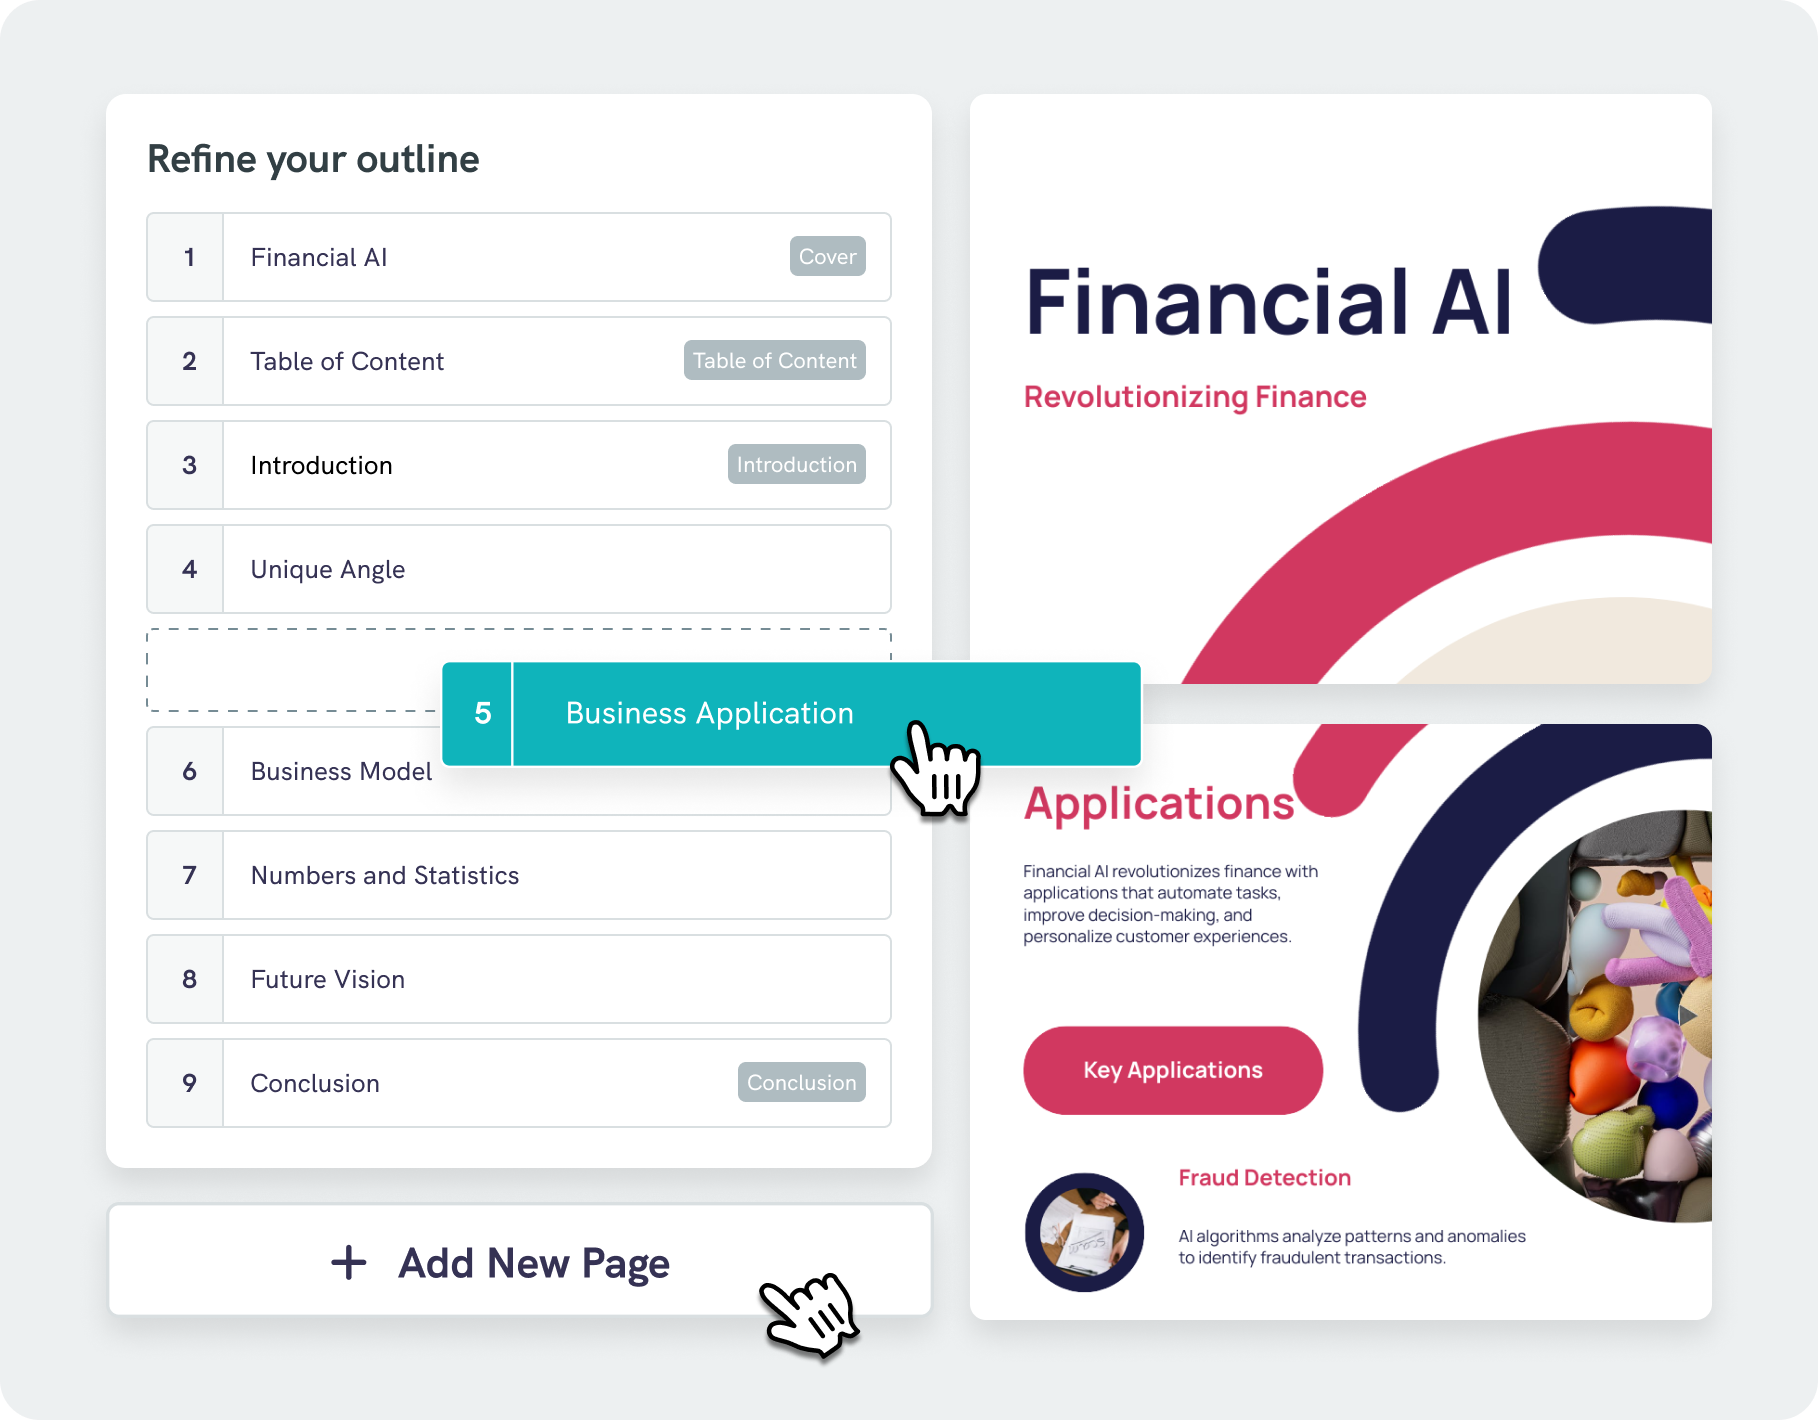
Present Data Beautifully
Customize everything in the editor
Adjust text, colors, fonts, icons, images, charts, and layout so every visual matches your brand, message, and audience.
Start creatingTypes of documents you can generate with Piktochart AI


Trusted by Industry Leaders

Marketers
- Visualize marketing campaign results, customer demographics, and market trends, facilitating data-driven decision-making.
- Engaging, easy-to-understand reports for clients, showcasing campaign performance, ROI, and key marketing metrics.
- Identify emerging trends and forecasting future market movements.

Business Leaders
- Create compelling reports to showcase project progress, key metrics, and financials, making updates easier to digest.
- Transform data, project updates, and financial insights into professional visuals for impactful client and executive presentations.
- Visualize internal reports and performance reviews, simplifying the discussion of key business insights and outcomes.

HR and L&D Trainers
- Highlight progress, identify areas for improvement, and facilitate effective performance reviews.
- Visually represent the impact and effectiveness of training programs.
- Compile and interpret data on workforce diversity, employee satisfaction, and organizational culture.

Researchers
- Transform complex datasets into clear, comprehensible visuals, aiding in the presentation of research findings.
- Easy sharing and editing of reports, essential for multi-author studies and publications.
- Prepare reports for academic journals or conferences, aligning with publication standards.
How to create visual content with AI
1. Describe your visual
Start with a topic, data set, campaign brief, presentation outline, or uploaded content. Add the audience, purpose, tone, and any must-include details so the AI can shape a useful first draft.
2. Generate the first visual draft
Piktochart AI turns your prompt or content into an editable visual with structure, hierarchy, and visual direction already in place.
3. Customize the design
Open the draft in Piktochart’s editor to adjust copy, colors, fonts, icons, images, sections, and brand details. Every generated visual remains editable.
4. Share or download
Use the finished visual in presentations, campaigns, classes, reports, applications, or team updates. Free accounts can start with 60 AI credits every month.
Ready to create visuals with AI?
Join more than 14 million people who already use Piktochart to turn information into clearer visuals.