Piktochart Templates Infographics
Free Infographic Templates
Turn complex data and ideas into clear, visual stories with free infographic templates. Perfect for marketers, educators, and teams who need to explain processes, share statistics, or summarize reports — customize and download in minutes.
Infographic Templates for Data-Driven Visual Storytelling
 Infographics
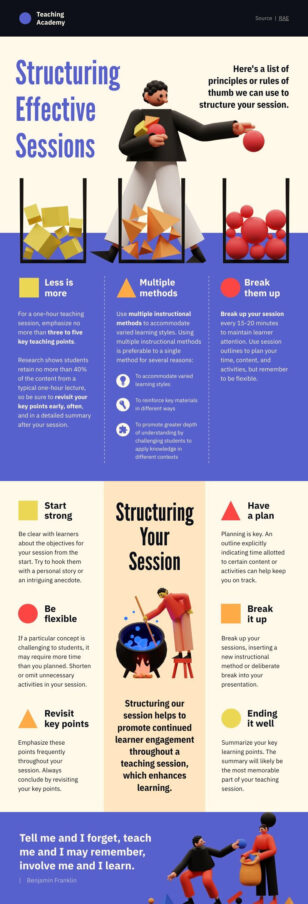
Study Tips
Infographics
Study Tips
 Infographics
Exam Preparation Tips
Infographics
Exam Preparation Tips
 Infographics
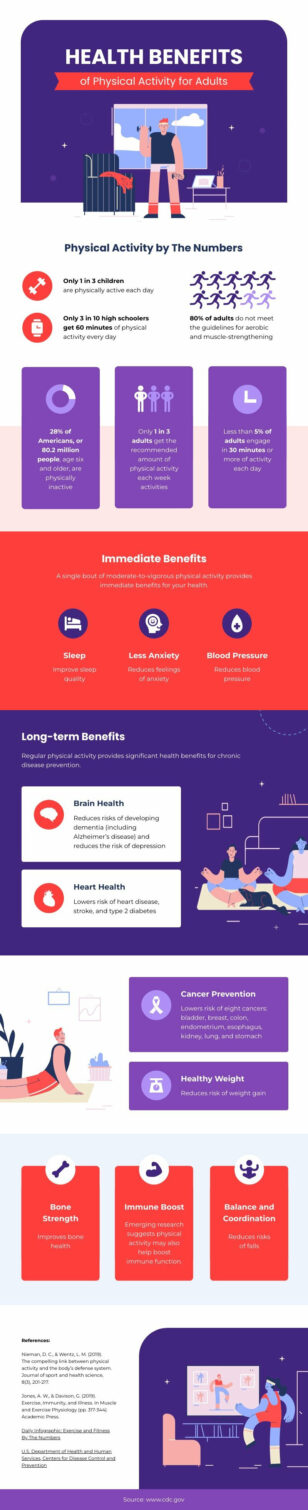
Health Benefits of Physical Activity
Infographics
Health Benefits of Physical Activity
 Infographics
The Teacher’s Guide
Infographics
The Teacher’s Guide
 Infographics
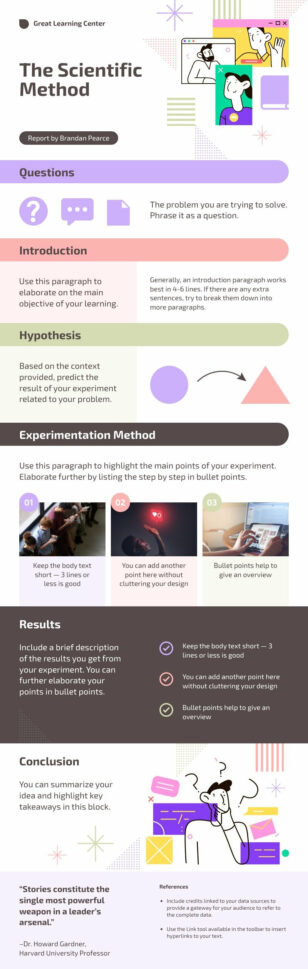
The Scientific Method
Infographics
The Scientific Method
 Infographics
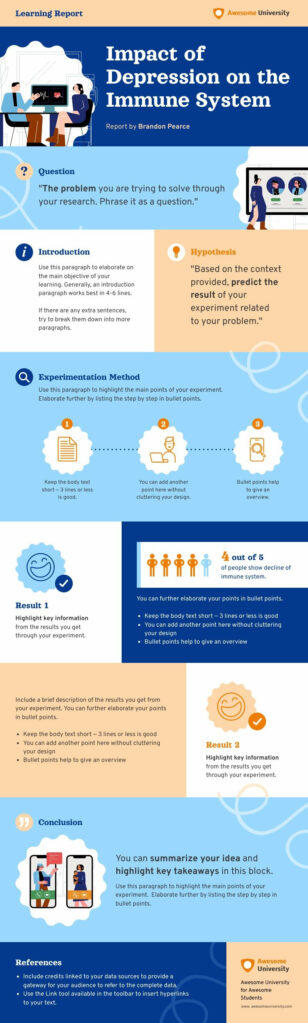
Impact of Depression on the Immune System Experiment Report
Infographics
Impact of Depression on the Immune System Experiment Report
 Infographics
Talent Acquisition
Infographics
Talent Acquisition
 Infographics
Unemployment Statistics
Infographics
Unemployment Statistics
 Infographics
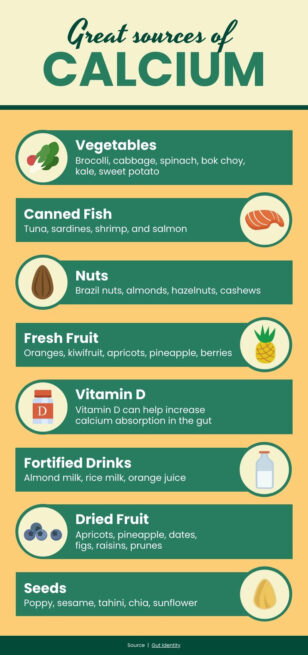
Great Sources Of Calcium
Infographics
Great Sources Of Calcium
 Infographics
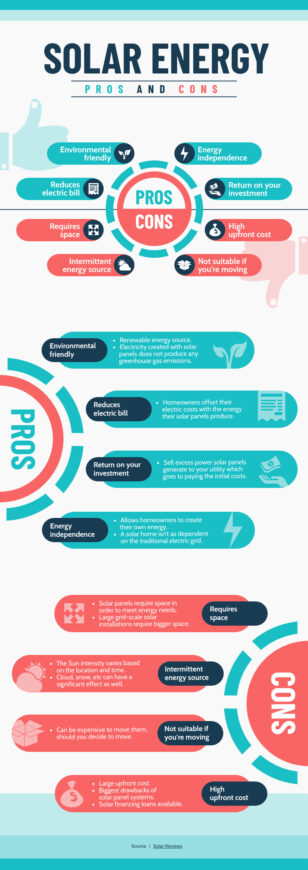
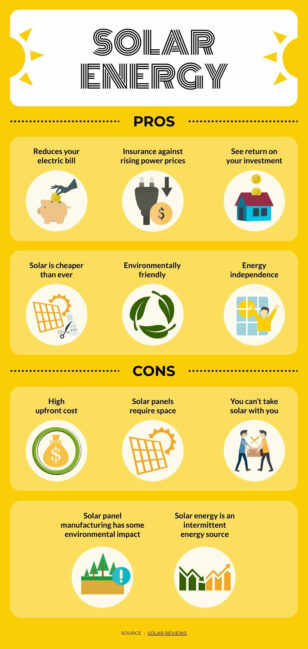
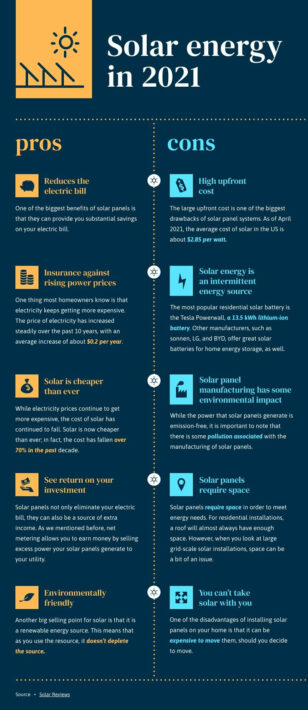
Pros and Cons of Solar Energy
Infographics
Pros and Cons of Solar Energy
 Infographics
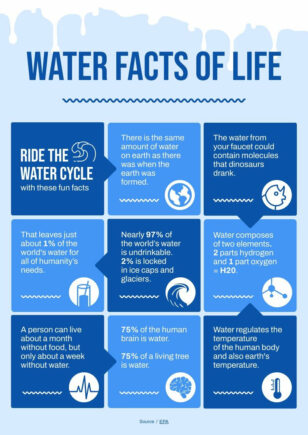
Water Facts of Life
Infographics
Water Facts of Life
 Infographics
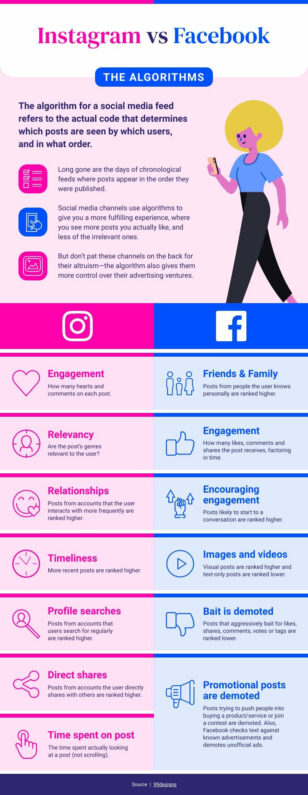
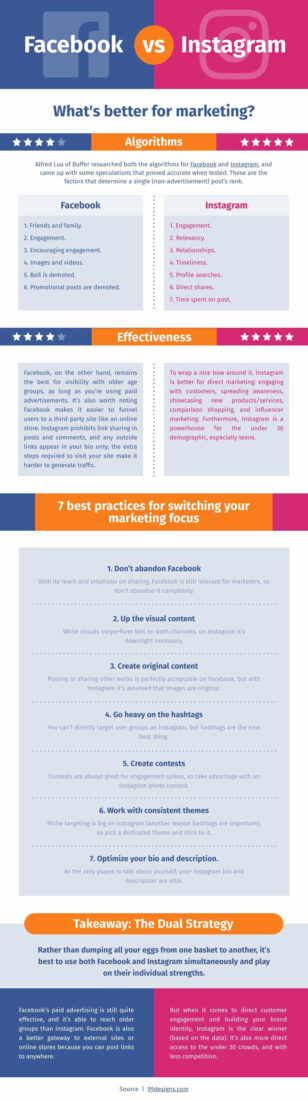
Instagram vs Facebook
Infographics
Instagram vs Facebook
 Infographics
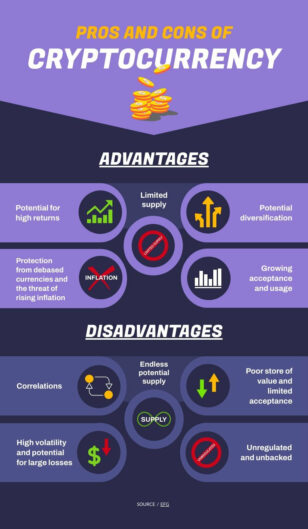
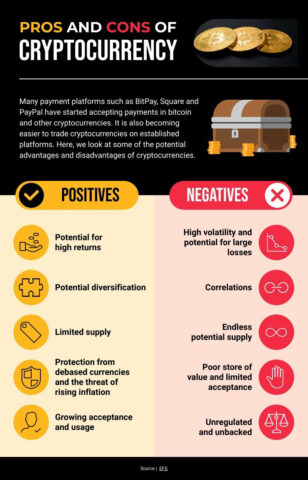
Advantages And Disadvantages Of Cryptocurrency
Infographics
Advantages And Disadvantages Of Cryptocurrency
 Infographics
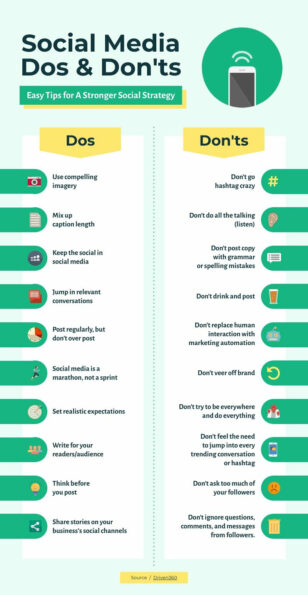
Social Media Marketing Tips
Infographics
Social Media Marketing Tips
 Infographics
Environmental Degradation
Infographics
Environmental Degradation
 Infographics
FB vs Instagram
Infographics
FB vs Instagram
 Infographics
Pros and Cons of Solar Panels
Infographics
Pros and Cons of Solar Panels
 Infographics
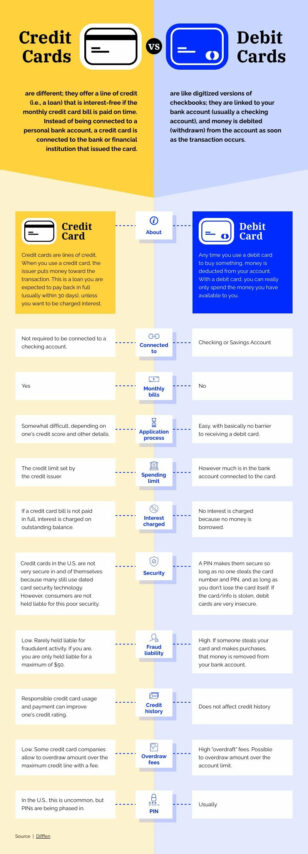
Debit vs Credit
Infographics
Debit vs Credit
 Infographics
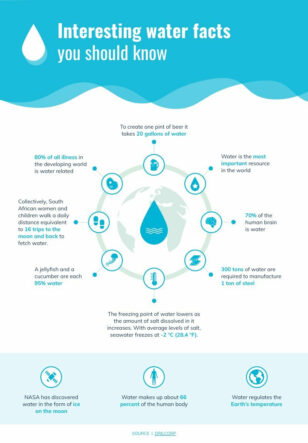
Fun Facts About Water
Infographics
Fun Facts About Water
 Infographics
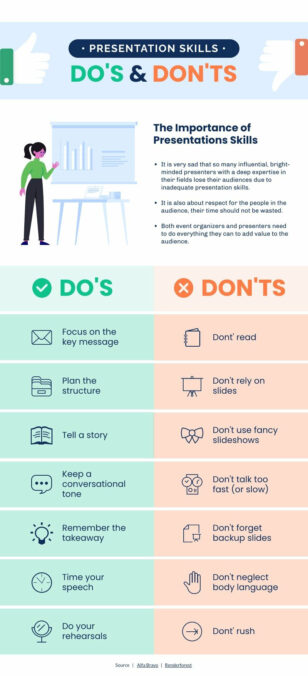
Presentation Tips
Infographics
Presentation Tips
 Infographics
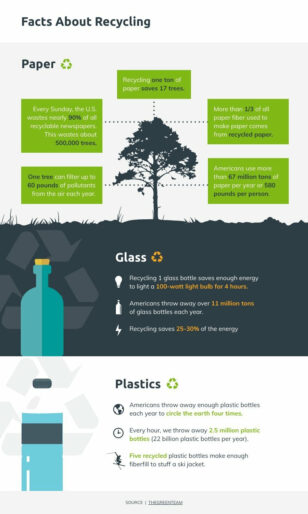
Recycling Facts
Infographics
Recycling Facts
 Infographics
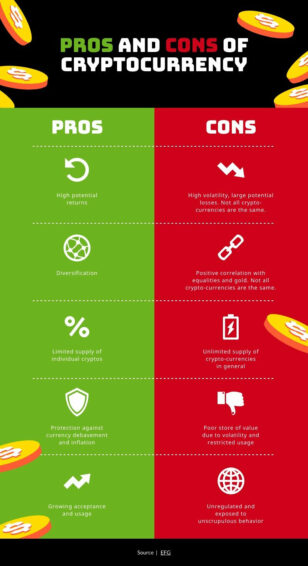
Pros and Cons of Cryptocurrency
Infographics
Pros and Cons of Cryptocurrency
 Infographics
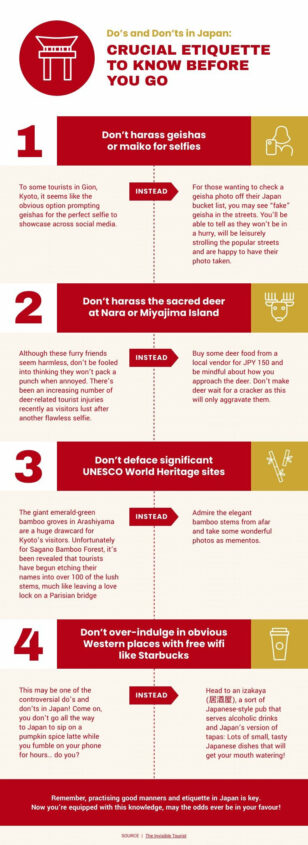
Japanese Etiquettes
Infographics
Japanese Etiquettes
 Infographics
Effective Communication Presentation
Infographics
Effective Communication Presentation
 Infographics
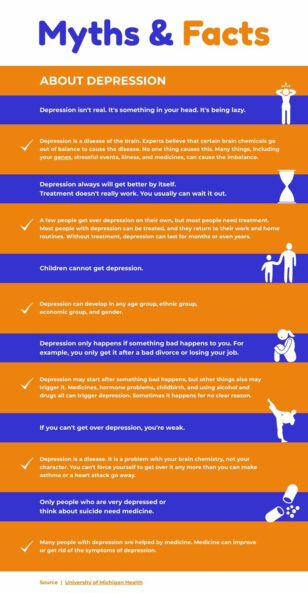
Myths and Facts About Depression
Infographics
Myths and Facts About Depression
 Infographics
Advantages and Disadvantages of Solar Energy
Infographics
Advantages and Disadvantages of Solar Energy
 Infographics
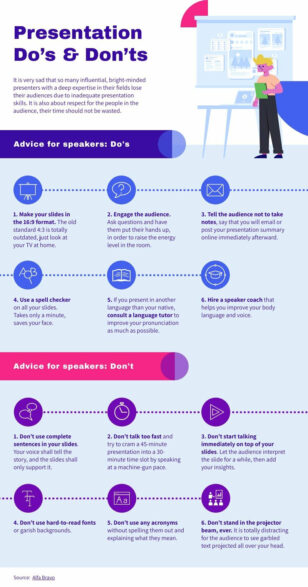
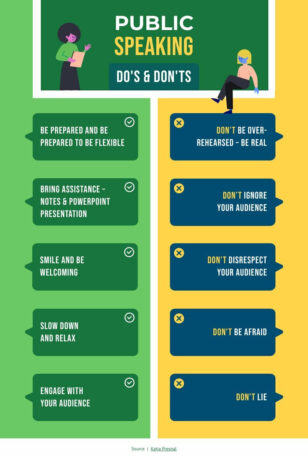
Tips for Public Speaking
Infographics
Tips for Public Speaking
 Infographics
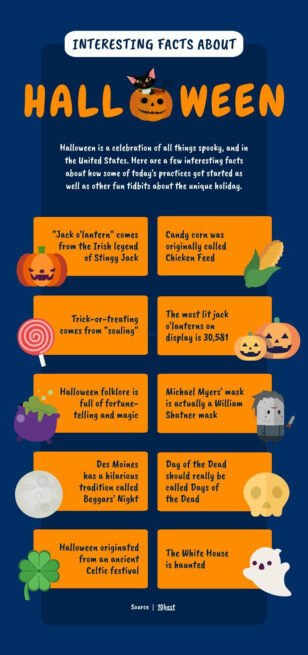
Halloween Facts
Infographics
Halloween Facts
 Infographics
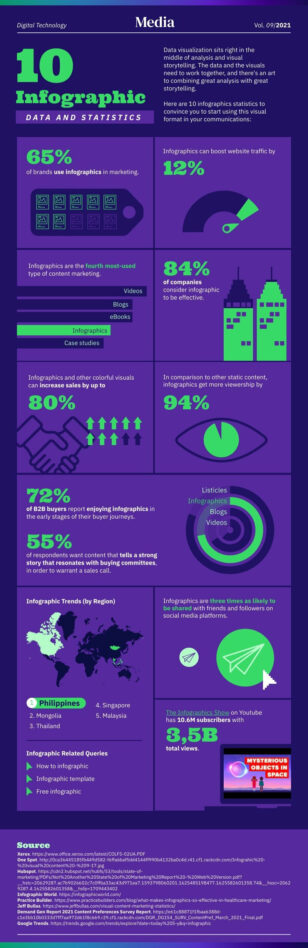
Statistical Infographic
Infographics
Statistical Infographic
 Infographics
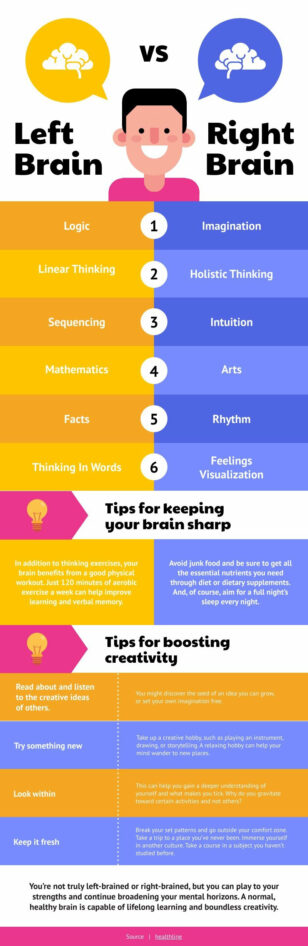
Left Brain vs Right Brain
Infographics
Left Brain vs Right Brain
 Infographics
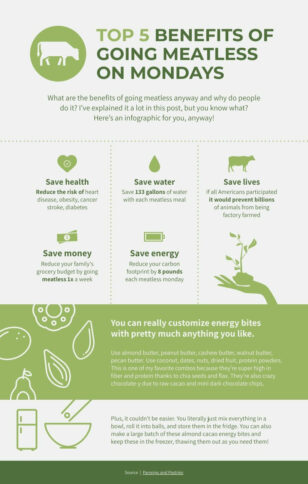
Meatless Mondays
Infographics
Meatless Mondays
 Infographics
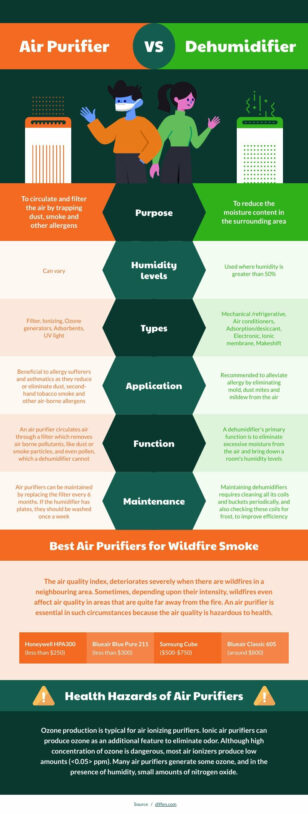
Air Purifier vs Dehumidifier
Infographics
Air Purifier vs Dehumidifier
 Infographics
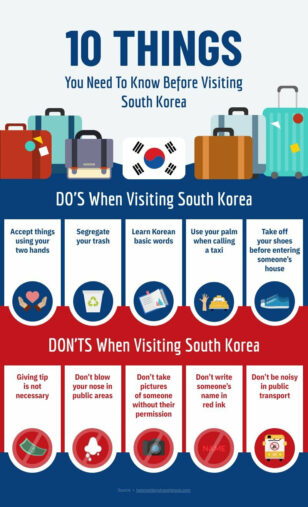
Do’s and Don’ts in South Korea
Infographics
Do’s and Don’ts in South Korea
 Infographics
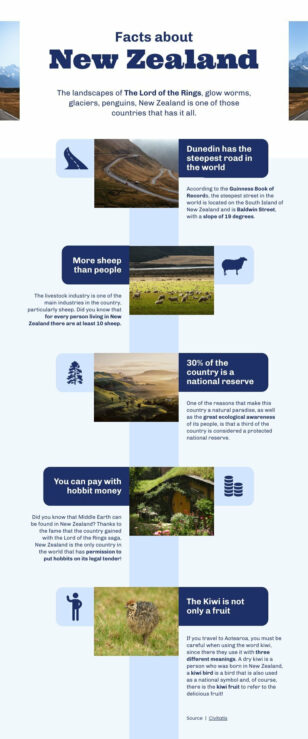
Facts About New Zealand
Infographics
Facts About New Zealand
 Infographics
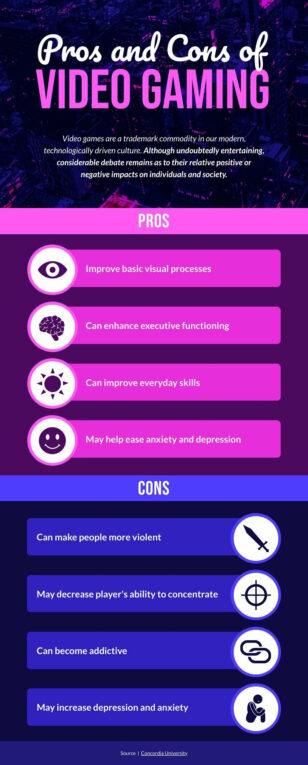
Pros and Cons of Video Gaming
Infographics
Pros and Cons of Video Gaming
 Infographics
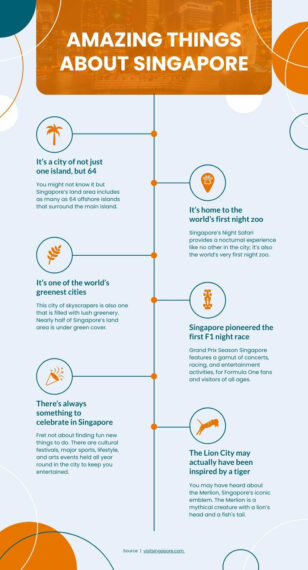
Facts about Singapore
Infographics
Facts about Singapore
 Infographics
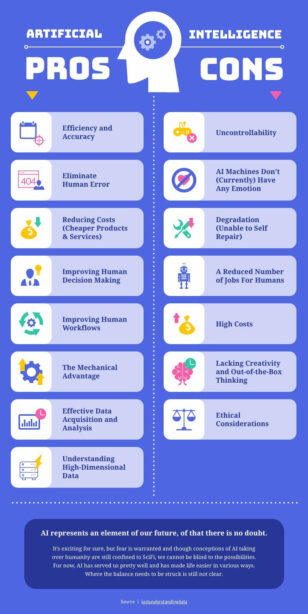
Advantages and Disadvantages of Artificial Intelligence
Infographics
Advantages and Disadvantages of Artificial Intelligence
 Infographics
Benefits of Cryptocurrency
Infographics
Benefits of Cryptocurrency
 Infographics
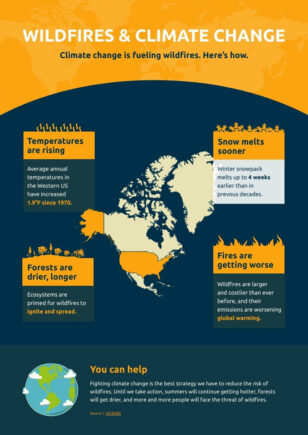
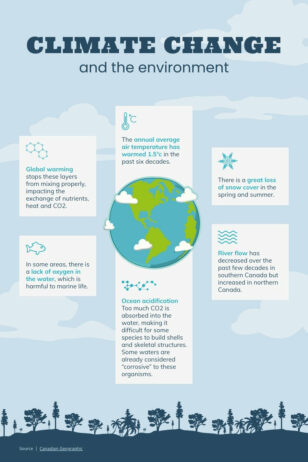
Climate Change and the Environment
Infographics
Climate Change and the Environment
 Infographics
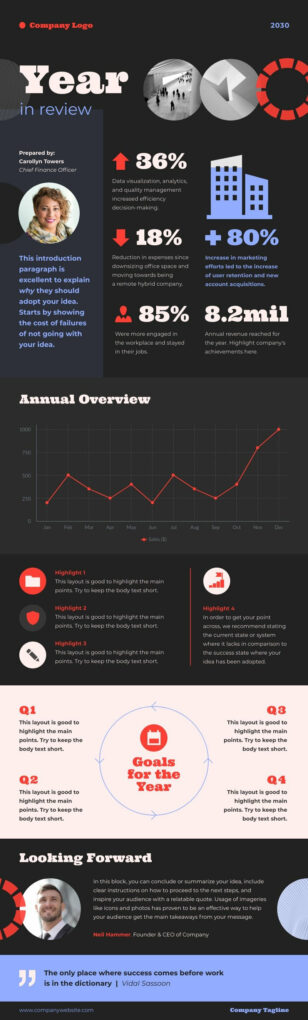
Year In Review
Infographics
Year In Review
 Infographics
Halloween Fun Facts
Infographics
Halloween Fun Facts
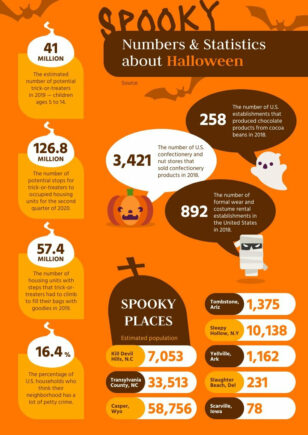 Infographics
Halloween Statistics and Numbers
Infographics
Halloween Statistics and Numbers
 Infographics
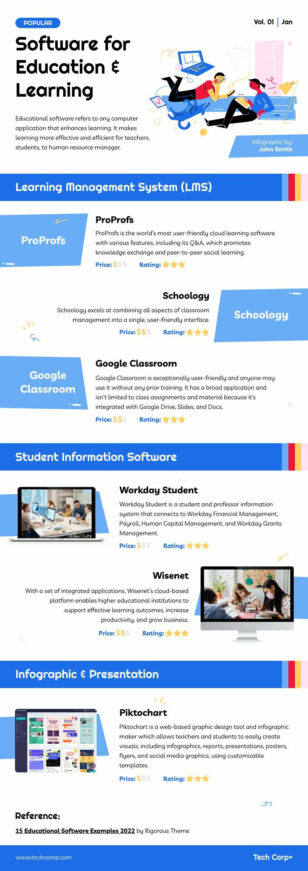
Education Software List
Infographics
Education Software List
 Infographics
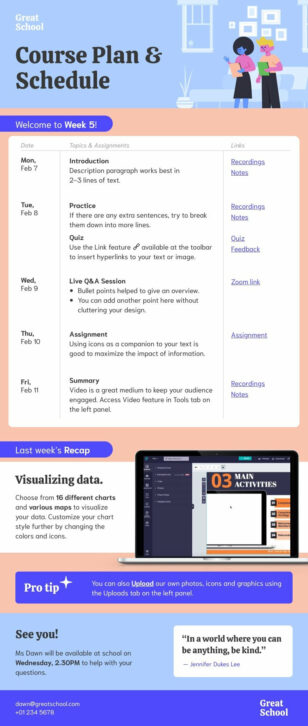
Course Plan & Schedule
Infographics
Course Plan & Schedule
 Infographics
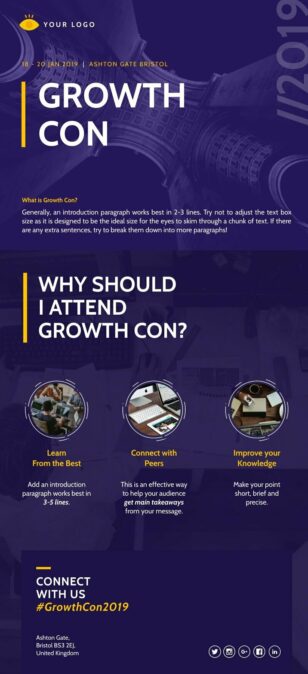
Workshop Invitation
Infographics
Course Plan & Schedule
Infographics
Workshop Invitation
Infographics
Course Plan & Schedule
 Infographics
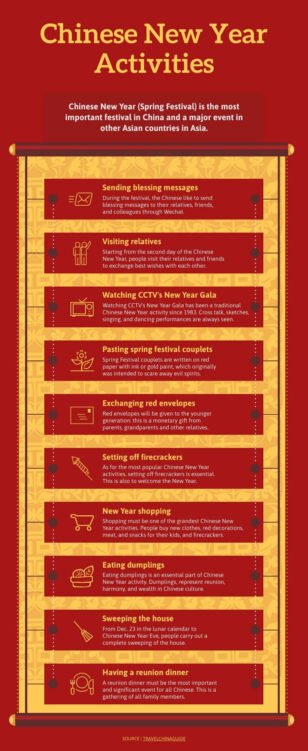
Chinese New Year Activities
Infographics
Chinese New Year Activities
 Infographics
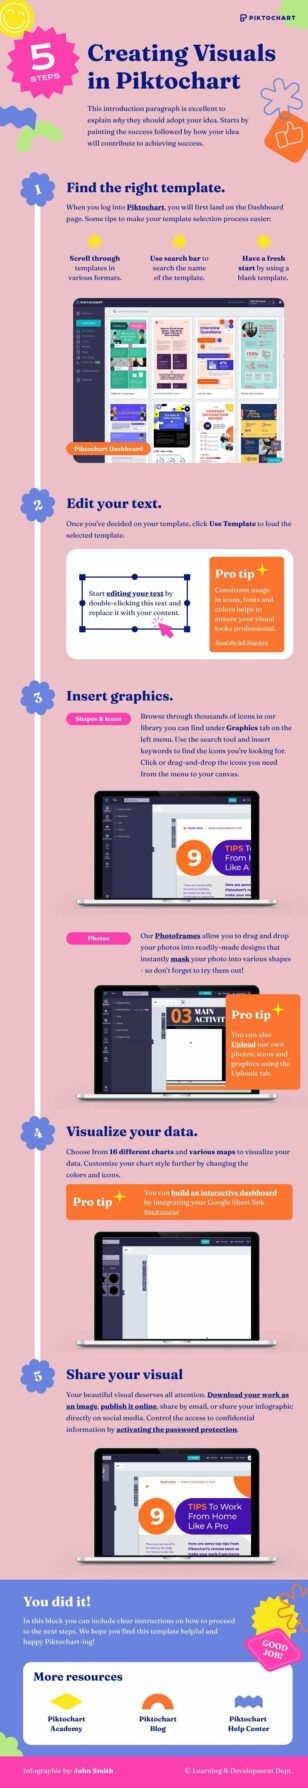
Creating Visuals in 5 Steps
Infographics
Creating Visuals in 5 Steps
 Infographics
Women in History
Infographics
Women in History
 Infographics
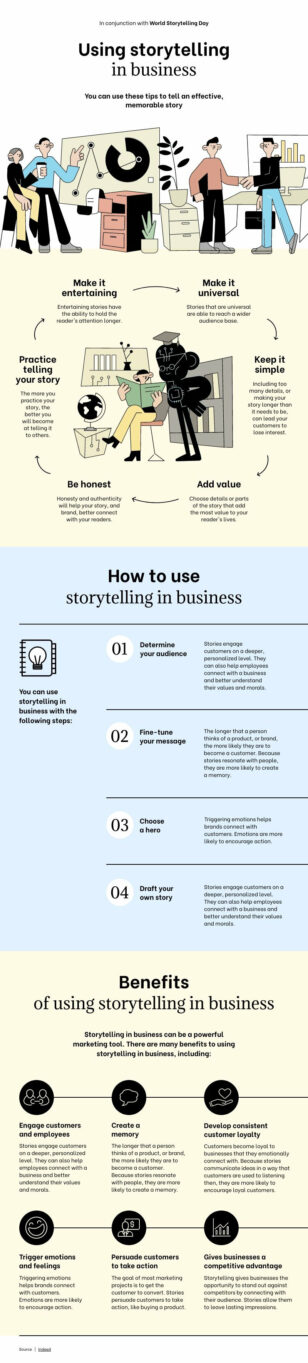
Storytelling In Business
Infographics
Storytelling In Business
 Infographics
Business Storytelling Tips
Infographics
Business Storytelling Tips
 Infographics
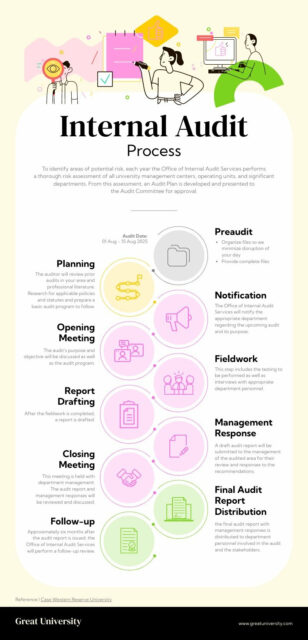
Internal Audit Process
Infographics
Internal Audit Process
 Infographics
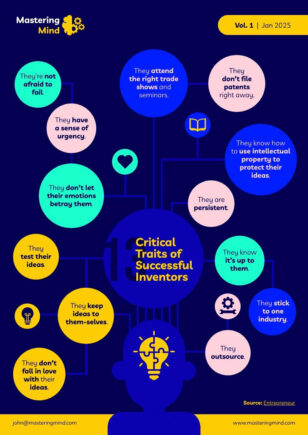
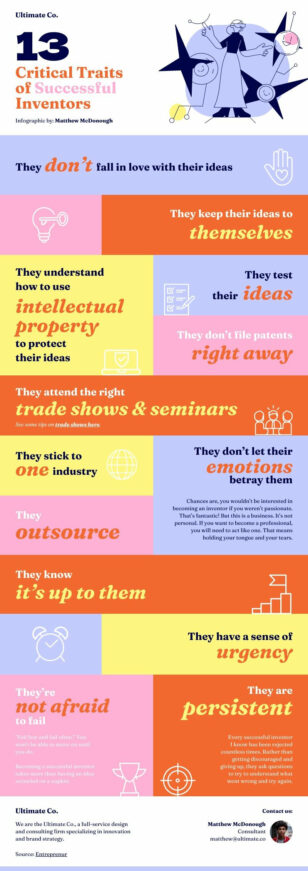
Critical Traits of Successful Inventors
Infographics
Critical Traits of Successful Inventors
 Infographics
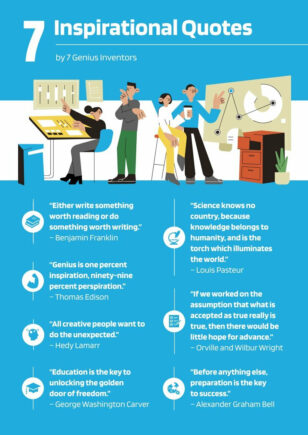
Inspirational Quotes By Inventors
Infographics
Inspirational Quotes By Inventors
 Infographics
Personality Traits of Successful Inventors
Infographics
Personality Traits of Successful Inventors
 Infographics
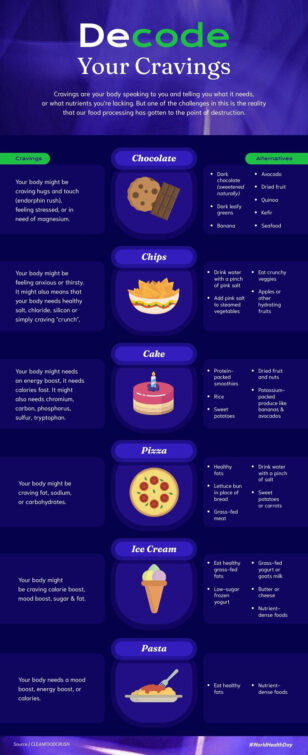
Decode Your Cravings
Infographics
Decode Your Cravings
 Infographics
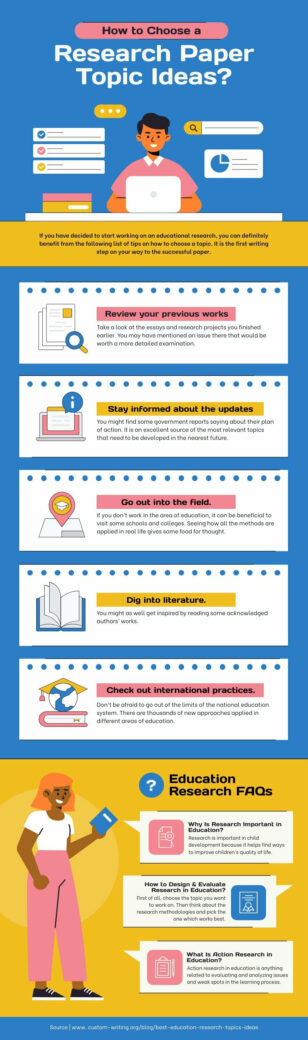
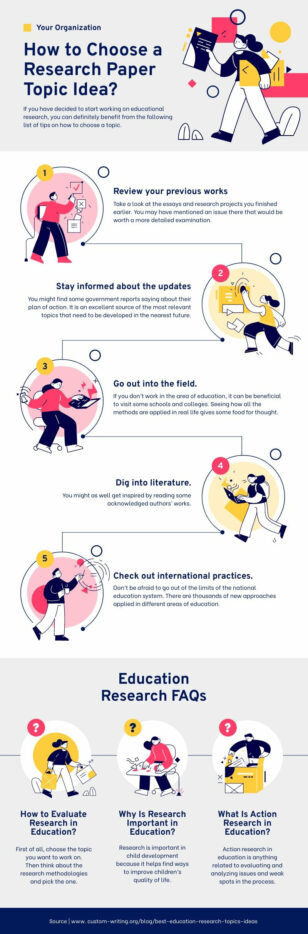
How to Choose a Research Paper Topic Ideas?
Infographics
How to Choose a Research Paper Topic Ideas?
 Infographics
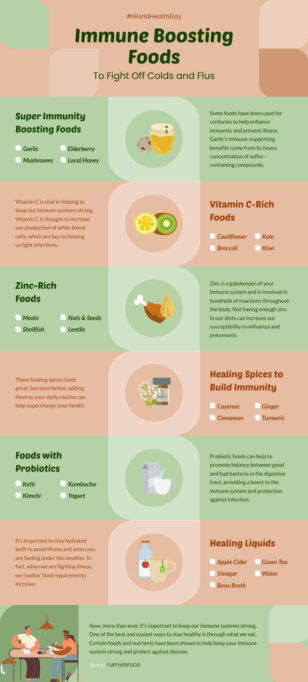
Immune-Boosting Foods
Infographics
Immune-Boosting Foods
 Infographics
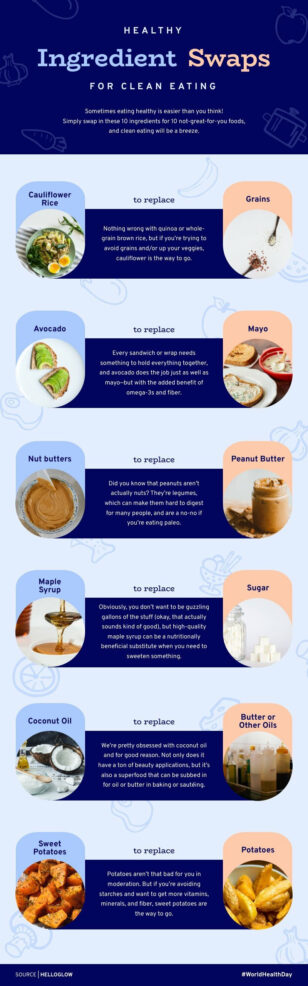
Healthy Ingredient Swaps
Infographics
Healthy Ingredient Swaps
 Infographics
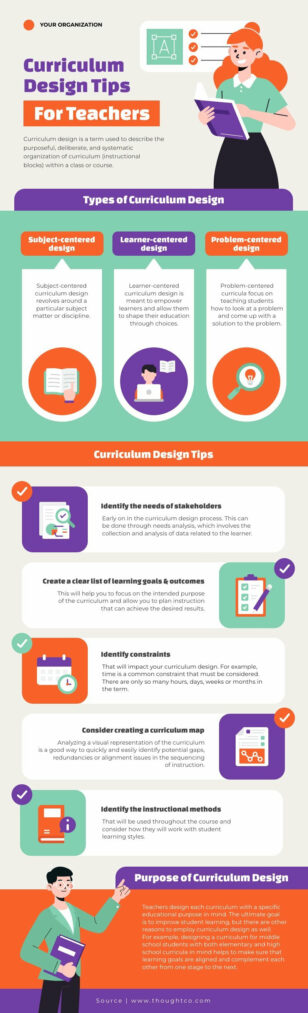
Curriculum Design Tips for Teachers
Infographics
Curriculum Design Tips for Teachers
 Infographics
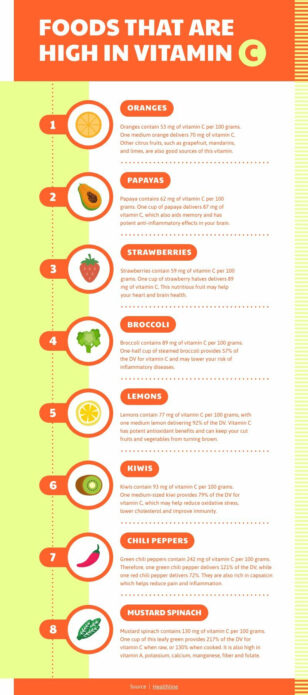
Foods That Are High in Vitamin C
Infographics
Foods That Are High in Vitamin C
 Infographics
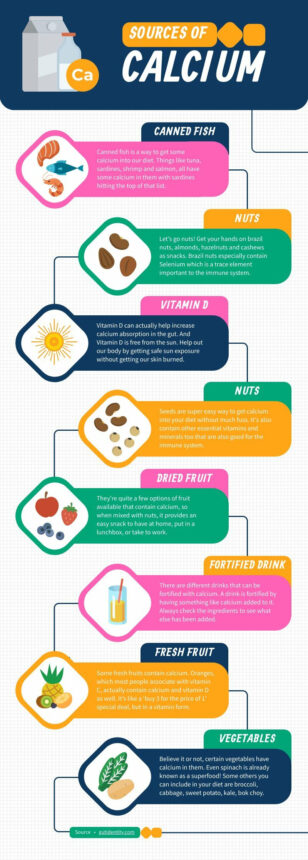
Sources of Calcium
Infographics
Sources of Calcium
 Infographics
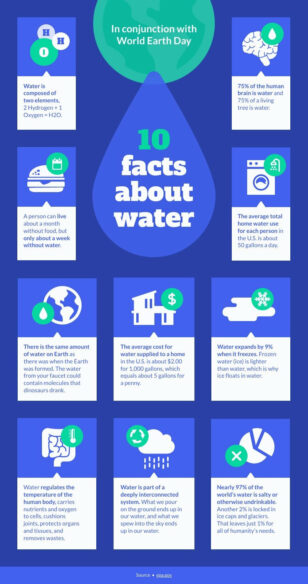
10 Facts About Water
Infographics
10 Facts About Water
 Infographics
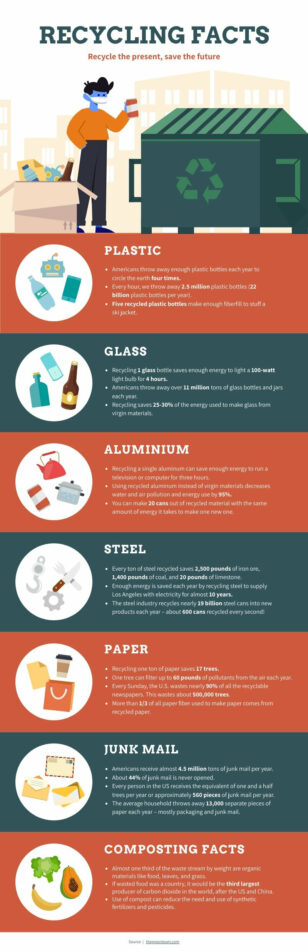
Interesting Recycling Facts
Infographics
Interesting Recycling Facts
 Infographics
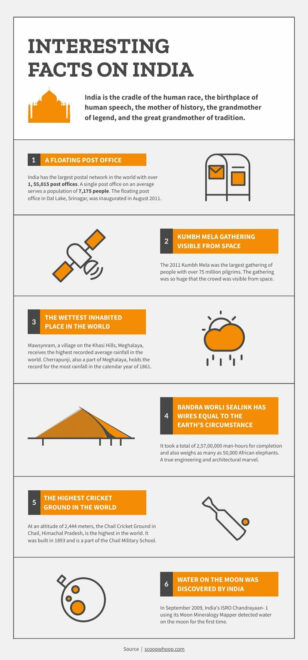
Interesting Facts on India
Infographics
Interesting Facts on India
 Infographics
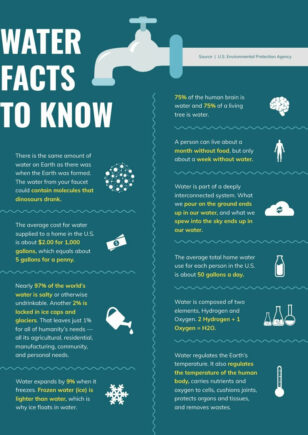
Water Facts to Know
Infographics
Water Facts to Know
 Infographics
Useful Tips for Delivering a Great Speech
Infographics
Useful Tips for Delivering a Great Speech
 Infographics
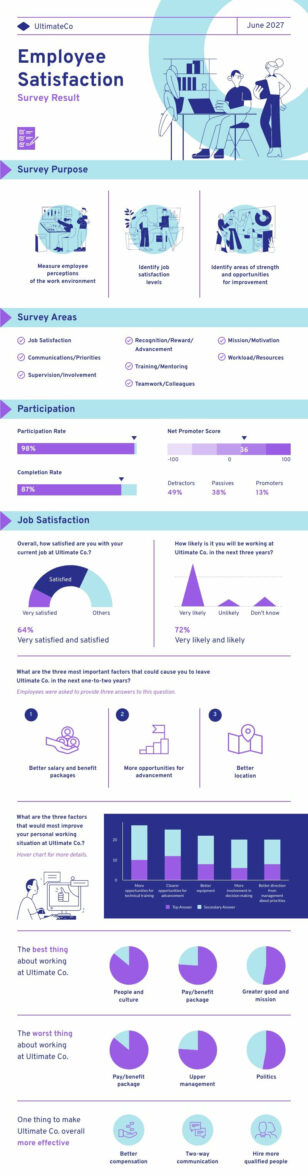
Employee Satisfaction Survey Result
Infographics
Employee Satisfaction Survey Result
 Infographics
How to Choose a Research Paper Topic Idea?
Infographics
How to Choose a Research Paper Topic Idea?
 Infographics
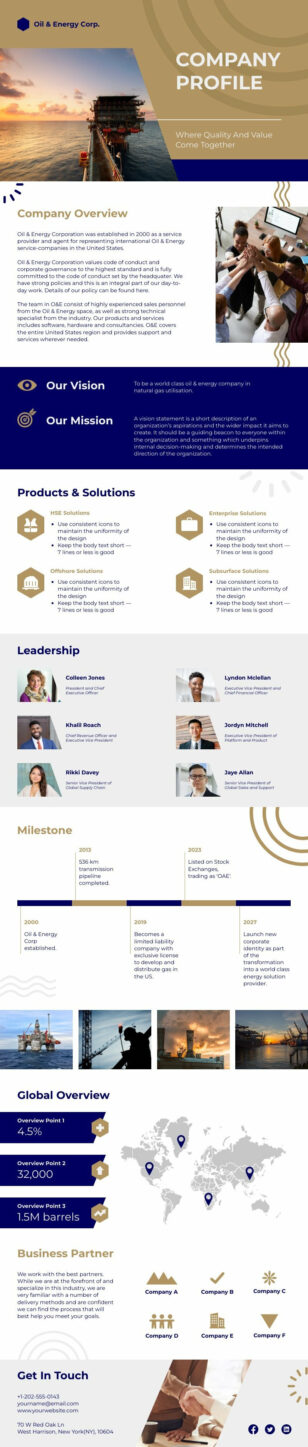
Oil & Energy Business Profile
Infographics
Oil & Energy Business Profile
Simplify Complex Information with Professional Infographics
Infographics are one of the most effective ways to communicate data, processes, and comparisons at a glance. Whether you’re creating a statistical infographic for a blog post, a timeline for a project update, or a comparison chart for a sales deck, starting with a professionally designed template saves hours of layout work.
Piktochart’s infographic templates cover every popular format: statistical, informational, timeline, process, geographic, comparison, and list-based. Each layout is built with visual hierarchy in mind so your audience absorbs the most important points first. Add your own data, swap icons, adjust the color scheme to your brand, and your infographic is ready to publish.
Educators use these templates to create classroom handouts that students actually read. Marketing teams turn quarterly reports into shareable social assets. HR departments visualize onboarding processes so new hires get up to speed faster. The use cases are as varied as the data you need to communicate.
Need an infographic in seconds? Try Piktochart’s AI-powered editor — describe what you need, and get a fully editable starting point instantly.