Employee Satisfaction Survey Result
Infographics
Edit for freeYou'll be asked to log in or sign up for a free Piktochart account first.
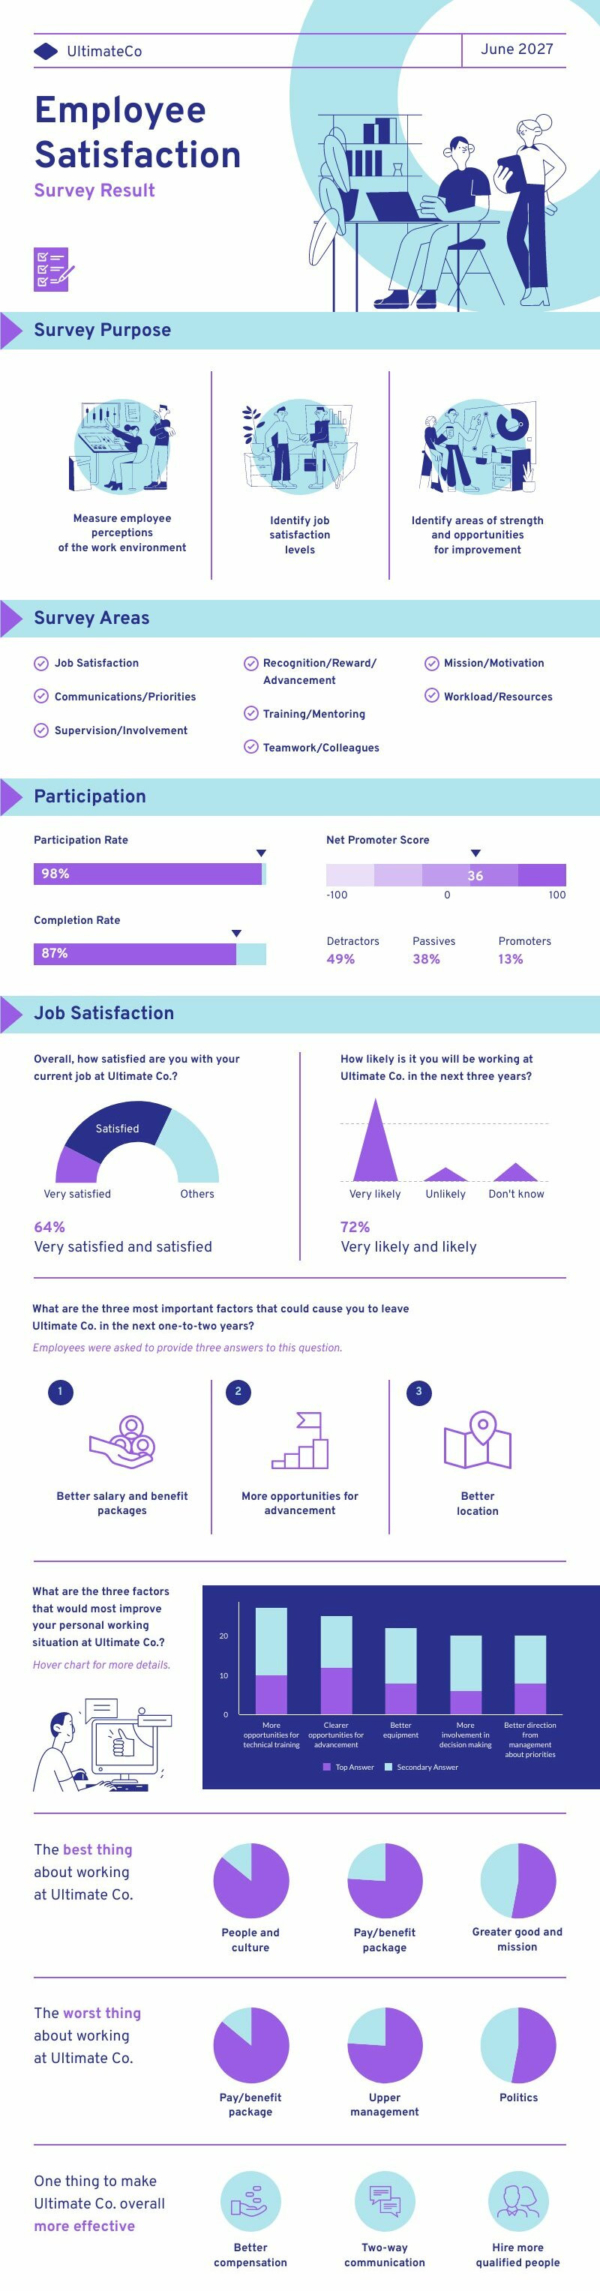
Do you often run employee satisfaction surveys? Create a report with the results for management and the team. This white template with light blue and purple notes looks professional and includes icons and charts to show participation rate, job satisfaction, and many other survey results. Customize it and change the colors to fit your brand.
Available File Type
Customization
100% customizable
Tags
More Templates Like This
 Infographics
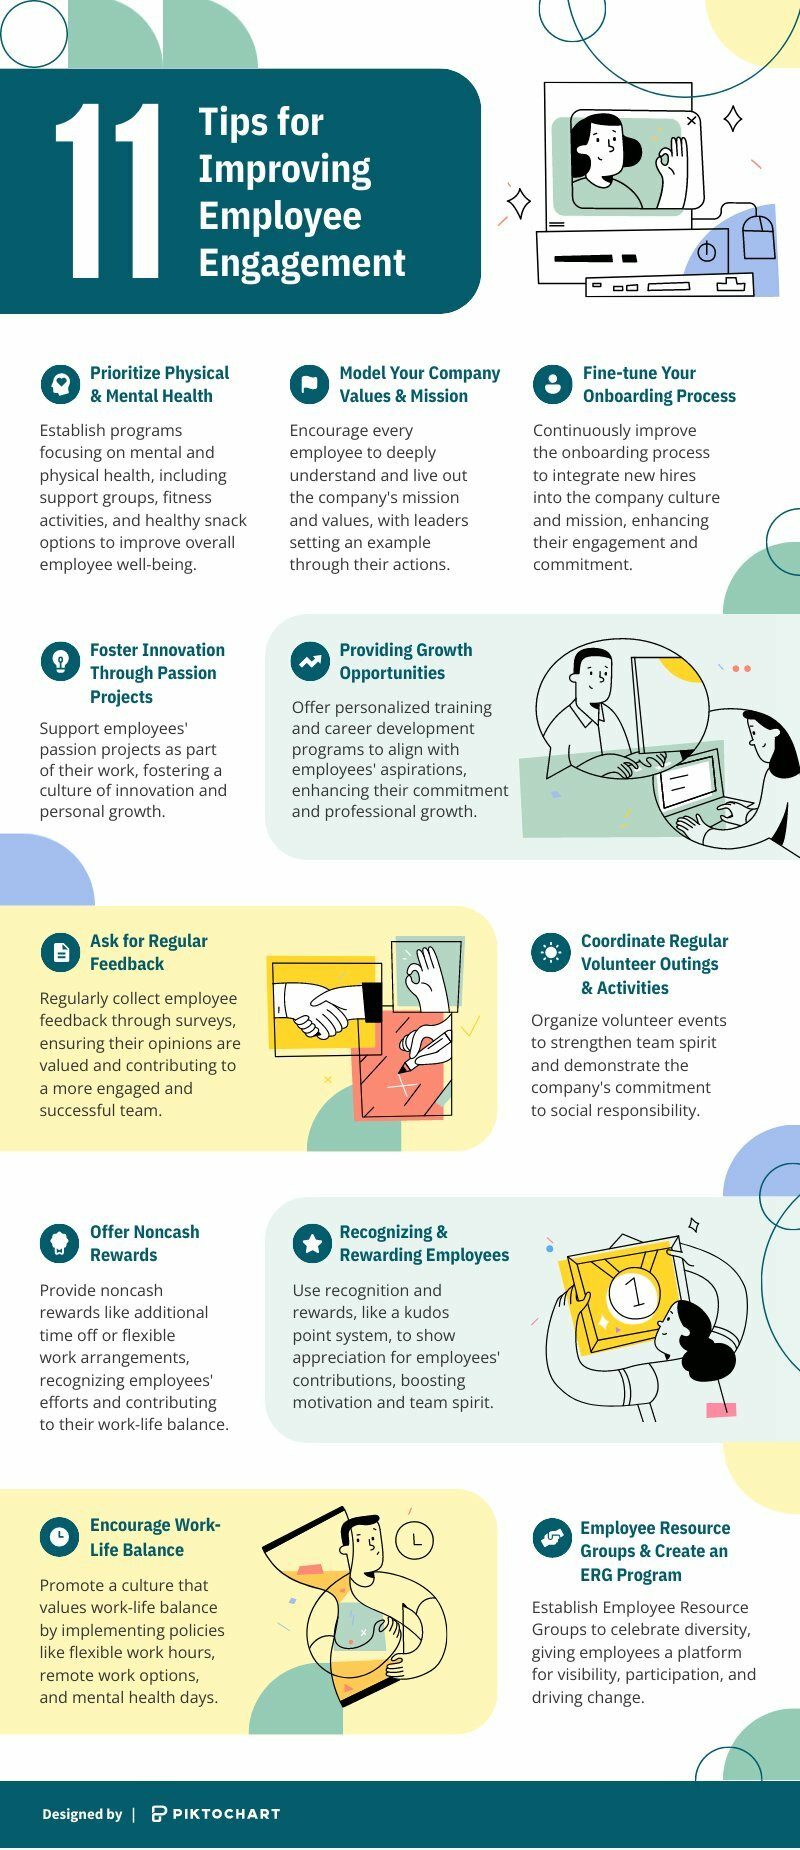
Tips for Improving Employee Engagement
Infographics
Tips for Improving Employee Engagement
 Infographics
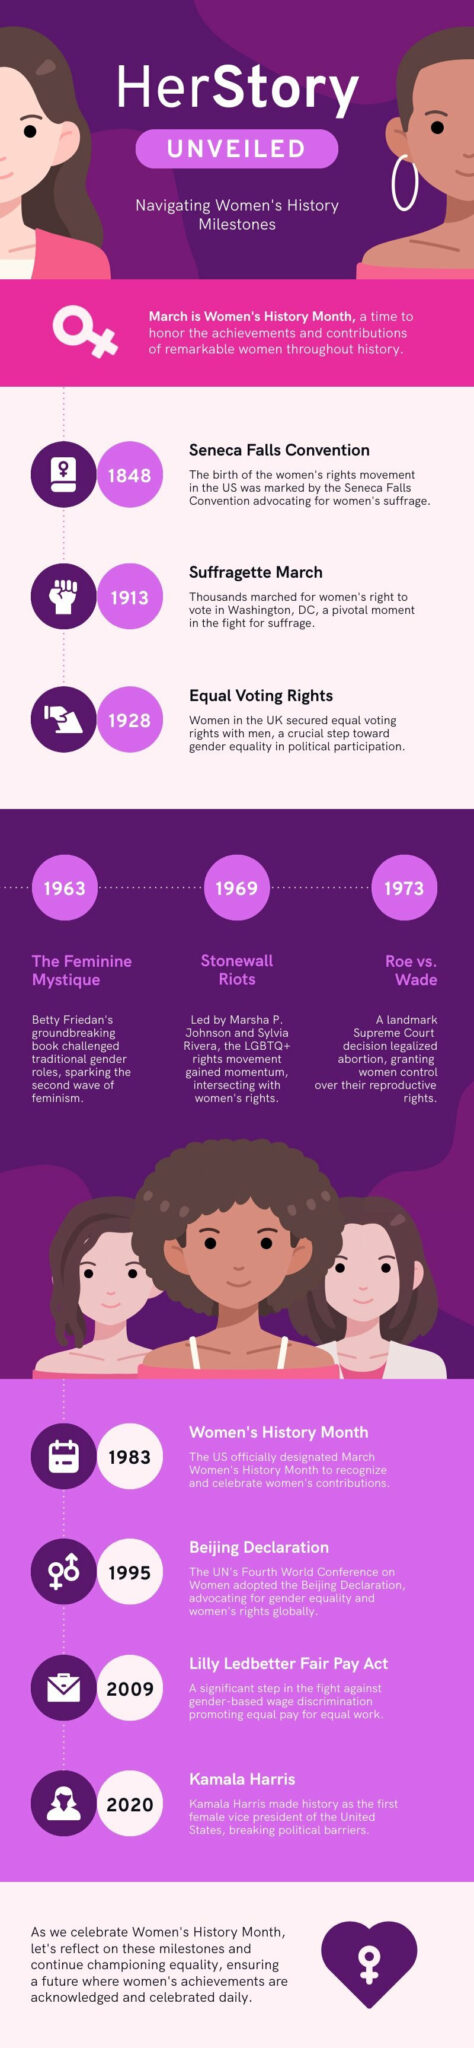
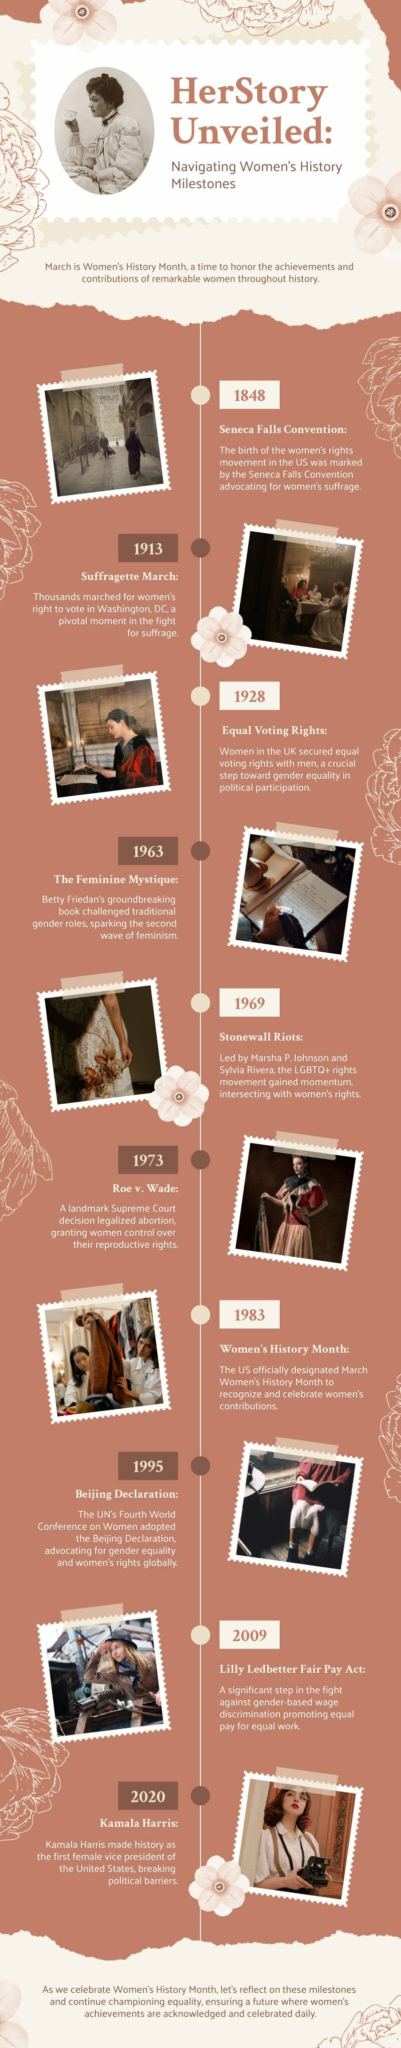
International Women’s Day Infographic
Infographics
International Women’s Day Infographic
 Infographics
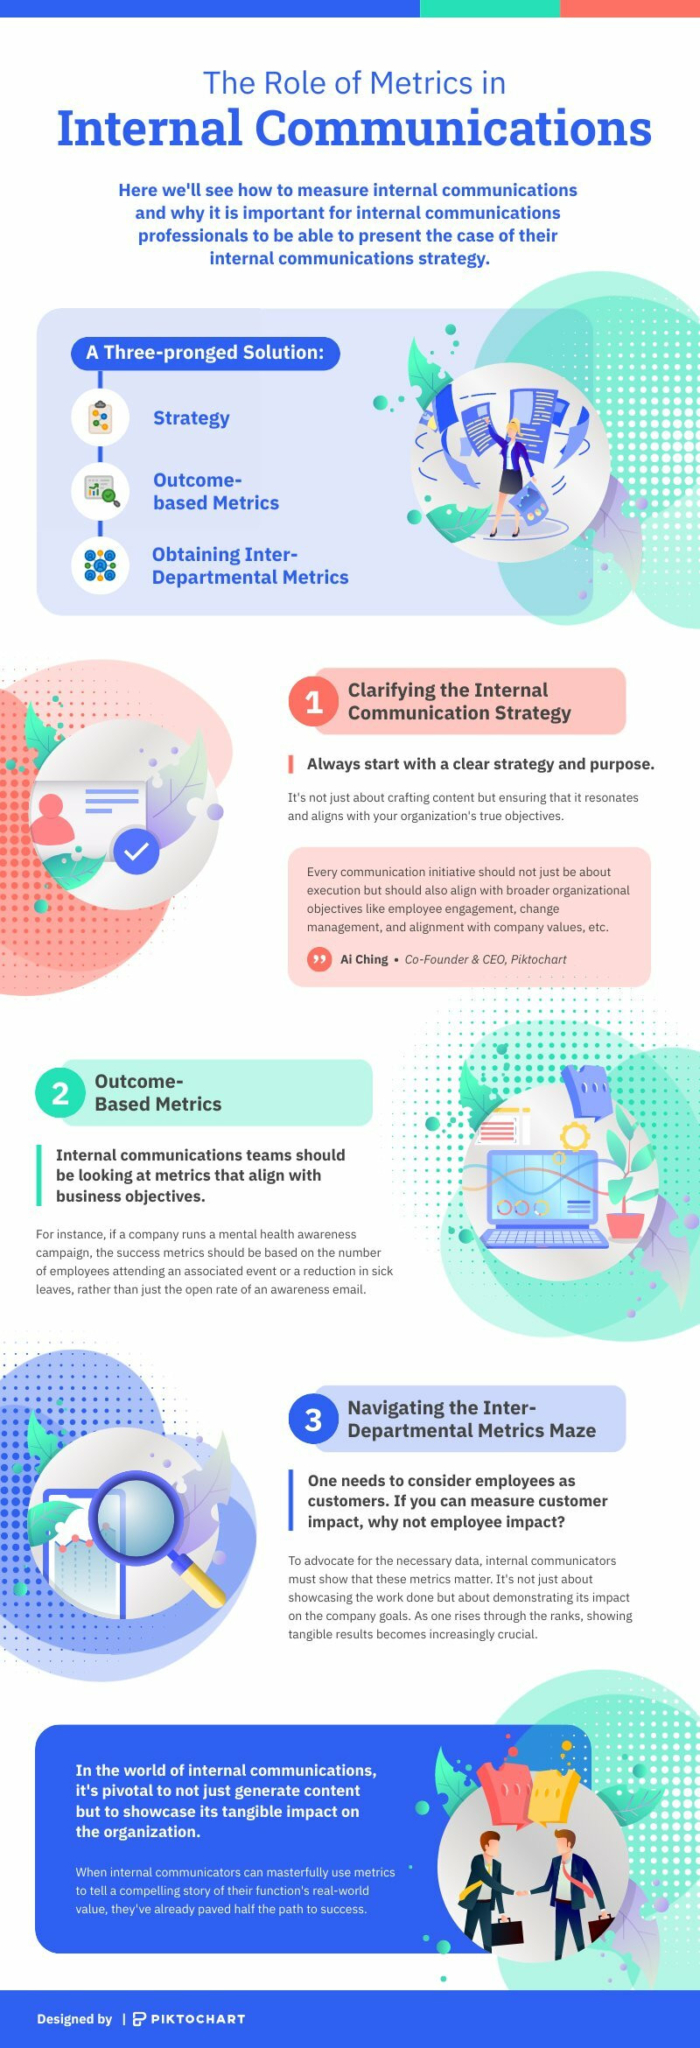
The Role Of Metrics In Internal Communications
Infographics
The Role Of Metrics In Internal Communications
 Infographics
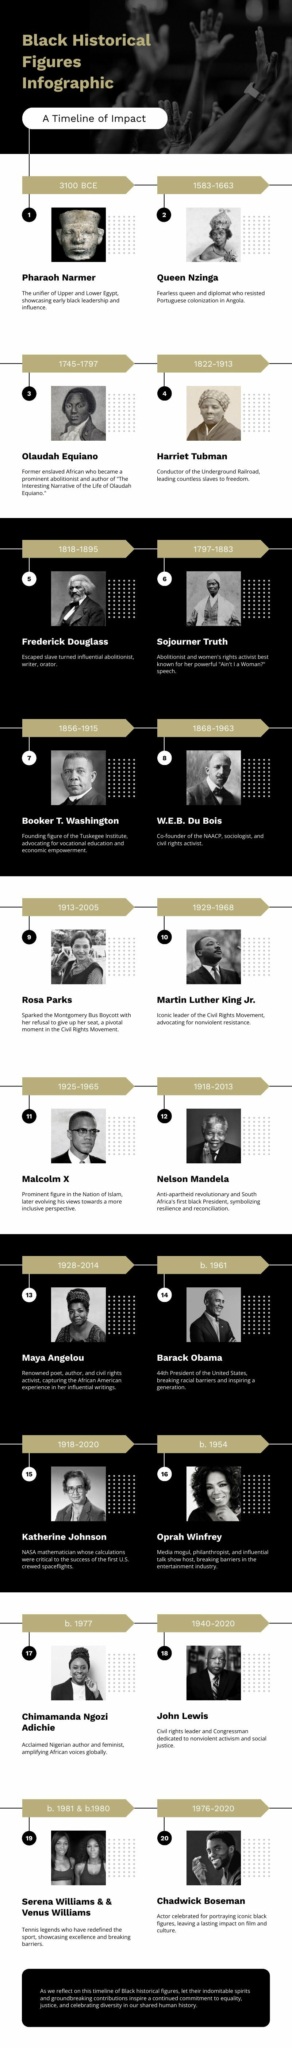
Black Historical Figures Infographic
Infographics
Black Historical Figures Infographic
 Infographics
Facts About Women’s History Month
Infographics
Facts About Women’s History Month
 Infographics
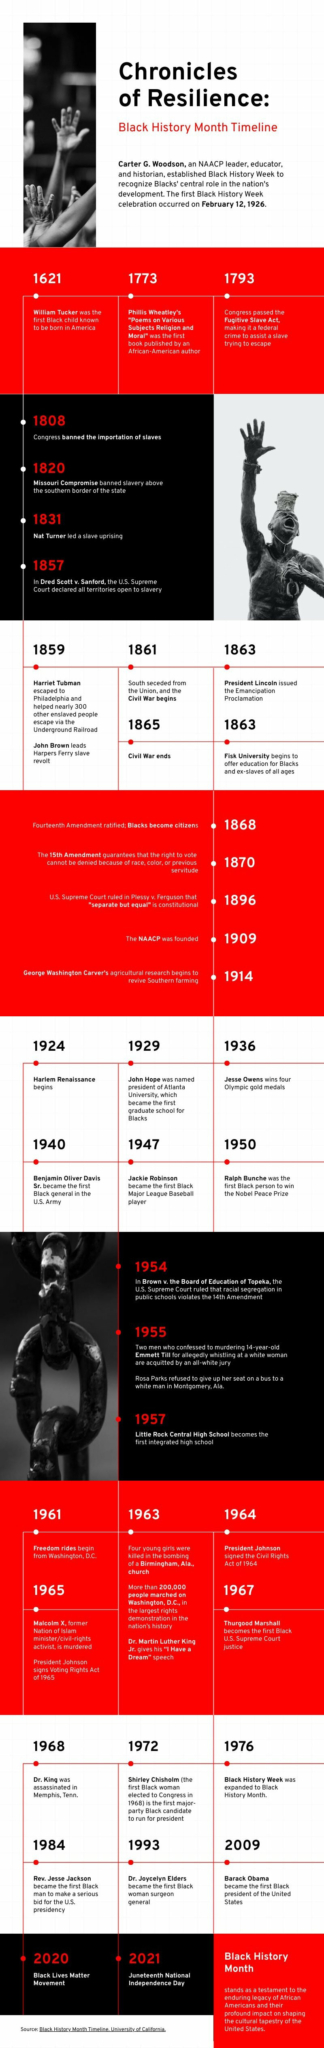
History of Black History Month Infographic
Infographics
History of Black History Month Infographic
 Infographics
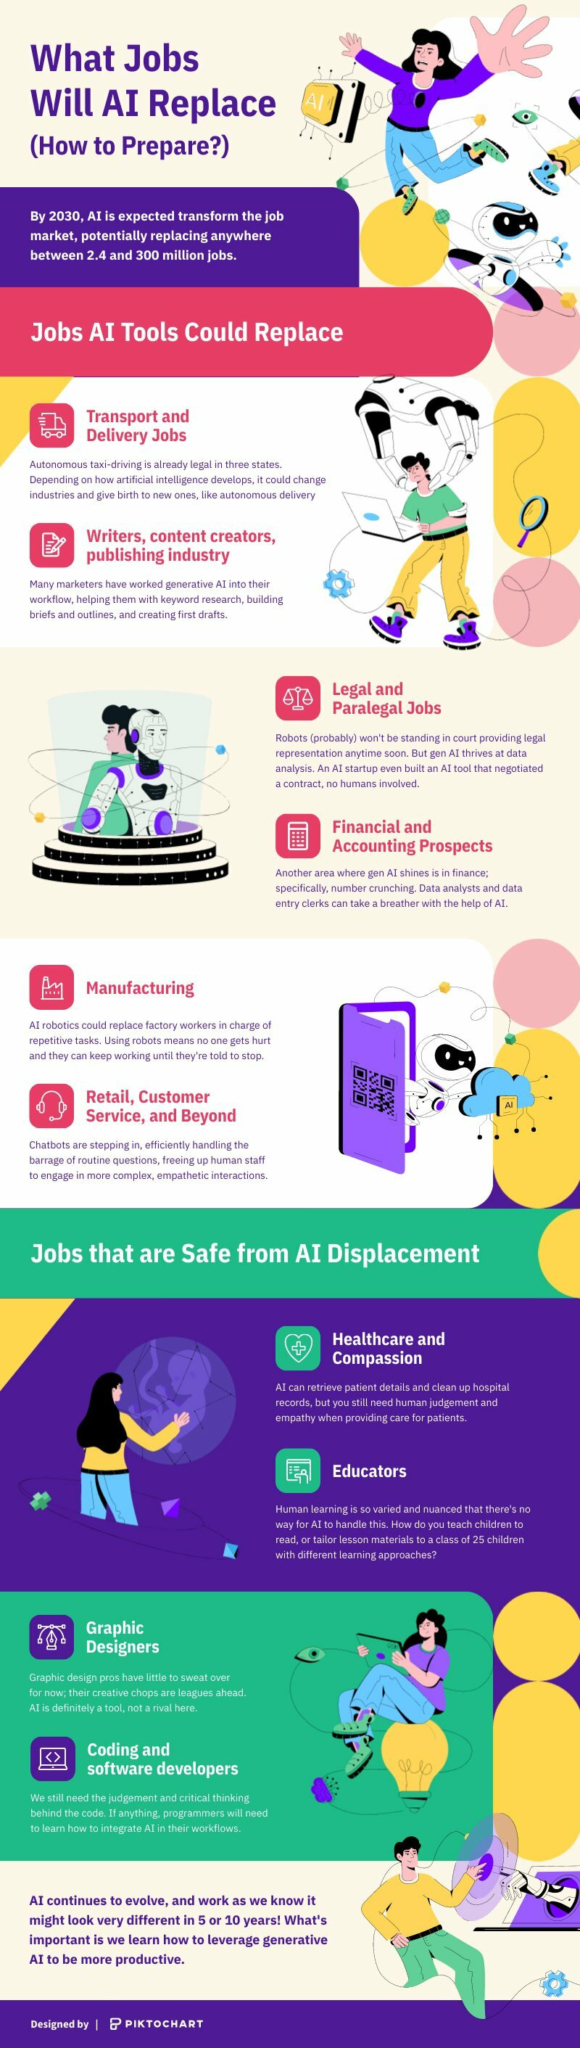
What Jobs Will AI Replace
Infographics
What Jobs Will AI Replace
 Infographics
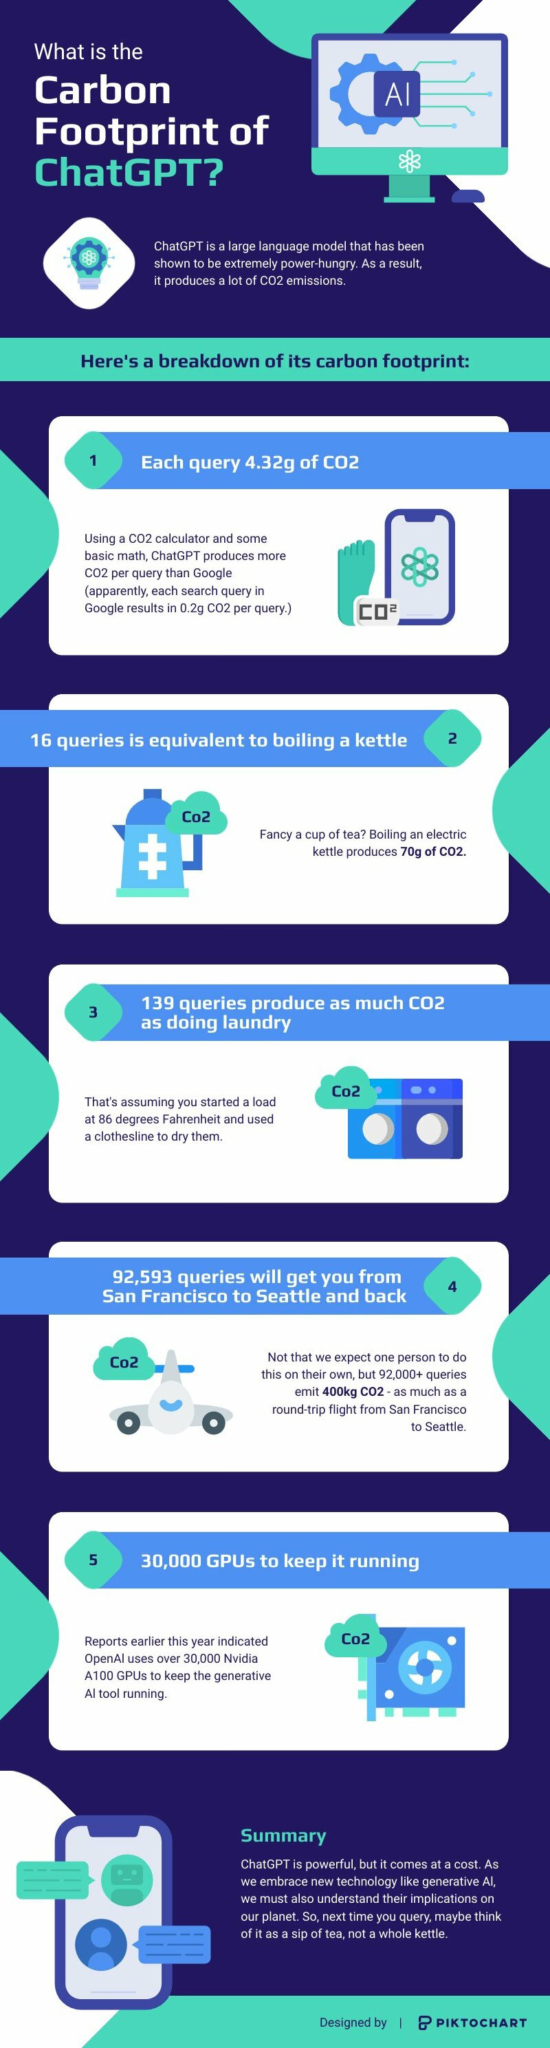
AI Carbon Footprint
Infographics
AI Carbon Footprint
 Infographics
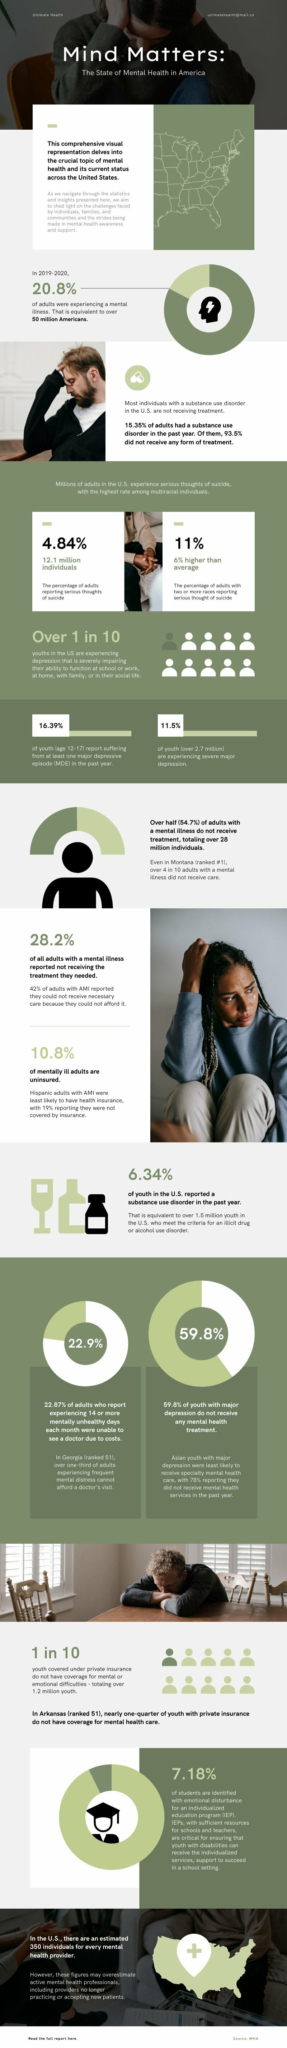
Modern Mental Health Statistics
Infographics
Modern Mental Health Statistics
 Infographics
Artificial Intelligence Statistics
Infographics
Artificial Intelligence Statistics
 Infographics
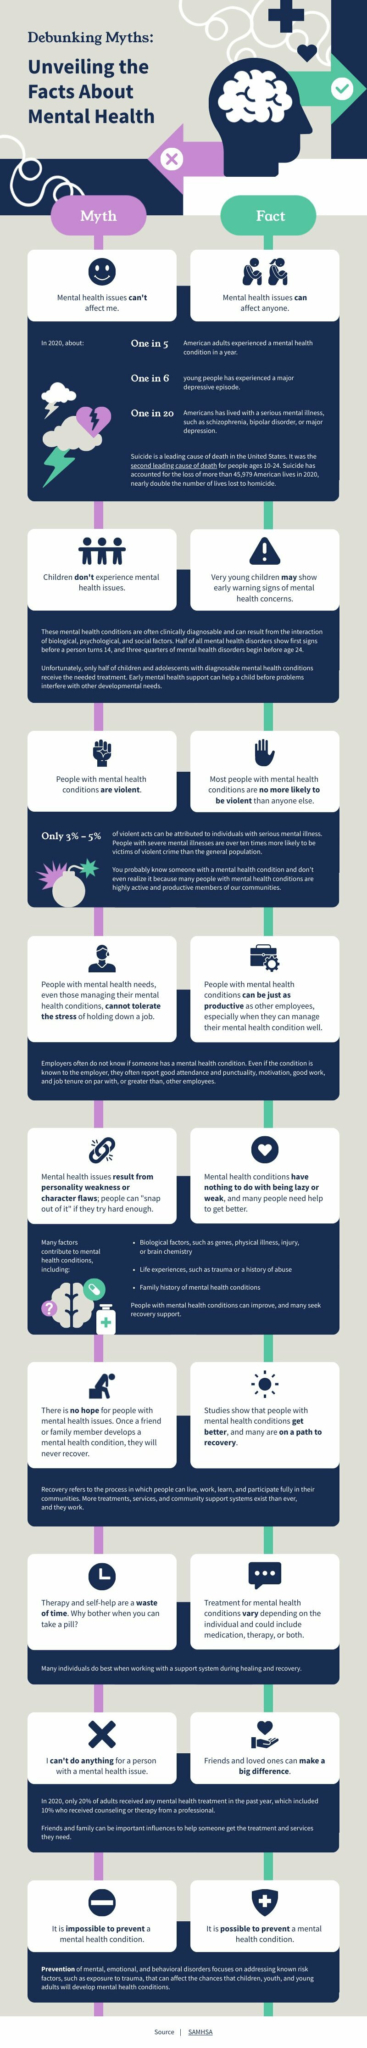
Mental Health Facts
Infographics
Mental Health Facts
 Infographics
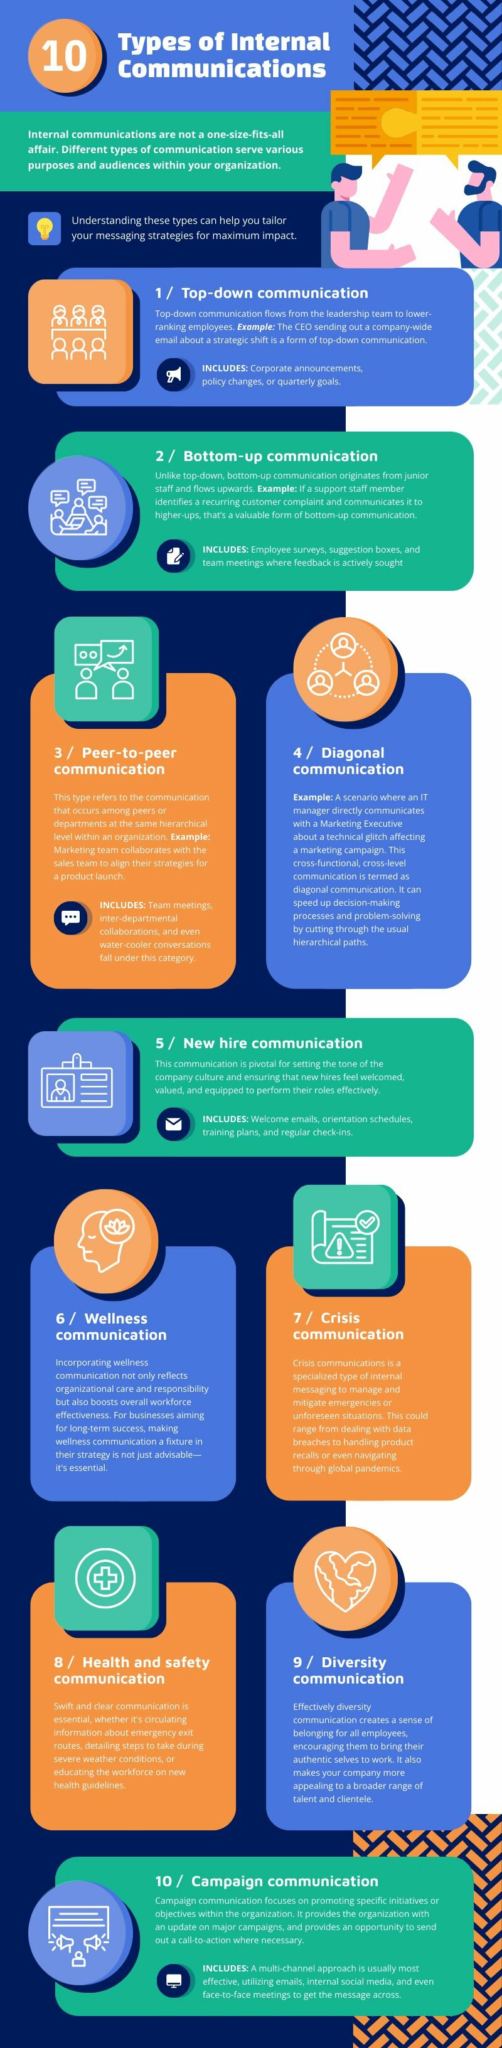
Types of Internal Communications
Infographics
Types of Internal Communications