Piktochart Templates Infographics
Free Infographic Templates
Start with a professionally designed layout, then make it yours. These templates work for one-off explainers and for the infographic you update every quarter — swap your data, match your brand colors, and export as PNG, PDF, or both.
Infographic Templates for Reports, Case Studies, and Team Updates
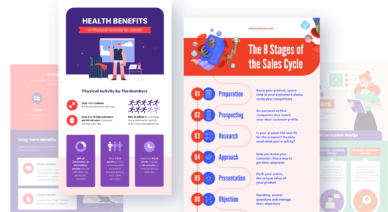
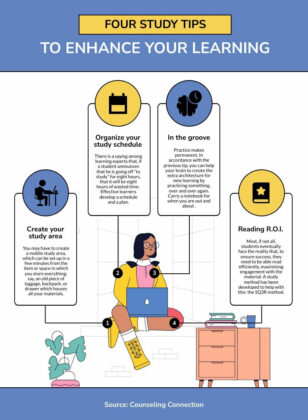 Infographics
Study Tips
Infographics
Study Tips
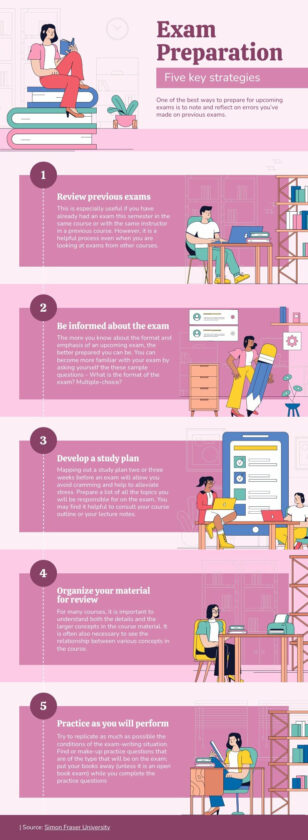 Infographics
Exam Preparation Tips
Infographics
Exam Preparation Tips
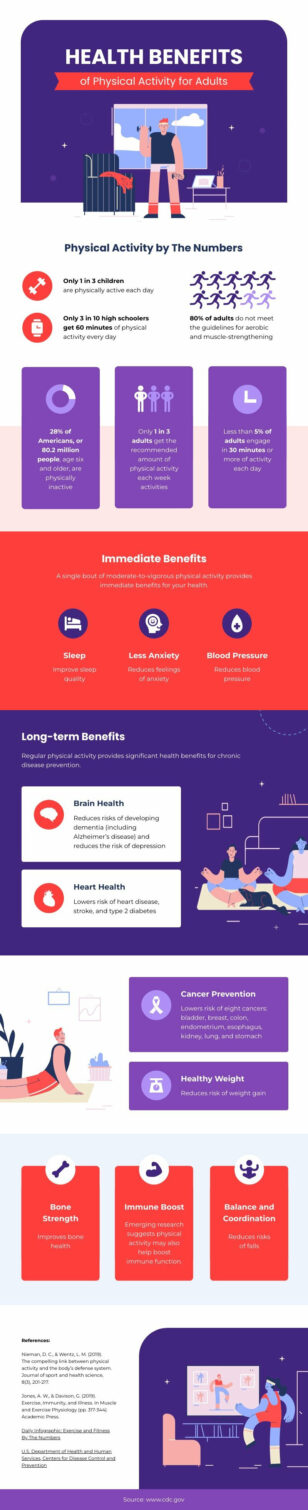 Infographics
Health Benefits of Physical Activity
Infographics
Health Benefits of Physical Activity
 Infographics
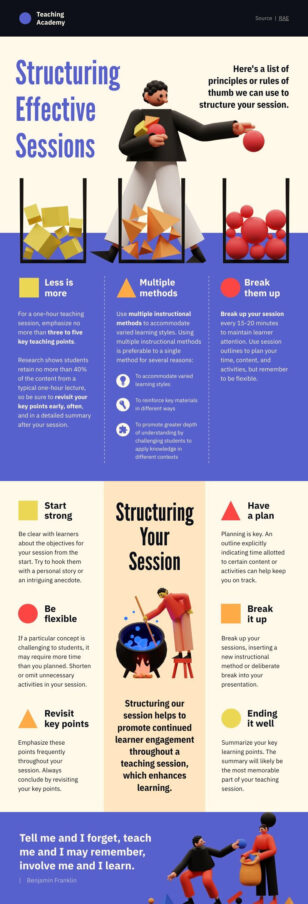
The Teacher’s Guide
Infographics
The Teacher’s Guide
 Infographics
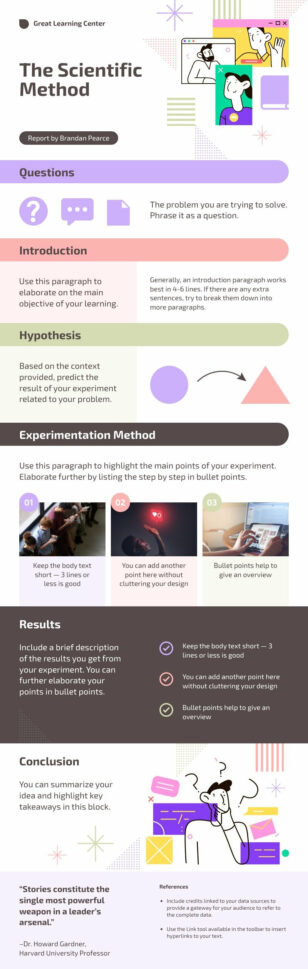
The Scientific Method
Infographics
The Scientific Method
 Infographics
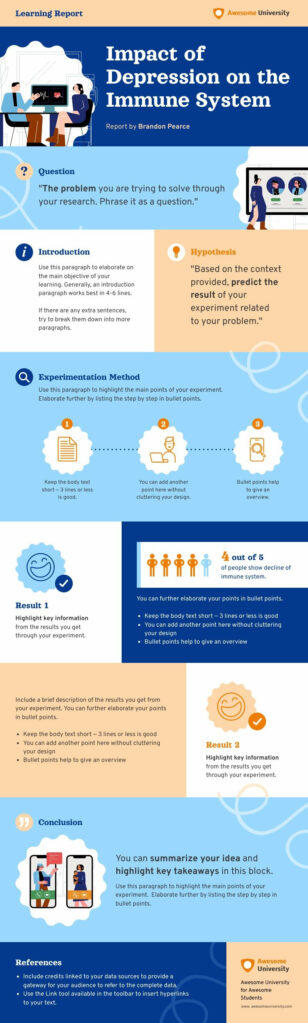
Impact of Depression on the Immune System Experiment Report
Infographics
Impact of Depression on the Immune System Experiment Report
 Infographics
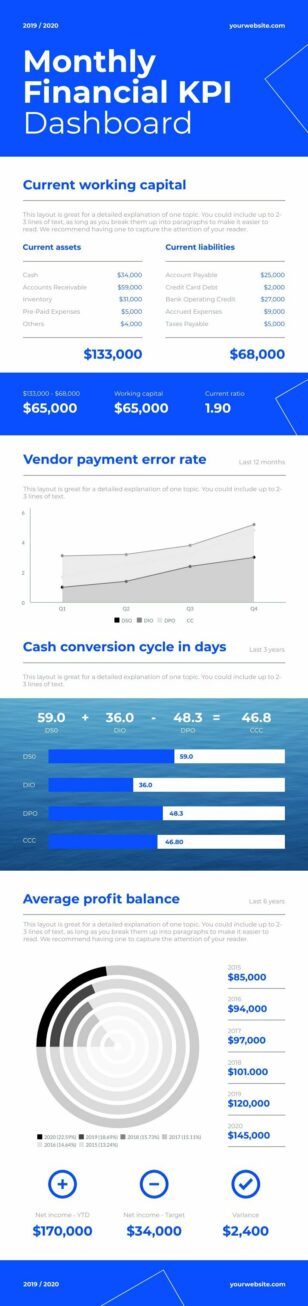
Financial KPI Dashboard
Infographics
Financial KPI Dashboard
 Infographics
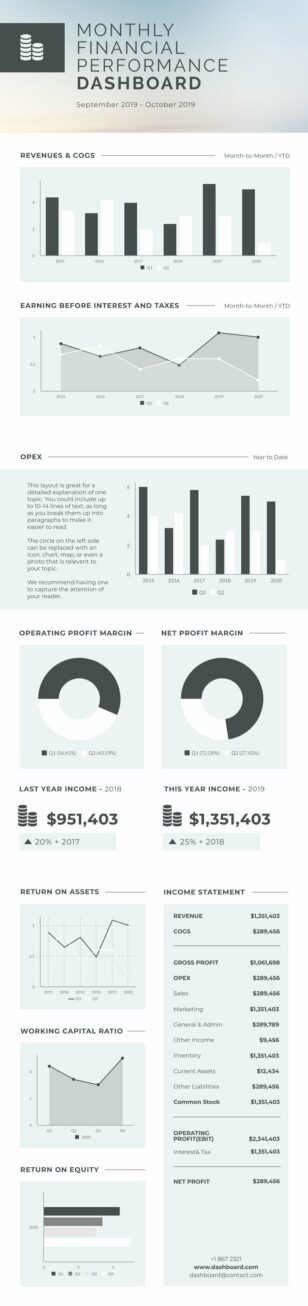
Financial Dashboard
Infographics
Financial Dashboard
 Infographics
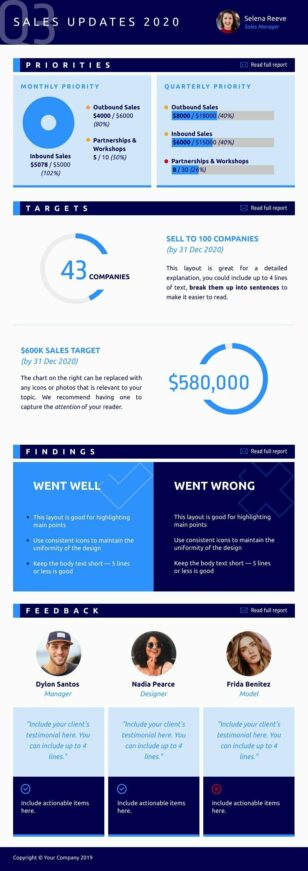
Quarterly Sales
Infographics
Quarterly Sales
 Infographics
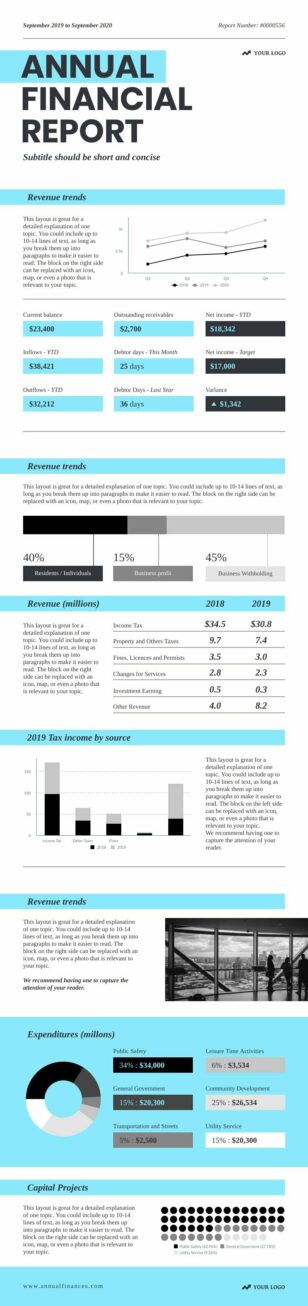
Annual Financial Report
Infographics
Annual Financial Report
 Infographics
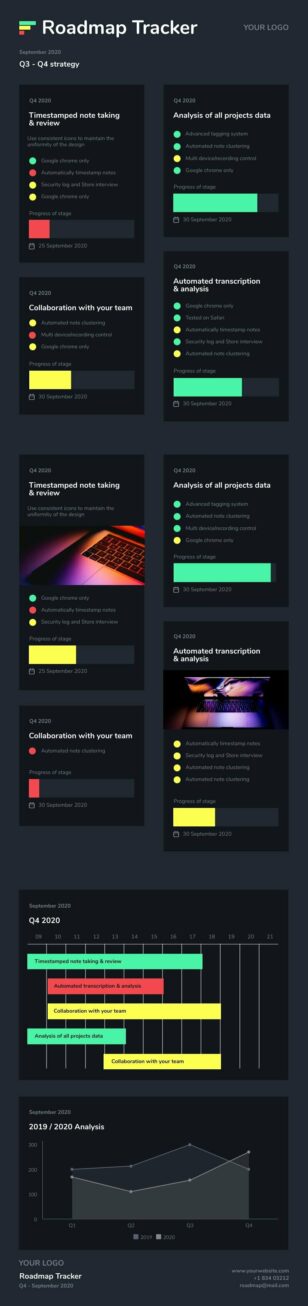
Product Roadmap
Infographics
Product Roadmap
 Infographics
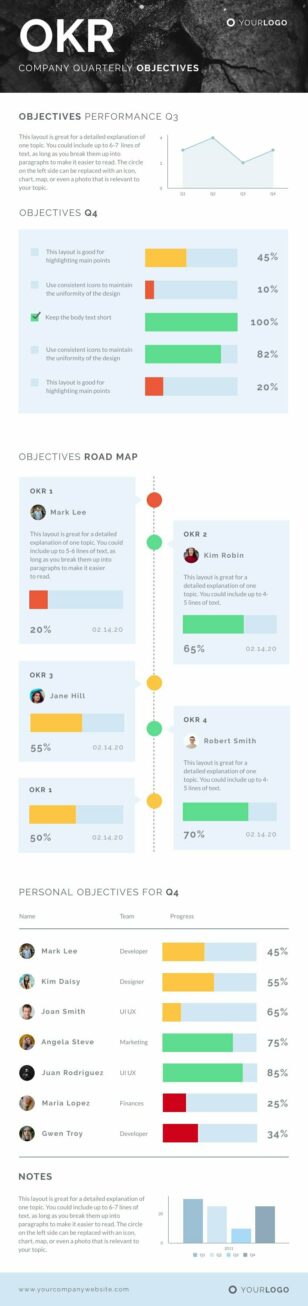
OKR
Infographics
OKR
 Infographics
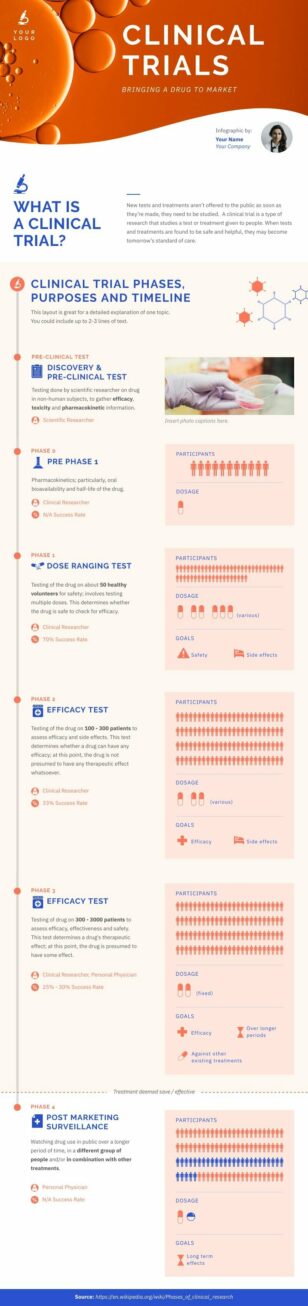
Clinical Trial Phases
Infographics
Clinical Trial Phases
 Infographics
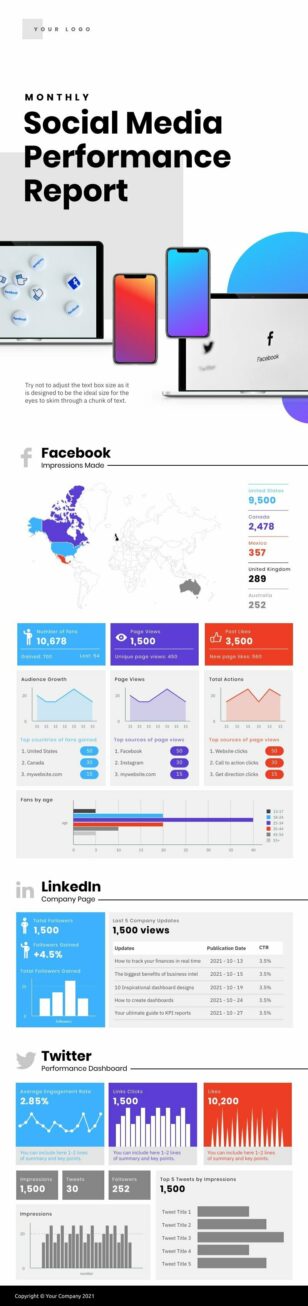
Social Media Performance Report
Infographics
Social Media Performance Report
 Infographics
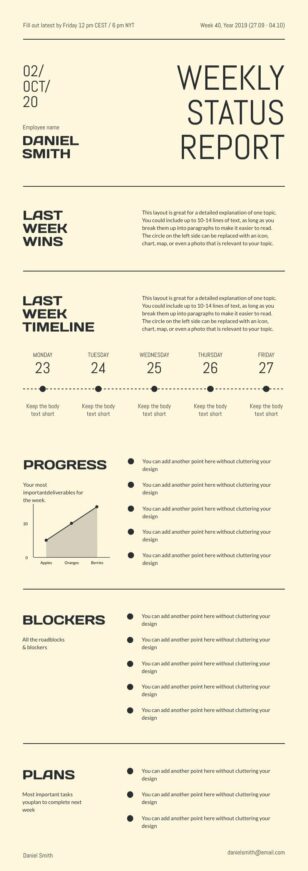
Weekly Status Report
Infographics
Weekly Status Report
 Infographics
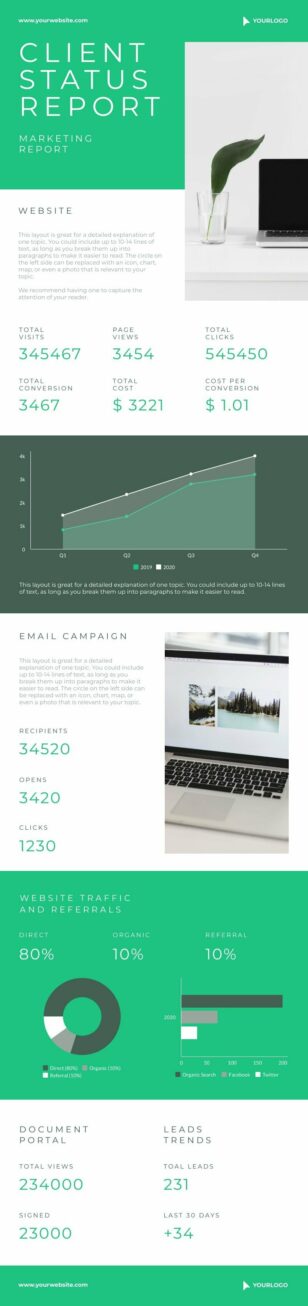
Marketing Report
Infographics
Marketing Report
 Infographics
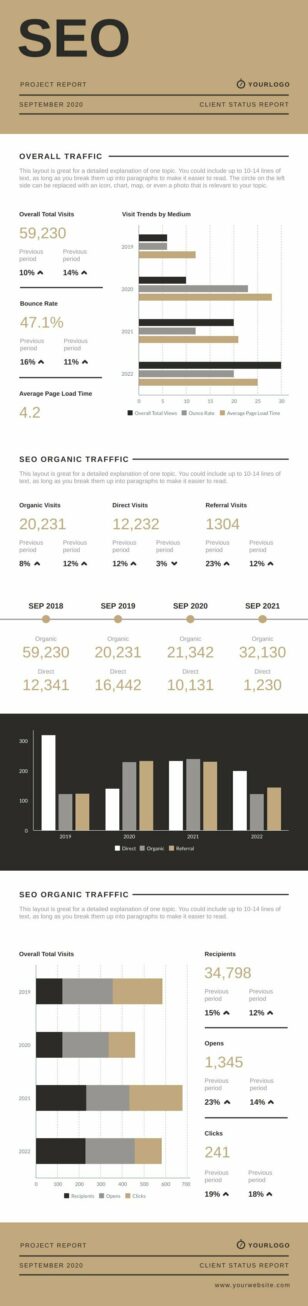
SEO Report
Infographics
SEO Report
 Infographics
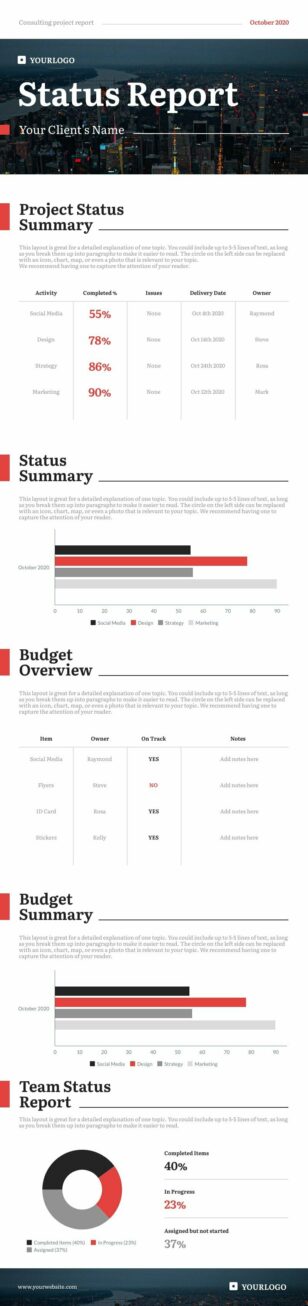
Consulting Report
Infographics
Consulting Report
 Infographics
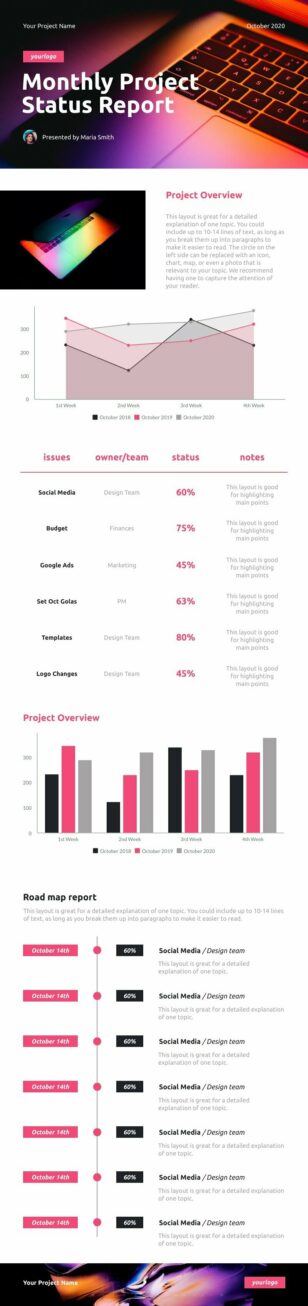
Monthly Project Status Report Template
Infographics
Monthly Project Status Report Template
 Infographics
Organizational Chart
Infographics
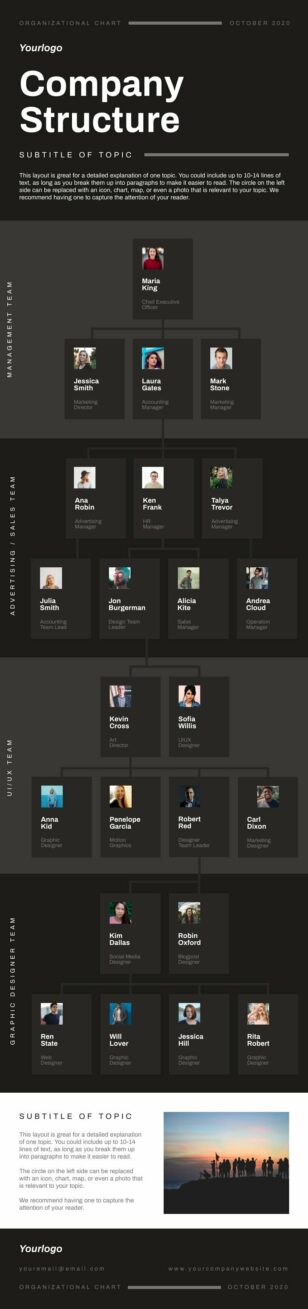
Organizational Chart
 Infographics
Healthy Lifestyle
Infographics
Healthy Lifestyle
 Infographics
Clinical Study Report
Infographics
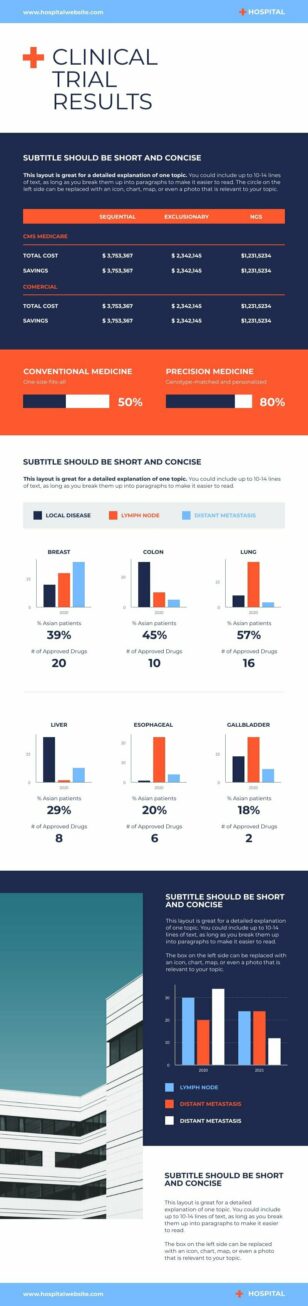
Clinical Study Report
 Infographics
How Vaccines Work
Infographics
How Vaccines Work
 Infographics
Work From Home Advice
Infographics
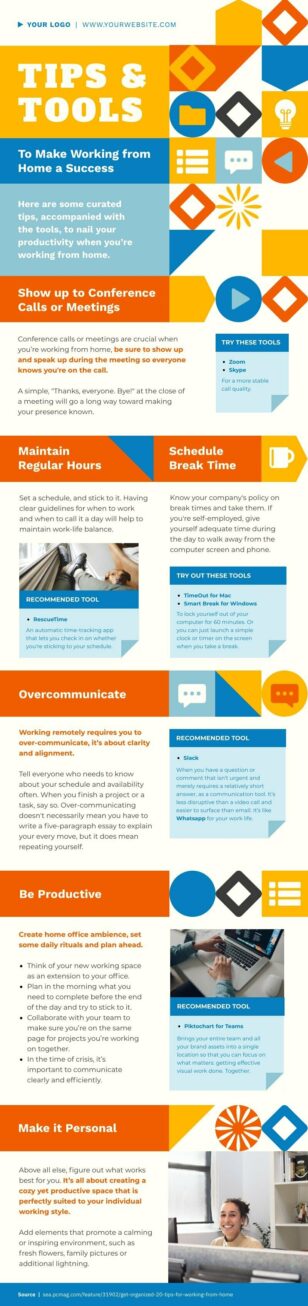
Work From Home Advice
 Infographics
Work From Home Tips
Infographics
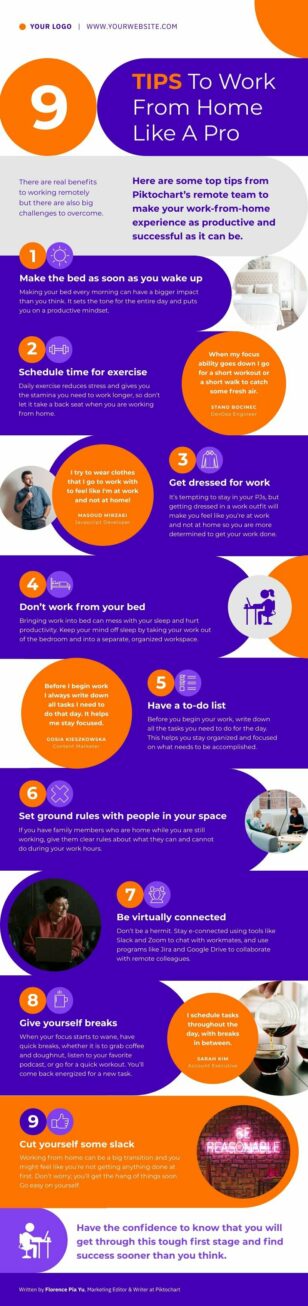
Work From Home Tips
 Infographics
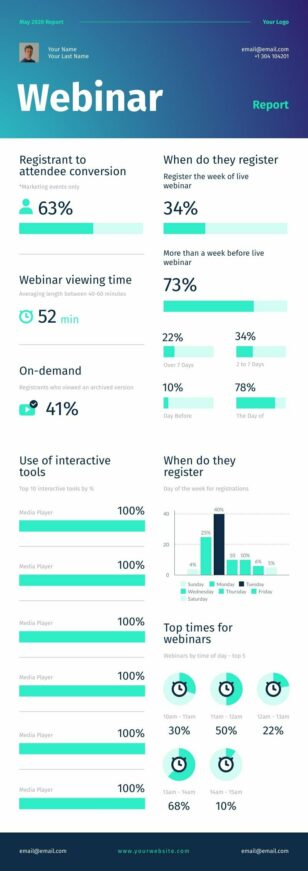
Webinar Report
Infographics
Webinar Report
 Infographics
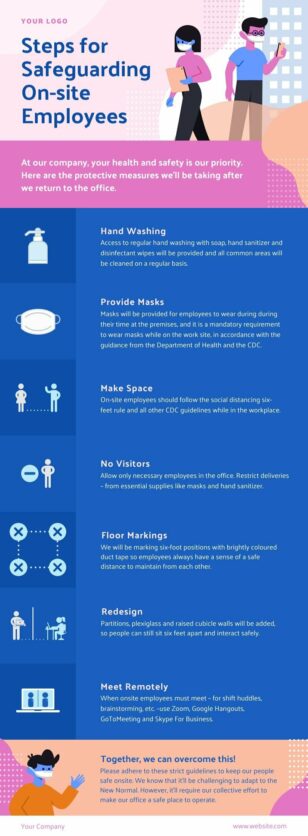
New Normal On-site Safety
Infographics
New Normal On-site Safety
 Infographics
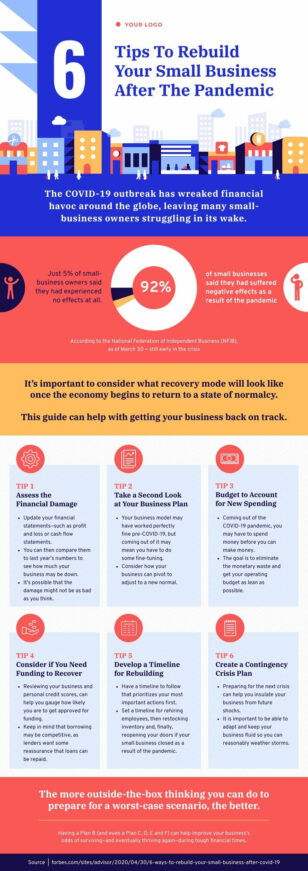
Tips To Rebuild Your Small Business
Infographics
Tips To Rebuild Your Small Business
 Infographics
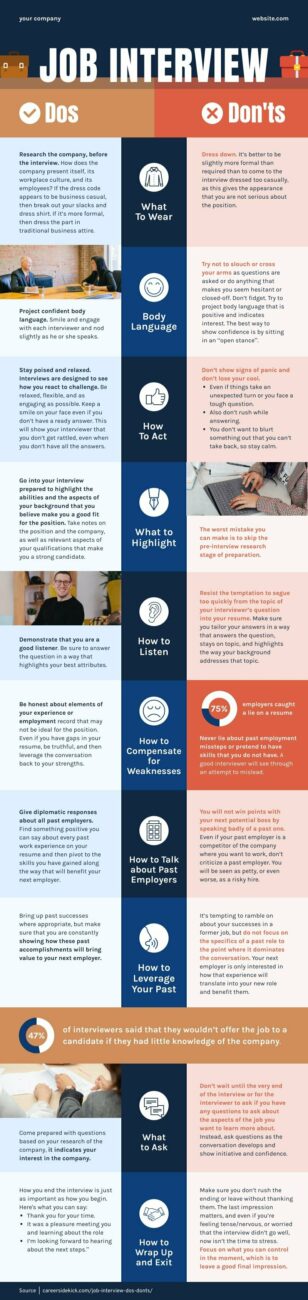
Interview Dos & Don’ts
Infographics
Interview Dos & Don’ts
 Infographics
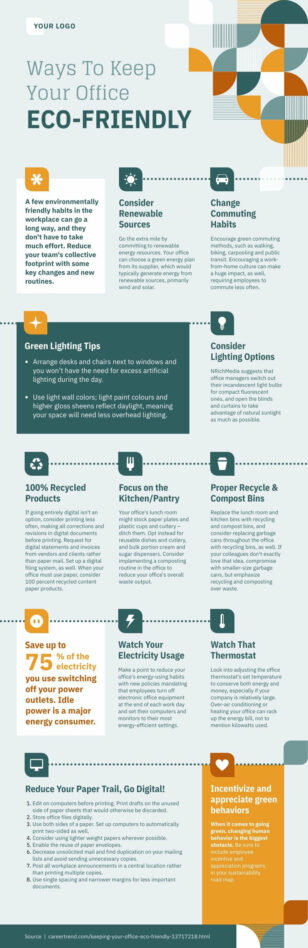
Eco-Friendly Office
Infographics
Eco-Friendly Office
 Infographics
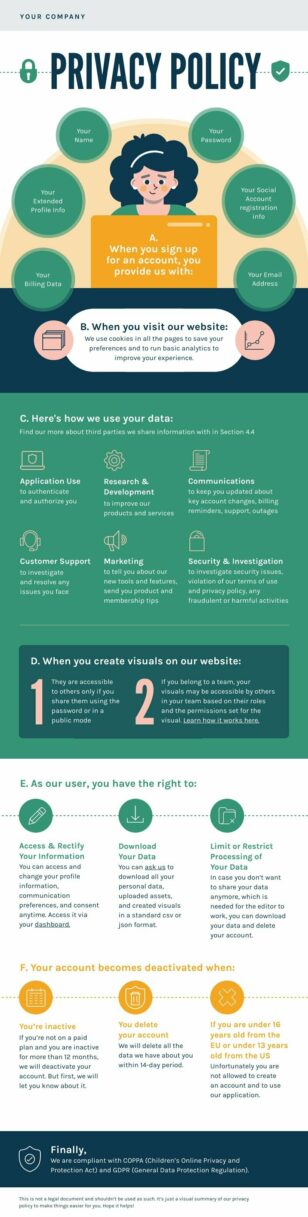
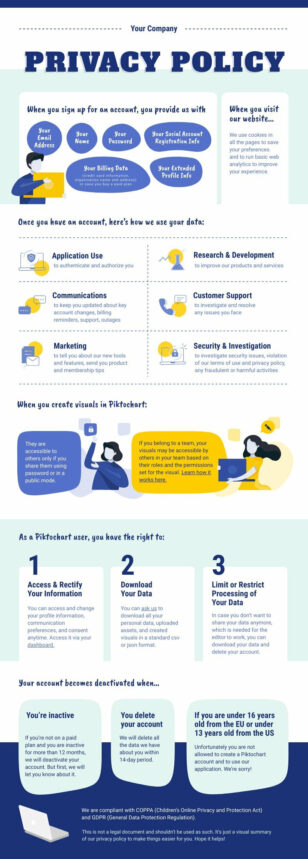
Privacy Policy
Infographics
Privacy Policy
 Infographics
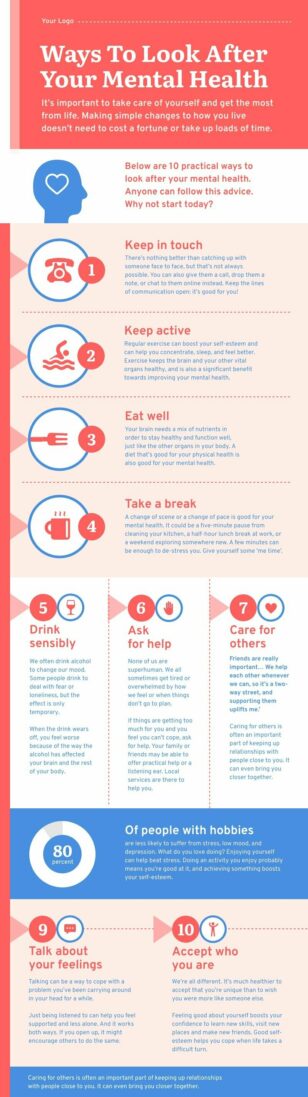
How to Look After Your Mental Health
Infographics
How to Look After Your Mental Health
 Infographics
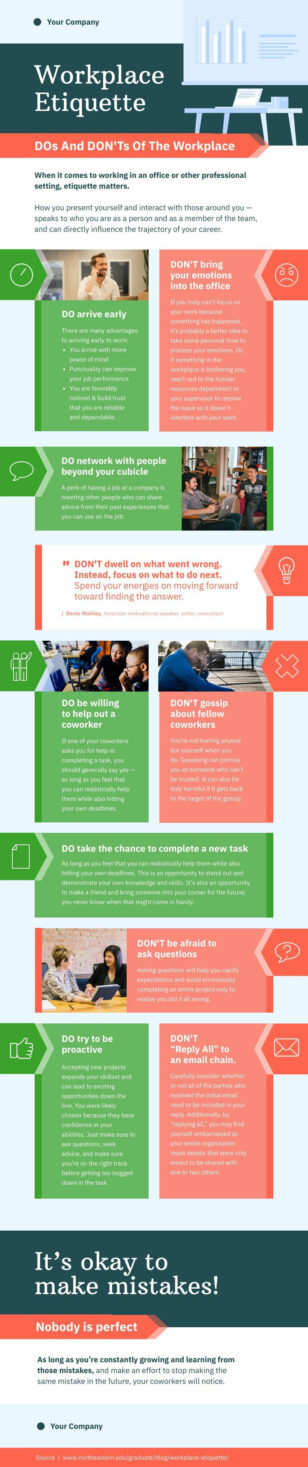
Workplace Etiquette
Infographics
Interview Dos & Don’ts
Infographics
Workplace Etiquette
Infographics
Interview Dos & Don’ts
 Infographics
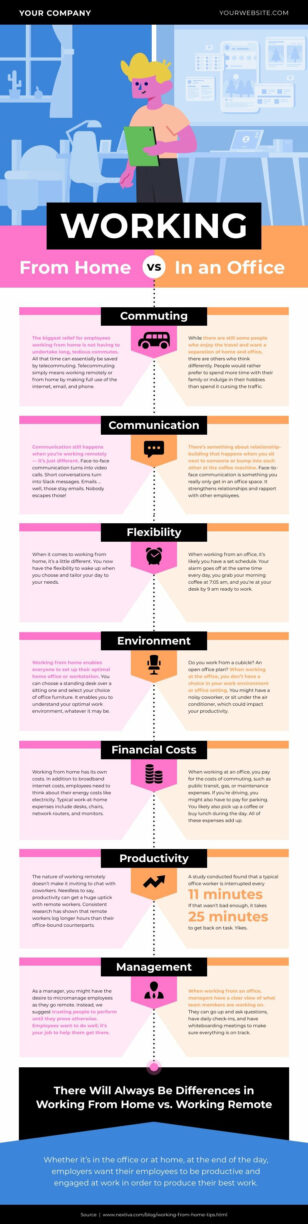
Working From Home VS Working In An Office
Infographics
Working From Home VS Working In An Office
 Infographics
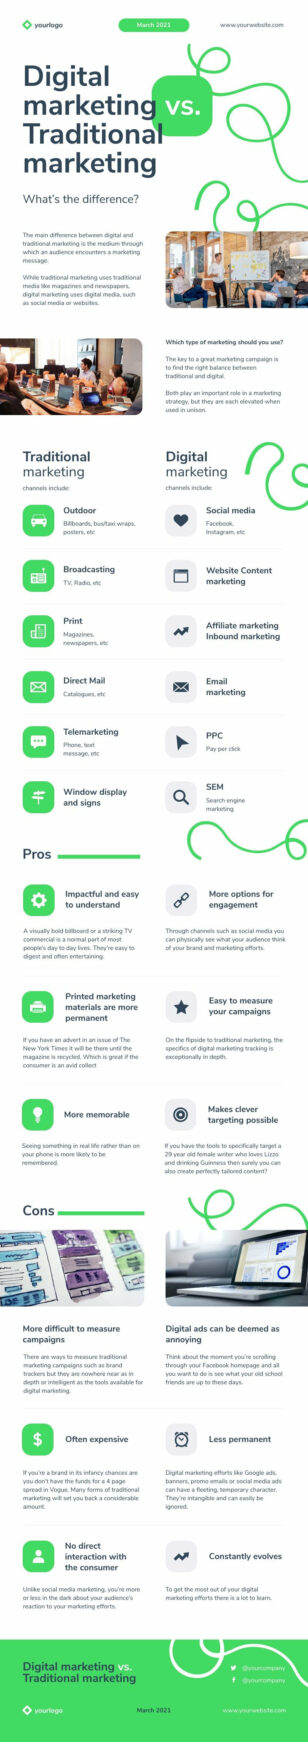
Marketing Comparison
Infographics
Marketing Comparison
 Infographics
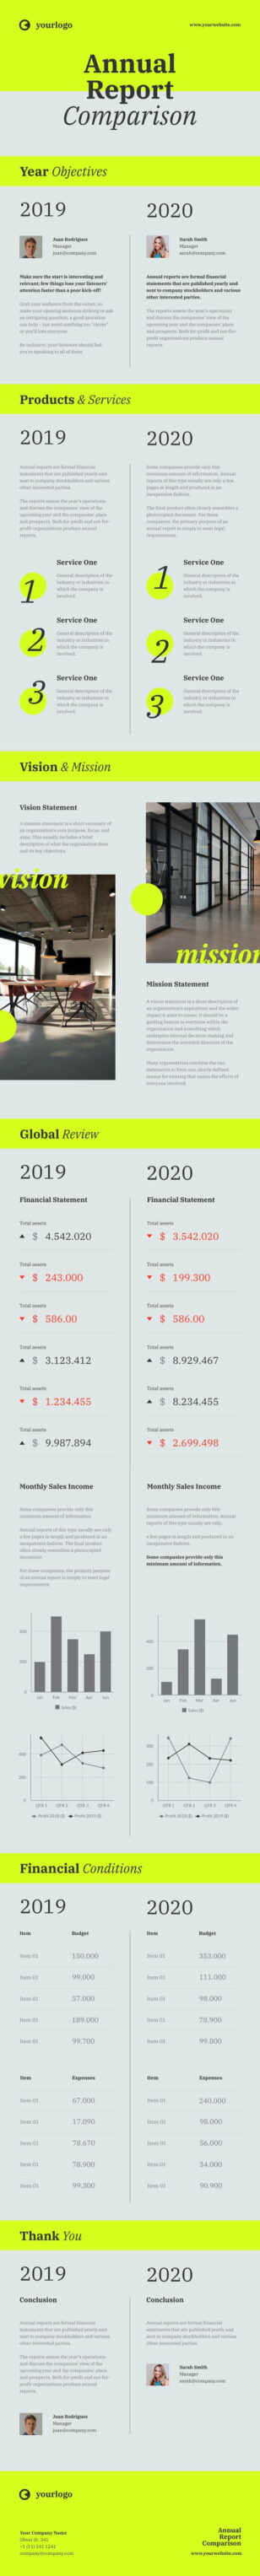
Annual Report Comparison
Infographics
Annual Report Comparison
 Infographics
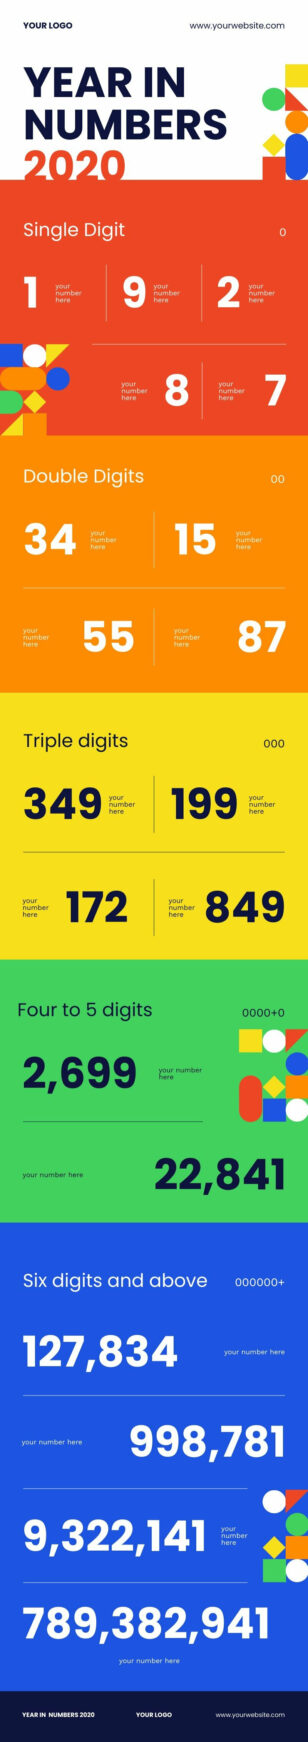
Year in Numbers
Infographics
Year in Numbers
 Infographics
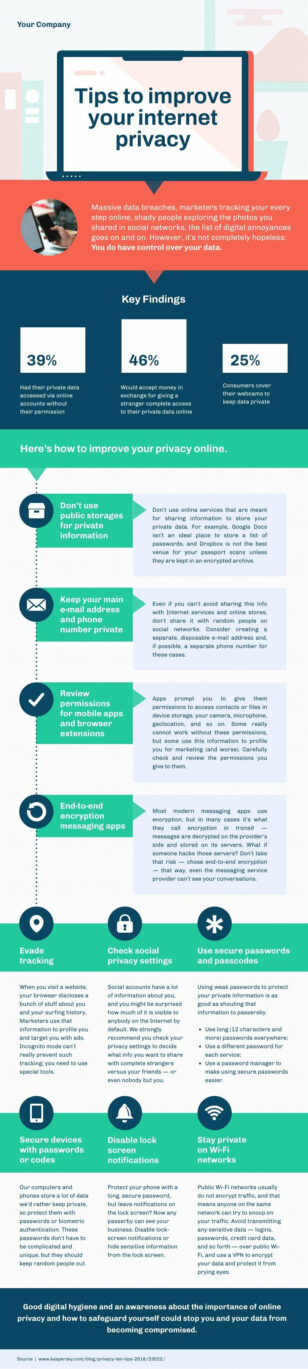
Protect Personal Information
Infographics
Protect Personal Information
 Infographics
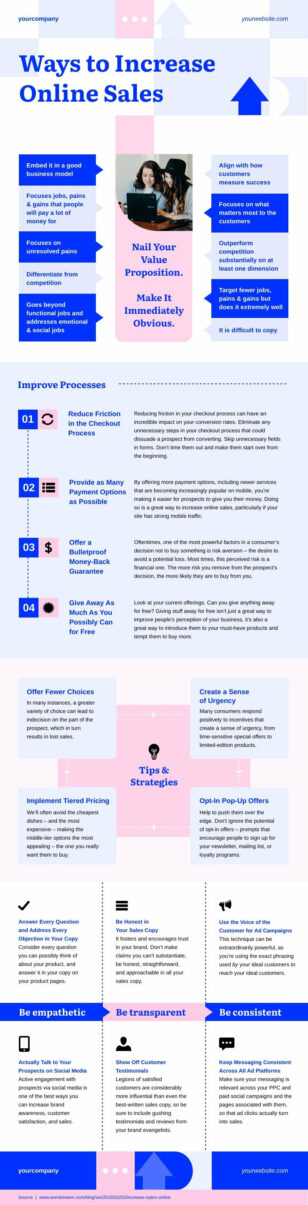
Sales Deck
Infographics
Sales Deck
 Infographics
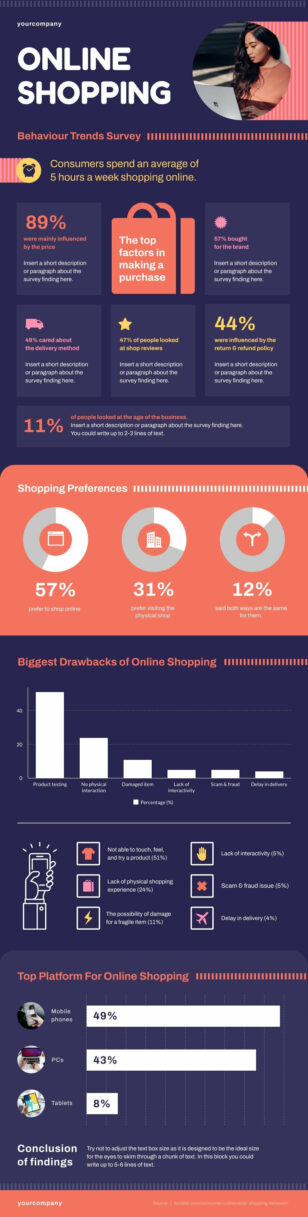
Online Shopping Survey
Infographics
Online Shopping Survey
 Infographics
Privacy Protocol
Infographics
Privacy Protocol
 Infographics
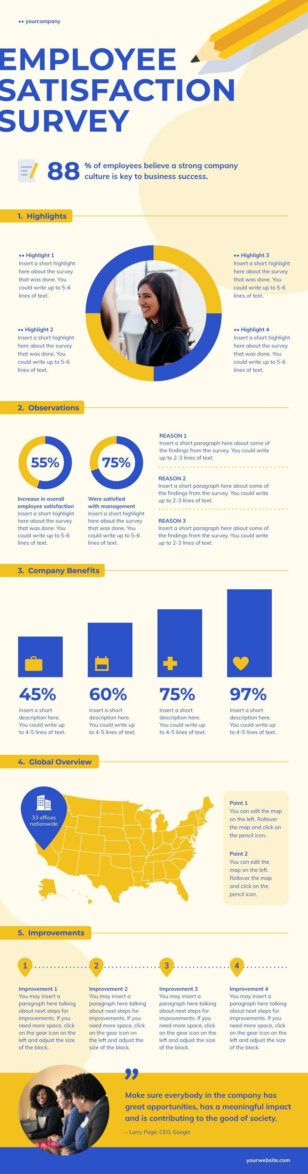
Employee Satisfaction Survey
Infographics
Employee Satisfaction Survey
 Infographics
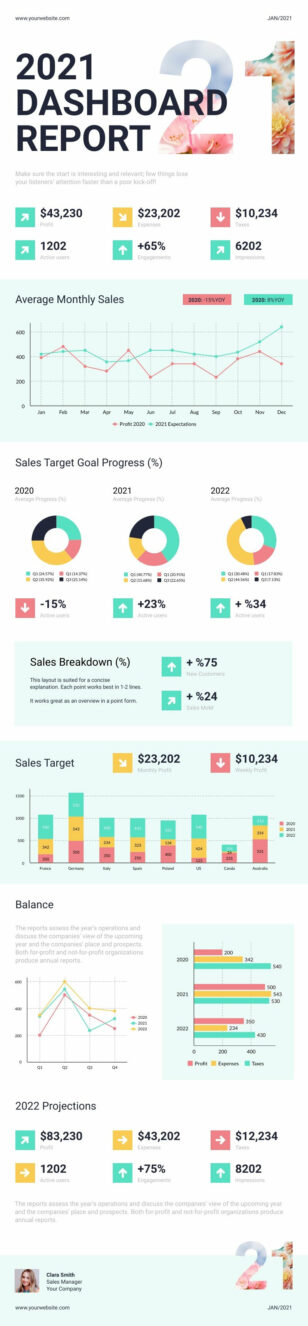
Dashboard Report
Infographics
Dashboard Report
 Infographics
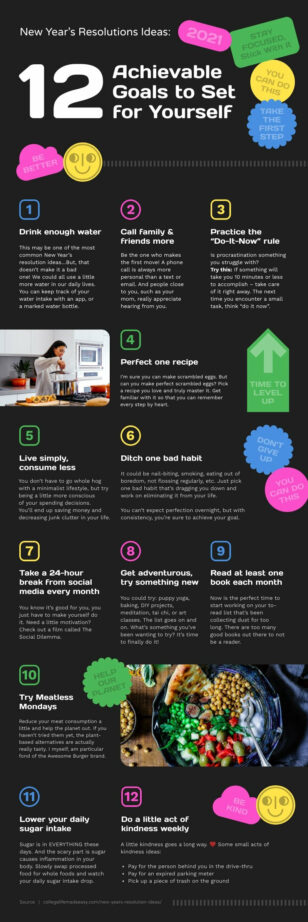
New Year’s Resolution Ideas
Infographics
New Year’s Resolution Ideas
 Infographics
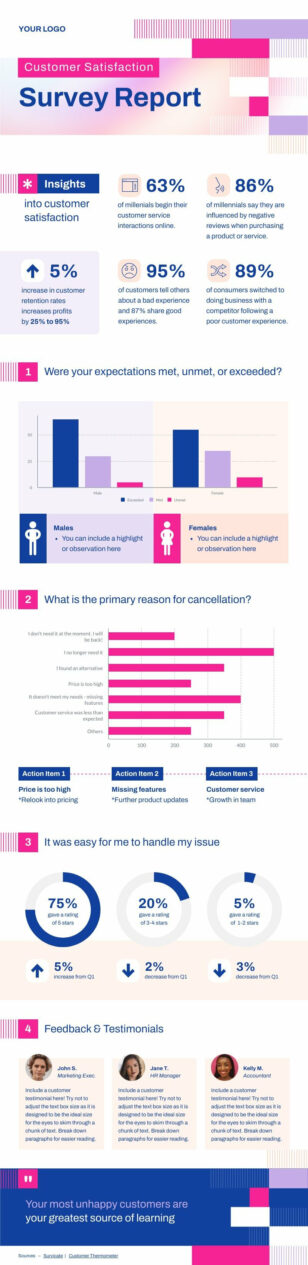
Customer Satisfaction Report
Infographics
Customer Satisfaction Report
 Infographics
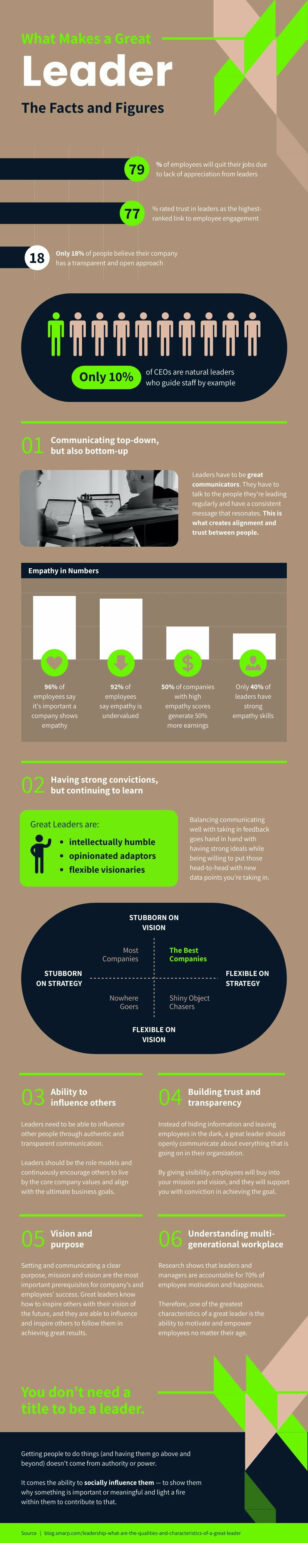
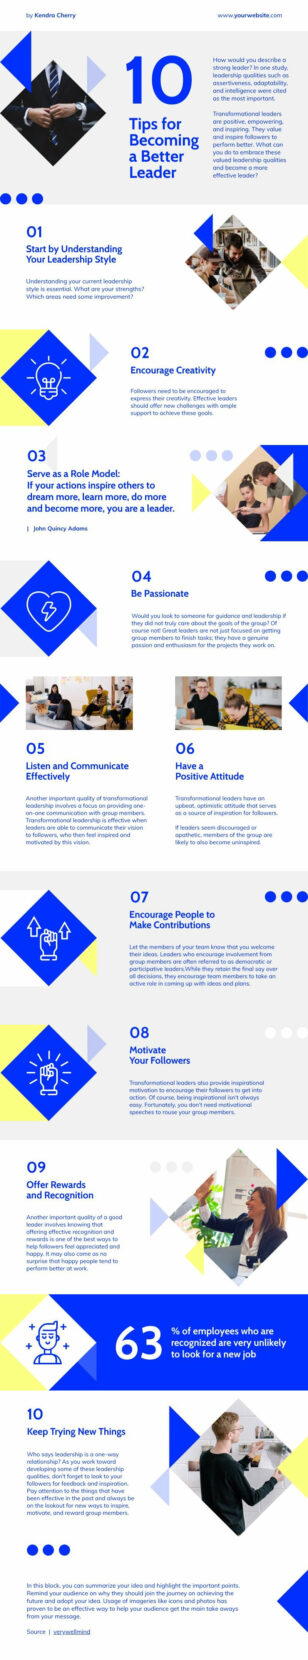
Leadership Statistics
Infographics
Leadership Statistics
 Infographics
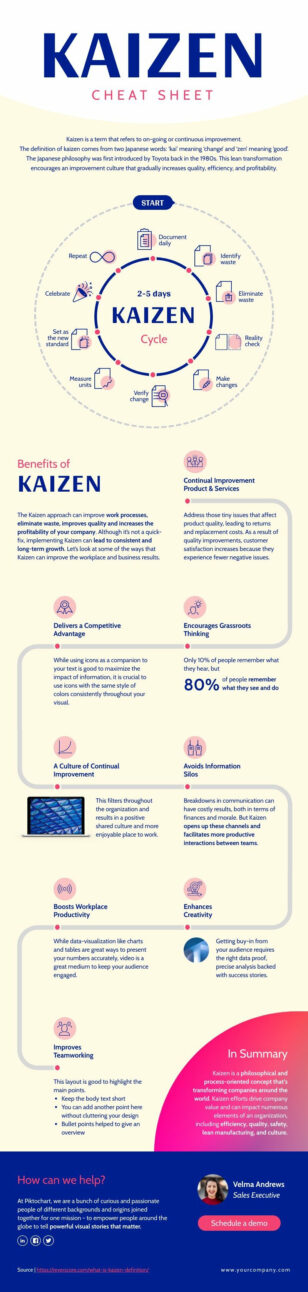
Kaizen – Continuous Improvement Process
Infographics
Kaizen – Continuous Improvement Process
 Infographics
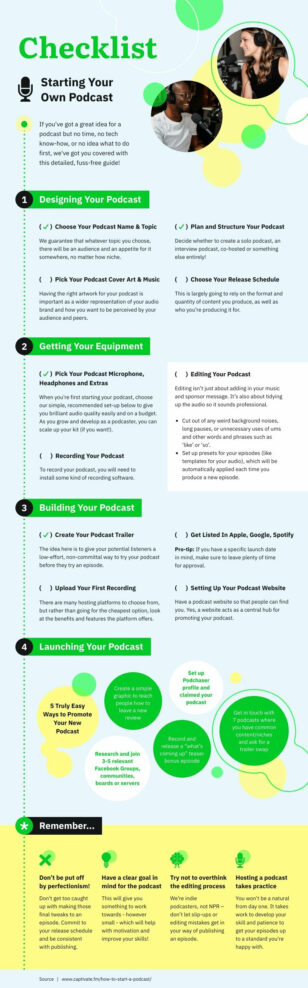
Podcast
Infographics
Podcast
 Infographics
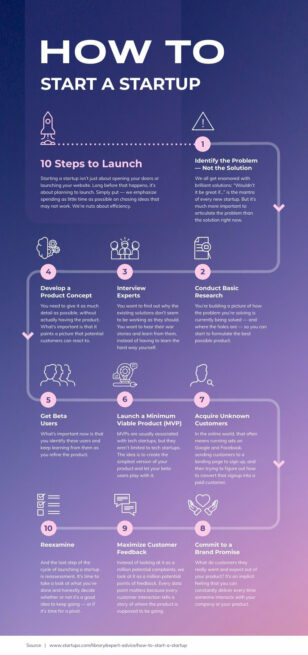
How to Start a Business
Infographics
How to Start a Business
 Infographics
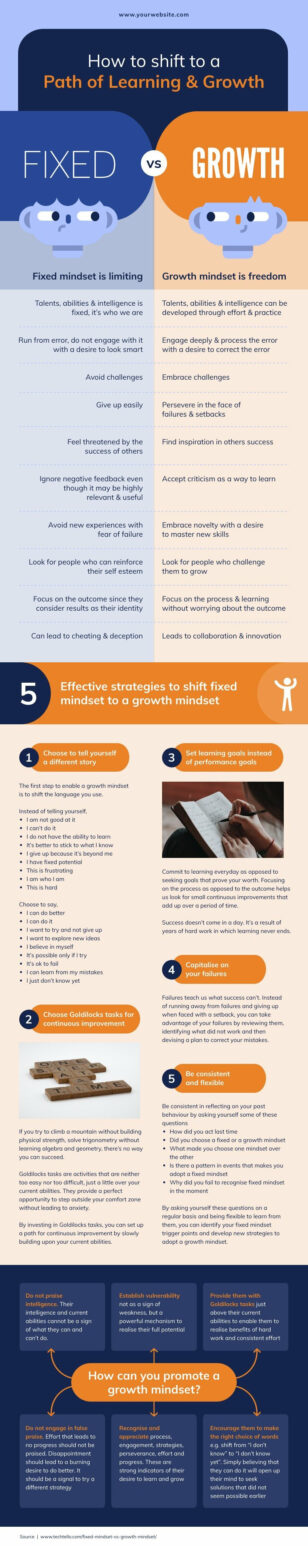
Mindset for Growth
Infographics
Mindset for Growth
 Infographics
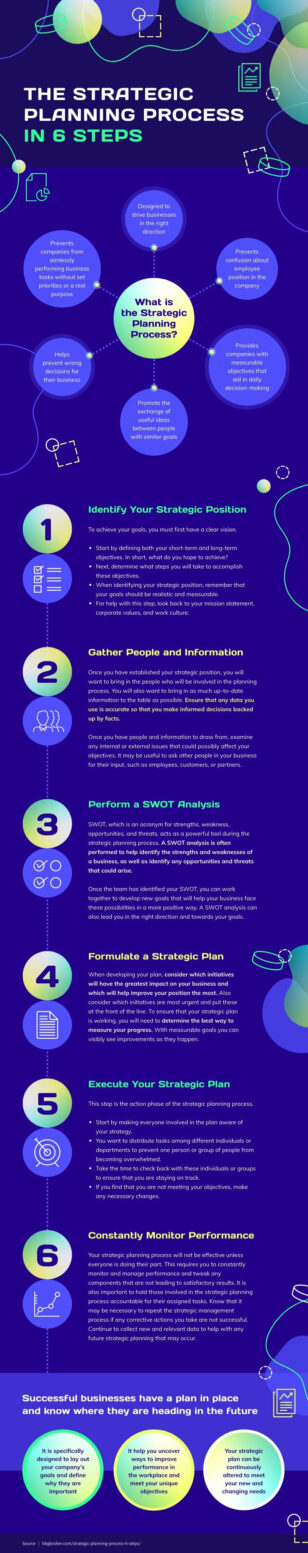
Strategic Planning
Infographics
Strategic Planning
 Infographics
How to Concentrate on Studies
Infographics
How to Concentrate on Studies
 Infographics
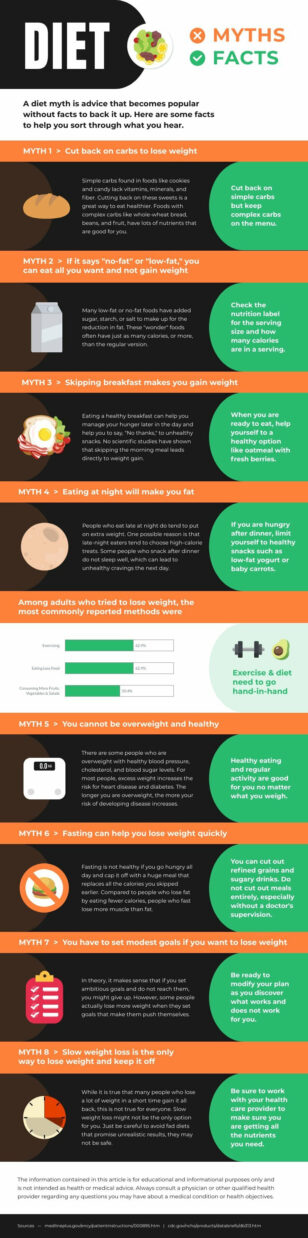
Food Myths
Infographics
Food Myths
 Infographics
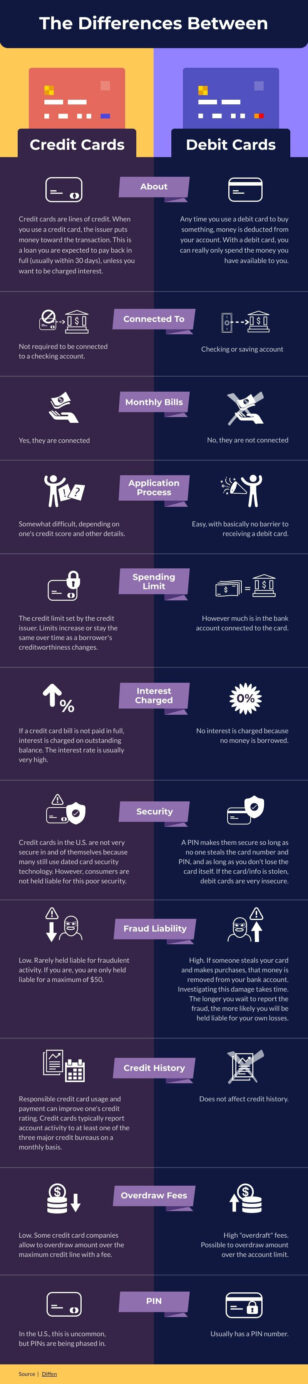
Differences Between Credit Cards and Debit Cards
Infographics
Differences Between Credit Cards and Debit Cards
 Infographics
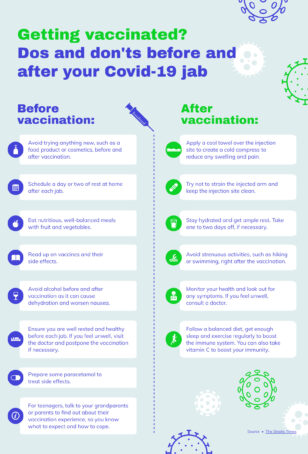
Do’s and Don’ts of Vaccination
Infographics
Do’s and Don’ts of Vaccination
 Infographics
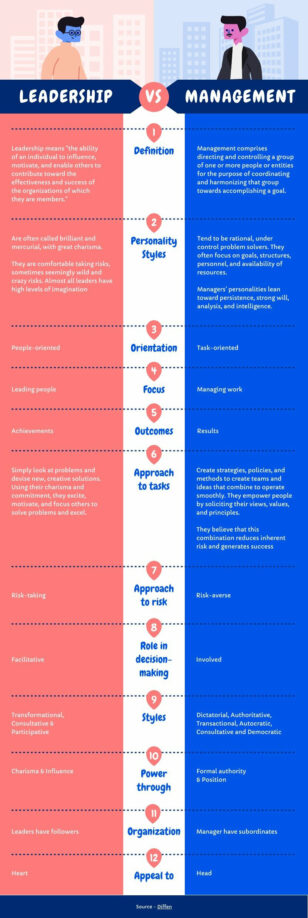
Leadership vs Management
Infographics
Leadership vs Management
 Infographics
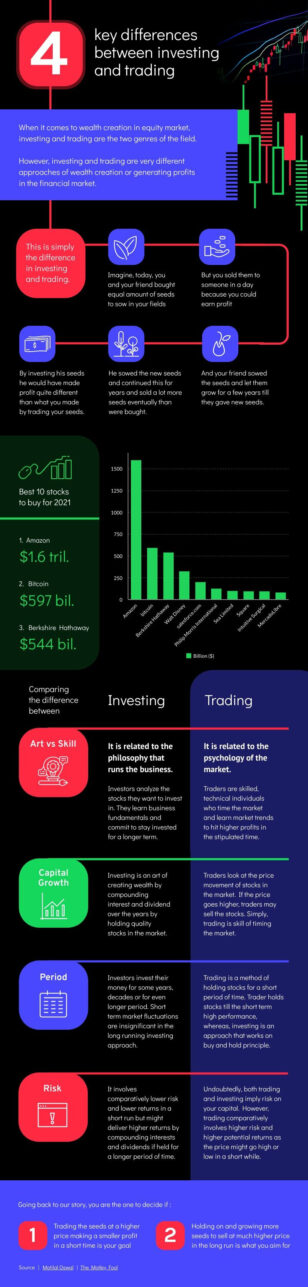
Investing vs Trading
Infographics
Investing vs Trading
 Infographics
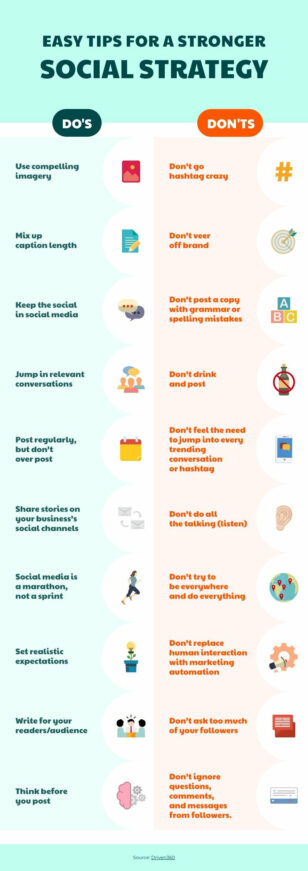
How to Use Social Media Effectively
Infographics
How to Use Social Media Effectively
 Infographics
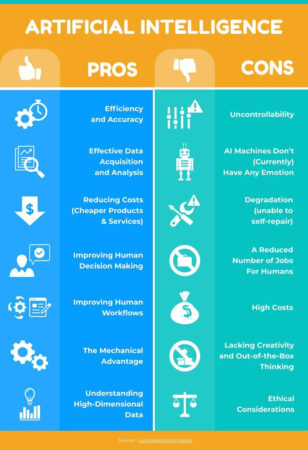
Pros and Cons of Artificial Intelligence
Infographics
Pros and Cons of Artificial Intelligence
 Infographics
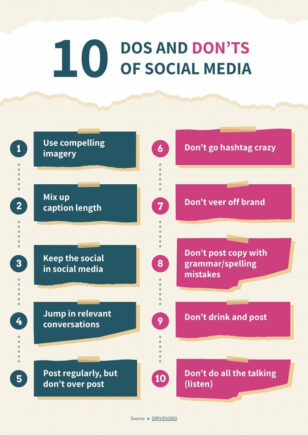
10 Do’s and Don’ts of Social Media
Infographics
10 Do’s and Don’ts of Social Media
 Infographics
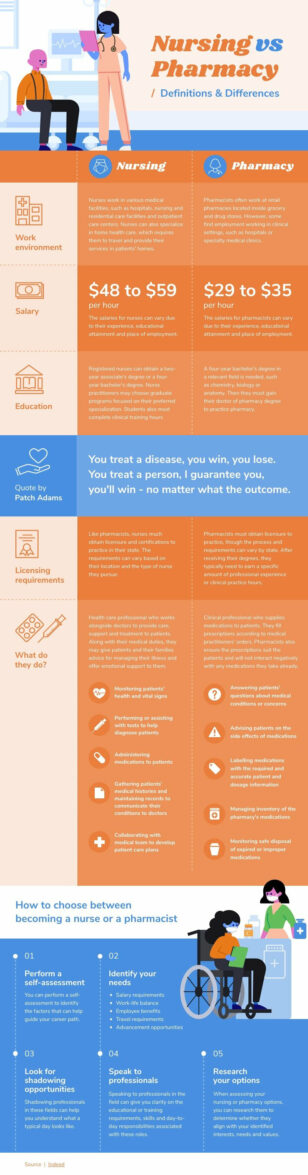
Nursing vs Pharmacy
Infographics
Nursing vs Pharmacy
 Infographics
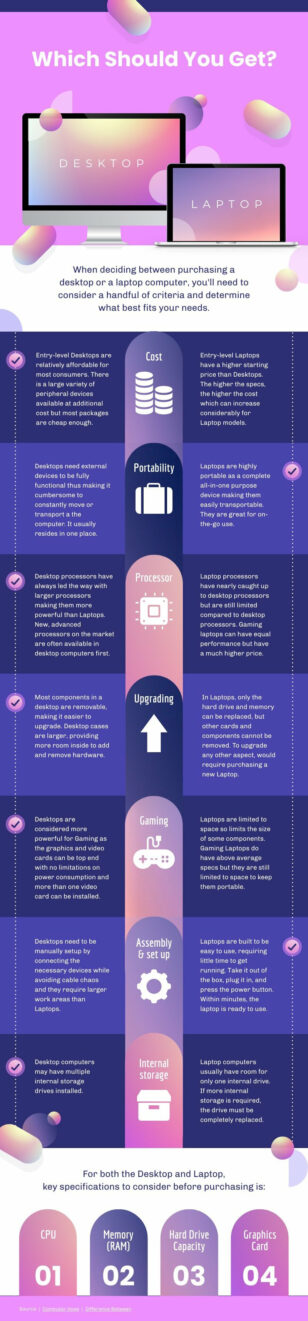
Desktop vs Laptop
Infographics
Desktop vs Laptop
 Infographics
10 Tips For Becoming A Better Manager
Infographics
10 Tips For Becoming A Better Manager
 Infographics
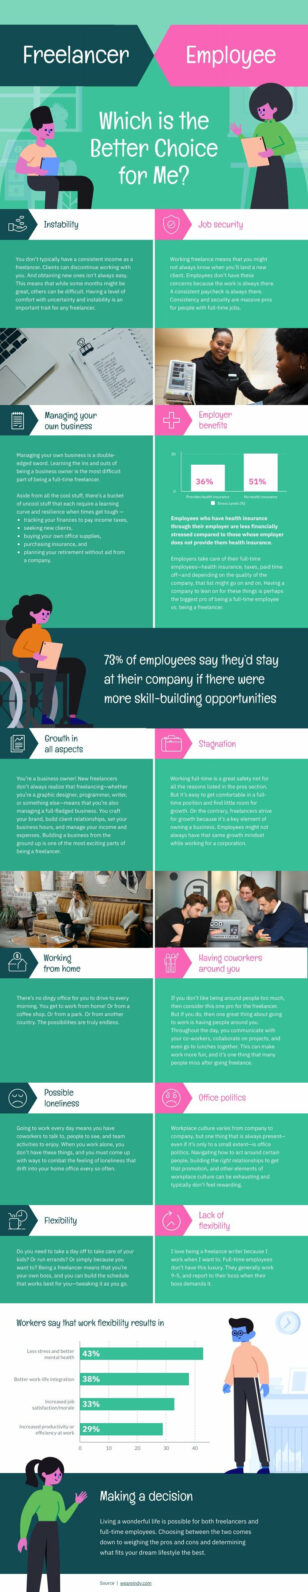
Freelancer vs Employee
Infographics
Freelancer vs Employee
 Infographics
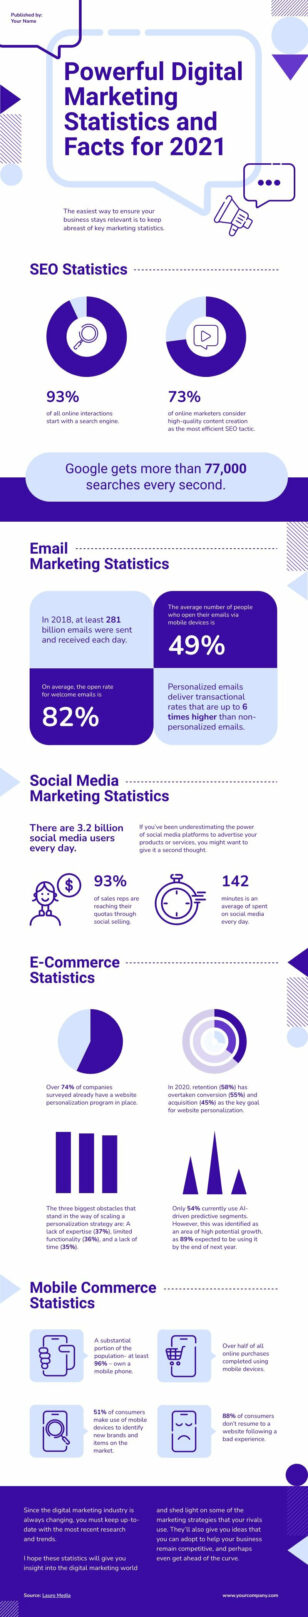
Digital Marketing Facts
Infographics
Digital Marketing Facts
 Infographics
How to Work From Home Effectively
Infographics
How to Work From Home Effectively
 Infographics
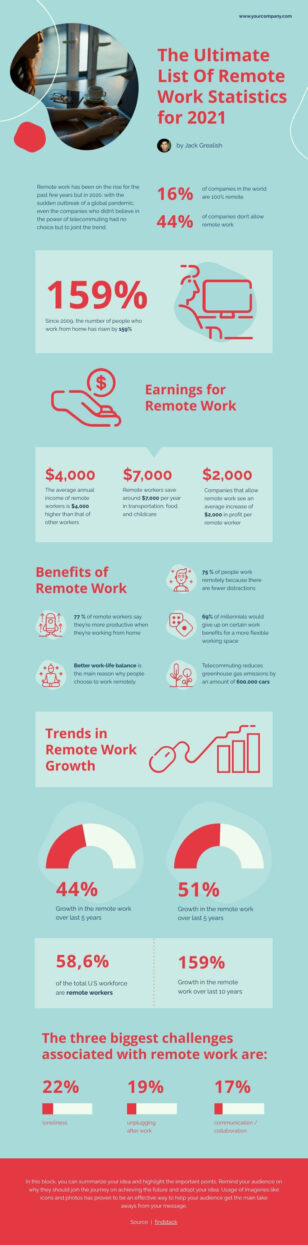
Work From Home Statistics
Infographics
Work From Home Statistics
 Infographics
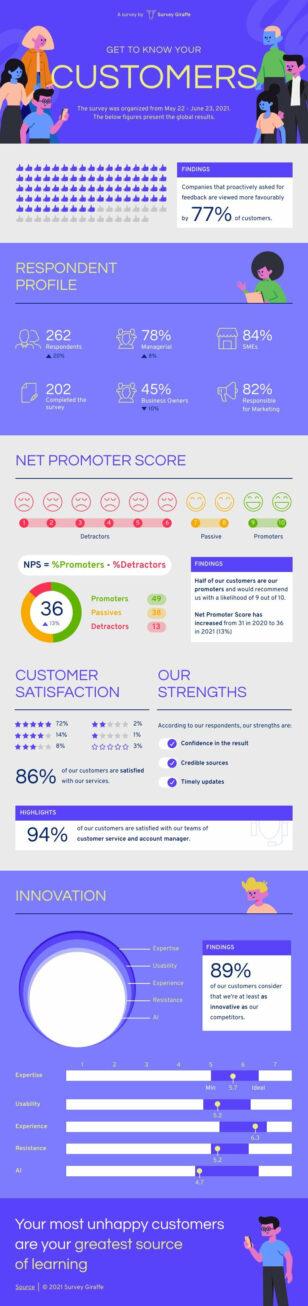
NPS Survey
Infographics
NPS Survey
 Infographics
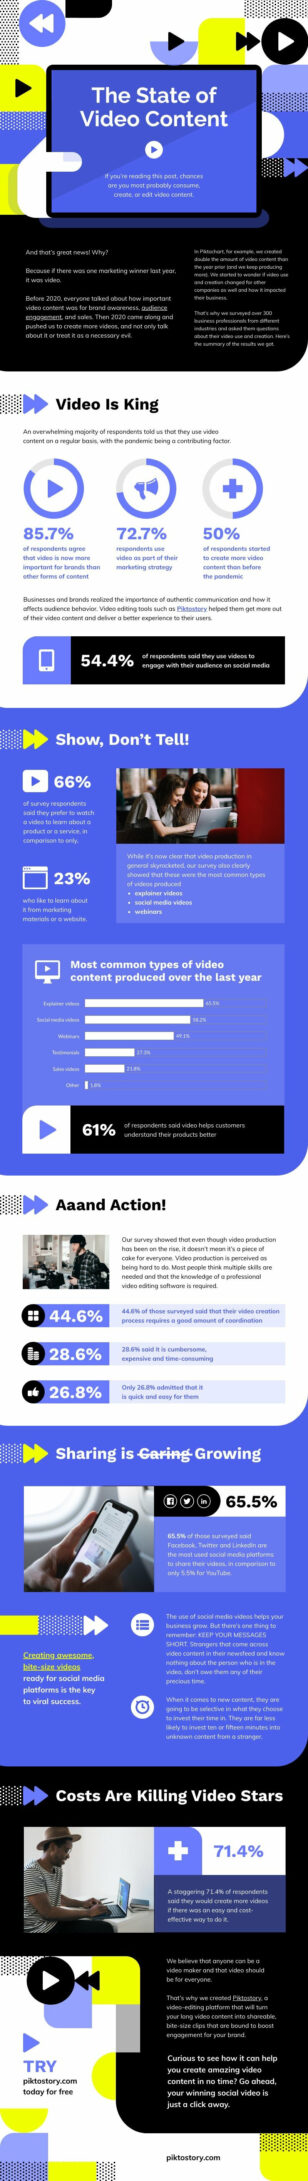
Video Stats
Infographics
Video Stats
Free infographic templates give you a faster way to turn data, statistics, and complex ideas into visuals that people immediately understand. Built for marketers, educators, content teams, and researchers, these templates cover every major use case from blog post graphics to executive presentations. Whether you need to visualize survey results, explain a multi-step process, or summarize research for a general audience, you can adapt any layout in minutes without any design background. Every template is fully editable: change colors, swap fonts, rearrange sections, and drop in your own data or imagery. You will find designs suited to statistical summaries, comparison breakdowns, step-by-step process maps, timelines, and informational overviews. If you are searching for professional infographic templates or online infographic layouts that look polished on screen and in print, there are options here for every skill level and content type.
What Can You Create with These Infographic Templates?
- Statistical infographics: Visualize survey data, research findings, or performance numbers in a format people can scan quickly
- Process infographics: Map out workflows, procedures, or step-by-step guides with numbered sections and visual flow
- Timeline infographics: Show company history, project milestones, or historical events across a clear sequential layout
- Comparison infographics: Present product differences, option tradeoffs, or side-by-side evaluations in a single visual
- List infographics: Summarize top tips, best practices, or key takeaways in a ranked or categorized format
- Educational infographics: Break down complex topics into digestible visuals for classroom use or training materials
Why Use These Infographic Templates?
- Skip the blank canvas: Start from a structured layout that already has hierarchy, spacing, and visual balance built in
- No design skills required: Every element is editable using a drag-and-drop interface accessible to any skill level
- High-quality output: Designs render clearly at any resolution for web, social media, presentations, and print
- Fast production: Go from brief to finished infographic in minutes, making tight content deadlines manageable
Who Are These Templates For?
- Content marketers: For blog posts, email content, and social campaigns that need compelling visual assets
- Educators and trainers: For lesson plans, classroom materials, e-learning modules, and workshop handouts
- Business analysts: For communicating research findings, dashboards, and performance data to mixed audiences
- Students: For academic projects, class presentations, and research summaries that need visual clarity
- Nonprofit and public sector communicators: For awareness campaigns, community reporting, and outreach materials
Types of Infographic Templates Available
- Statistical templates: Layouts built around data visualization with chart and graph placeholder areas
- Process templates: Sequential step designs using numbered flow, arrows, or stage markers
- Timeline templates: Horizontal and vertical formats for showing progression, events, or chronological data
- Comparison templates: Structured side-by-side layouts for contrasting products, options, or ideas
- List templates: Clean ranked or categorized designs for summarizing multiple points efficiently
- Geographic templates: Map-integrated layouts for presenting regional, demographic, or location-based data
Explore More Templates
If you need complementary formats for your content, explore our presentation templates for slide-based storytelling, report templates for long-form documents, or social media templates when you want to adapt your infographic for specific platforms. Our charts and graphs templates are also useful if your main focus is data visualization.
How to Use These Infographic Templates
- Browse the template library and choose a layout that fits your content type and target audience
- Replace placeholder text, data, icons, and images with your own content, and adjust colors to match your brand
- Download your finished infographic as a high-resolution PNG, PDF, or shareable link