Piktochart Templates Infographics
Free Infographic Templates
Turn complex data and ideas into clear, visual stories with free infographic templates. Perfect for marketers, educators, and teams who need to explain processes, share statistics, or summarize reports — customize and download in minutes.
Infographic Templates for Data-Driven Visual Storytelling
 Infographics
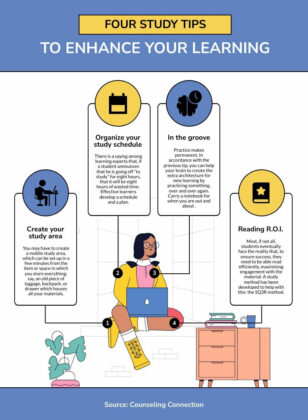
Study Tips
Infographics
Study Tips
 Infographics
Exam Preparation Tips
Infographics
Exam Preparation Tips
 Infographics
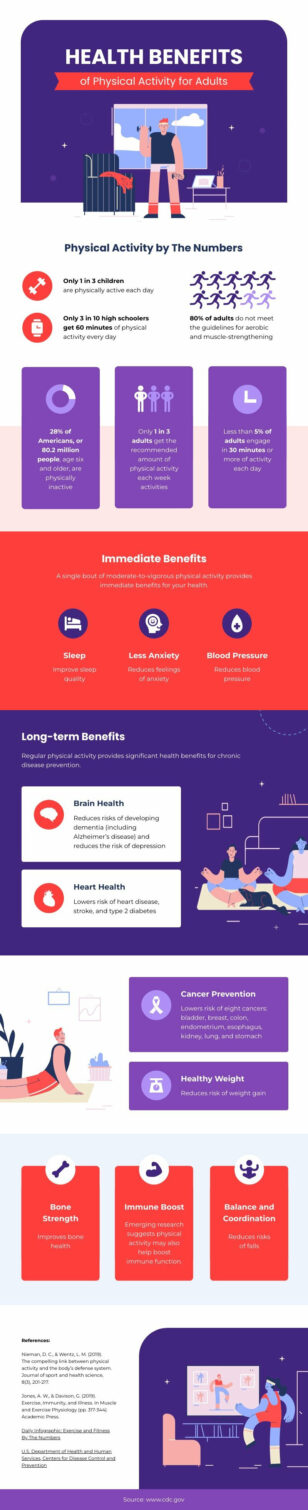
Health Benefits of Physical Activity
Infographics
Health Benefits of Physical Activity
 Infographics
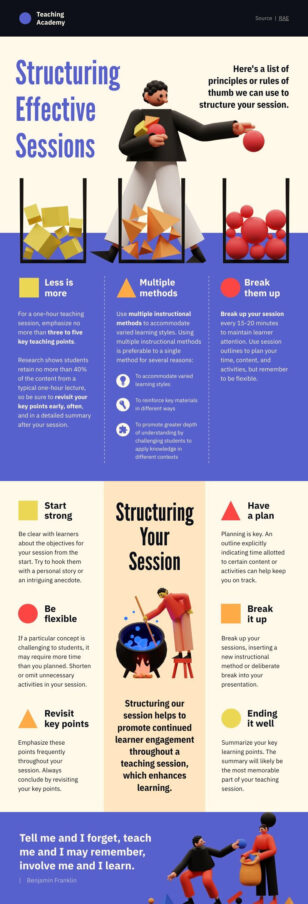
The Teacher’s Guide
Infographics
The Teacher’s Guide
 Infographics
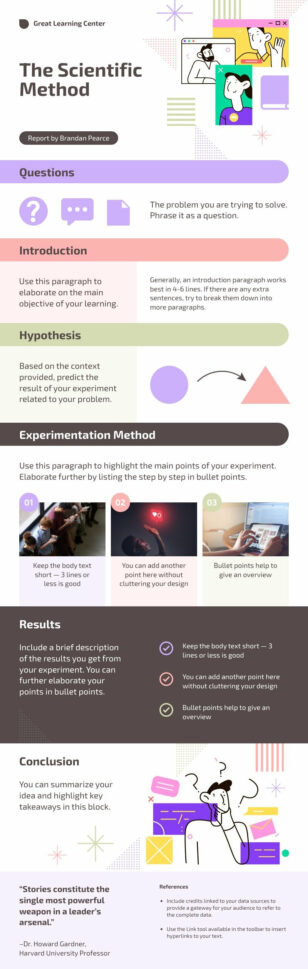
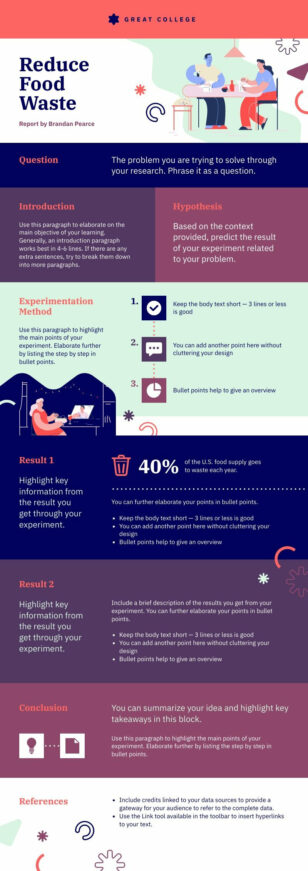
The Scientific Method
Infographics
The Scientific Method
 Infographics
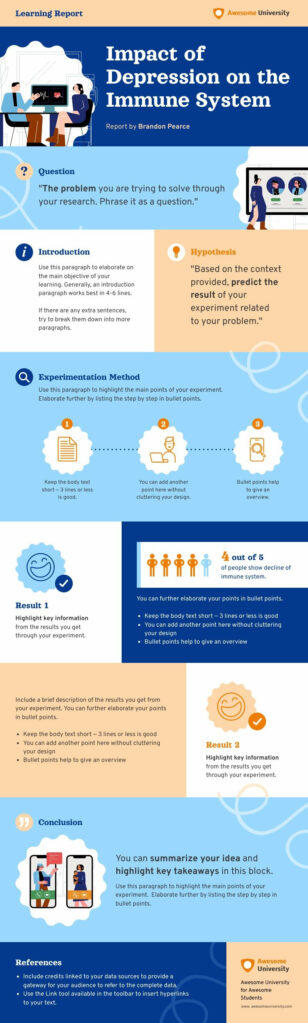
Impact of Depression on the Immune System Experiment Report
Infographics
Impact of Depression on the Immune System Experiment Report
 Infographics
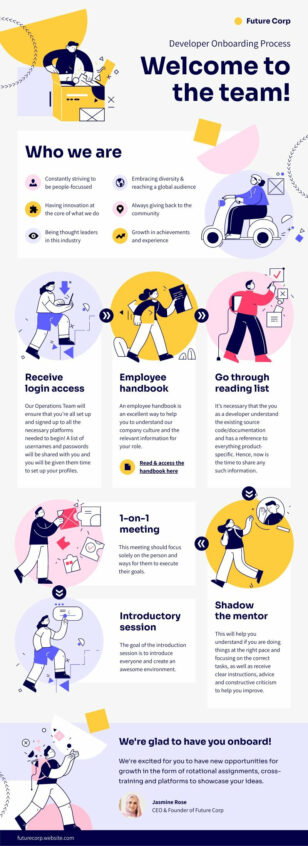
Developer Onboarding Process
Infographics
Developer Onboarding Process
 Infographics
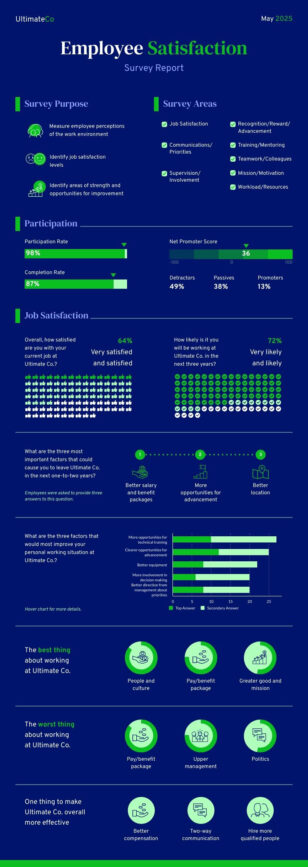
Employee Satisfaction Report
Infographics
Employee Satisfaction Report
 Infographics
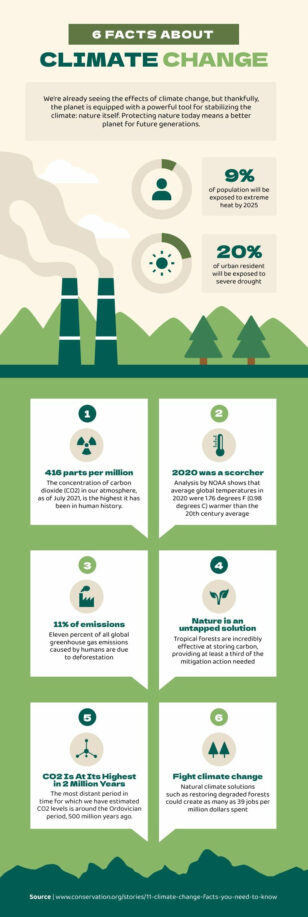
6 Facts About Climate Change
Infographics
6 Facts About Climate Change
 Infographics
10 Steps To Buying A Home
Infographics
10 Steps To Buying A Home
 Infographics
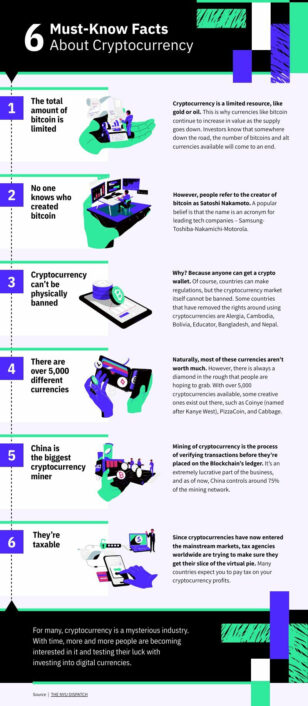
6 Must-Know Facts About Cryptocurrency
Infographics
6 Must-Know Facts About Cryptocurrency
 Infographics
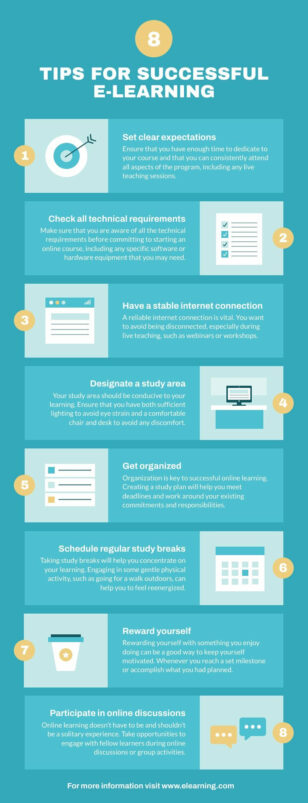
8 Tips for Successful E-Learning
Infographics
8 Tips for Successful E-Learning
 Infographics
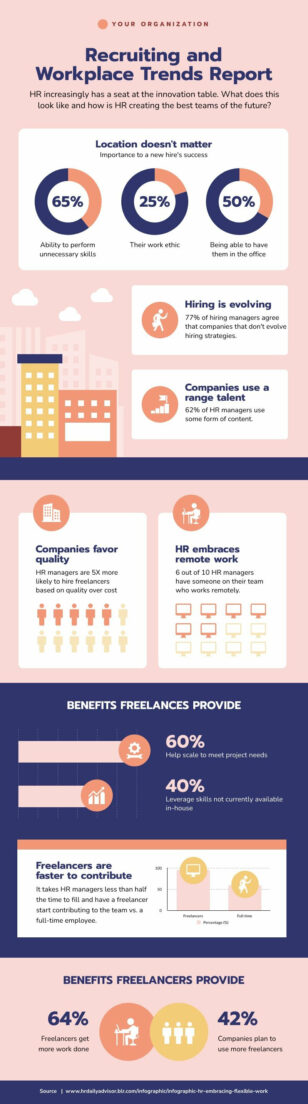
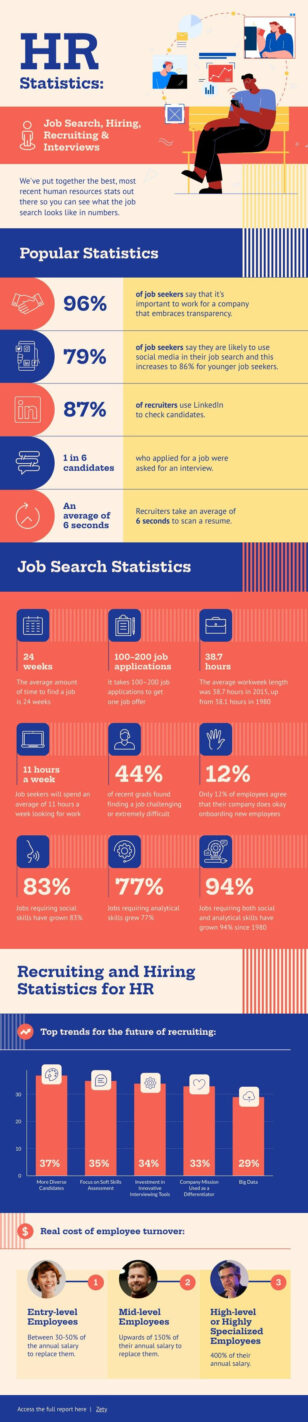
Recruiting and Workplace Trends Report
Infographics
Recruiting and Workplace Trends Report
 Infographics
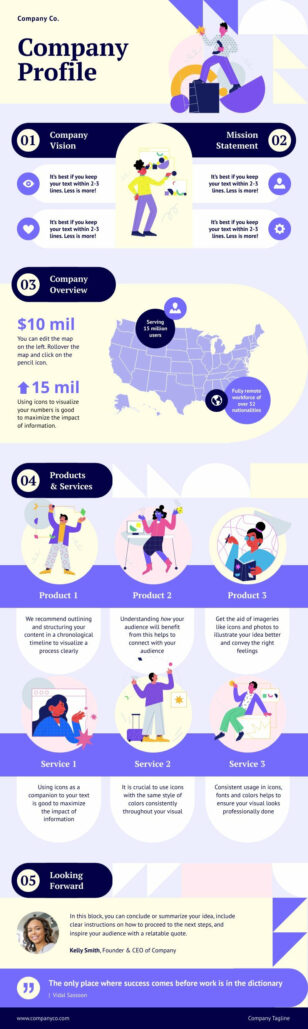
Creative Company Profile
Infographics
Creative Company Profile
 Infographics
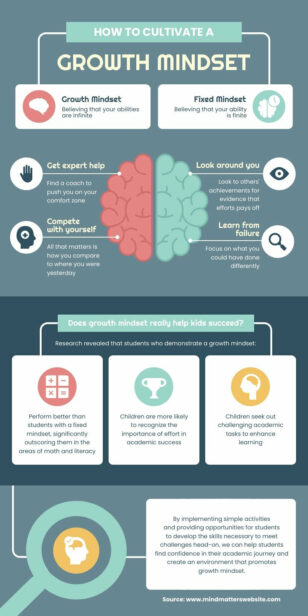
How to Cultivate a Growth Mindset
Infographics
How to Cultivate a Growth Mindset
 Infographics
B2B Graphic Design Statistics and Insights
Infographics
B2B Graphic Design Statistics and Insights
 Infographics
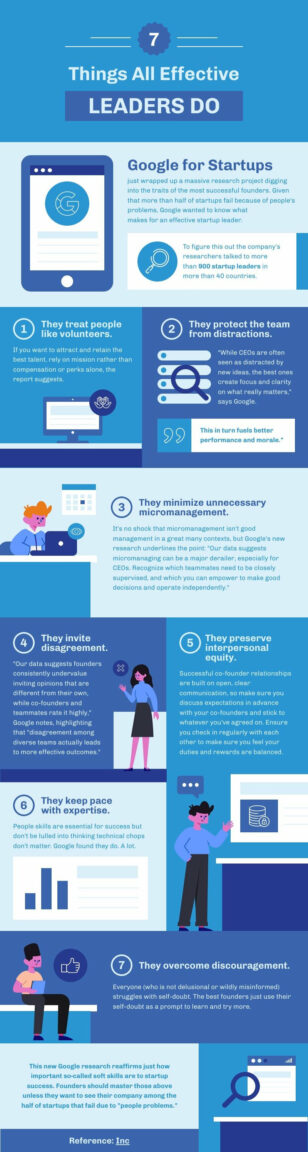
7 Things All Effective Leaders Do
Infographics
7 Things All Effective Leaders Do
 Infographics
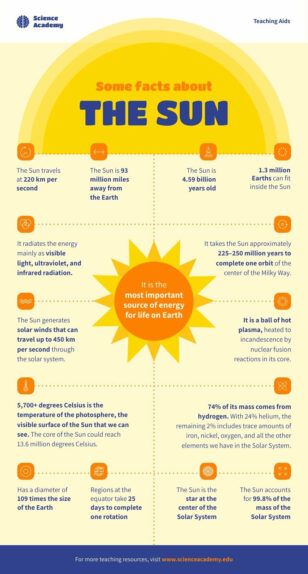
Facts About The Sun
Infographics
Facts About The Sun
 Infographics
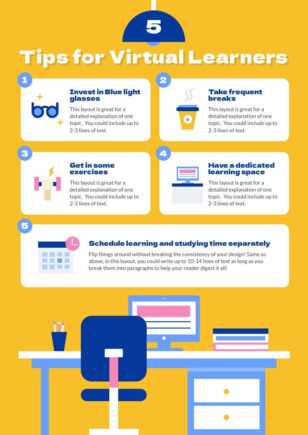
5 Tips for Virtual Learners
Infographics
5 Tips for Virtual Learners
 Infographics
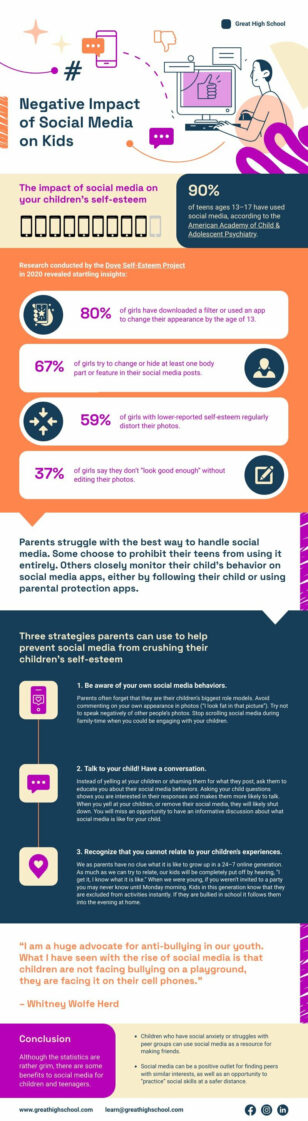
Negative Impact of Social Media on Kids
Infographics
Negative Impact of Social Media on Kids
 Infographics
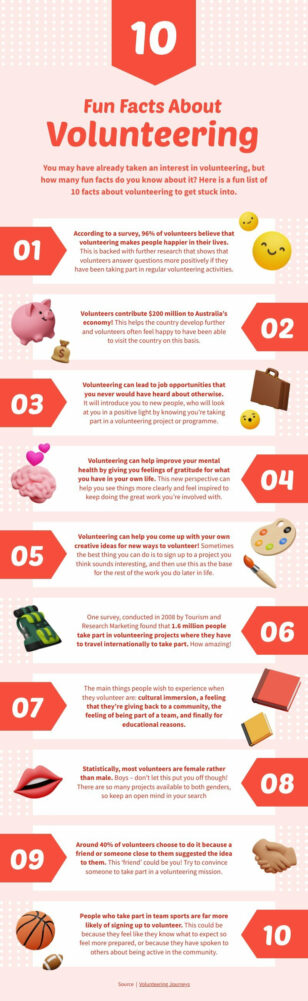
10 Fun Facts About Volunteering
Infographics
10 Fun Facts About Volunteering
 Infographics
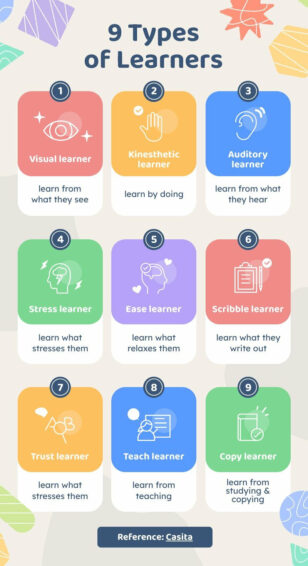
9 Types of Learners
Infographics
9 Types of Learners
 Infographics
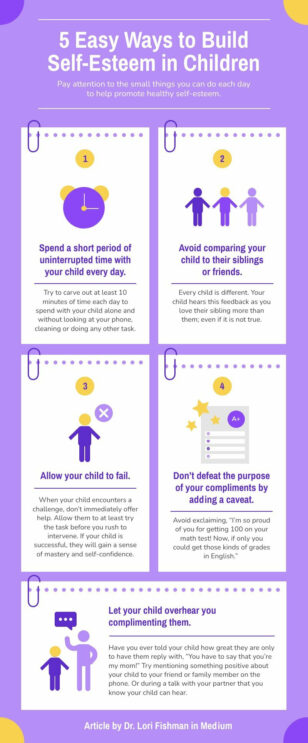
5 Easy Ways to Build Self-Esteem in Children
Infographics
5 Easy Ways to Build Self-Esteem in Children
 Infographics
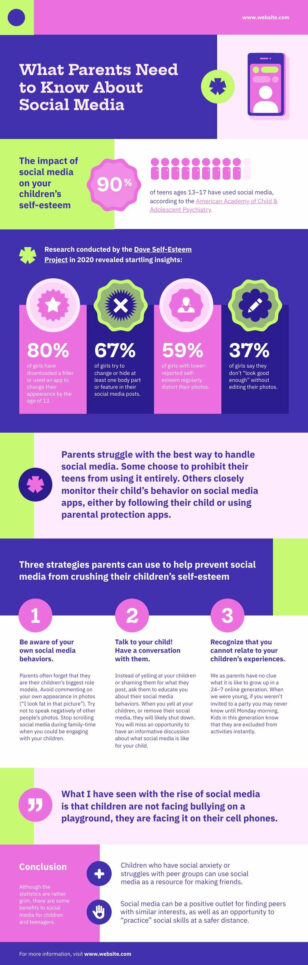
The Impact Of Social Media On Children’s Self-Esteem
Infographics
The Impact Of Social Media On Children’s Self-Esteem
 Infographics
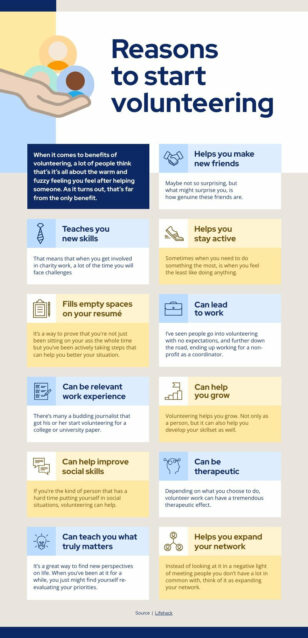
Reasons To Start Volunteering
Infographics
Reasons To Start Volunteering
 Infographics
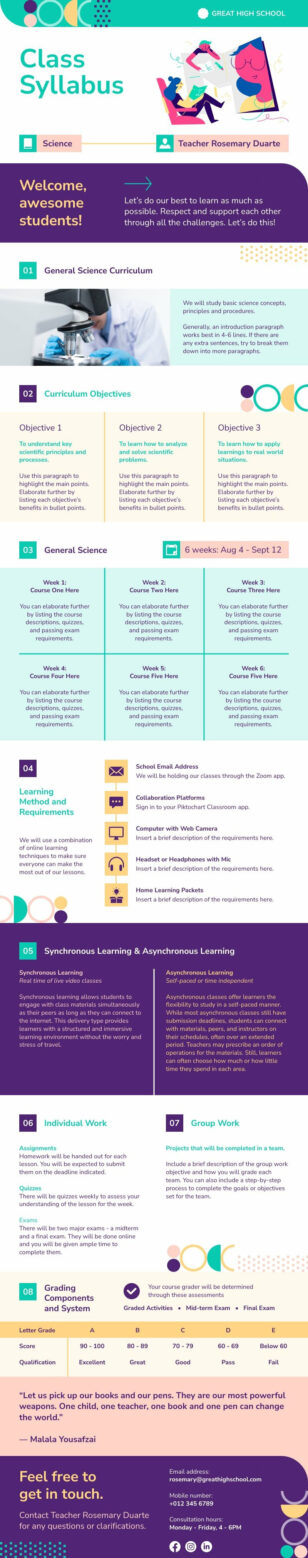
Science Class Syllabus
Infographics
Science Class Syllabus
 Infographics
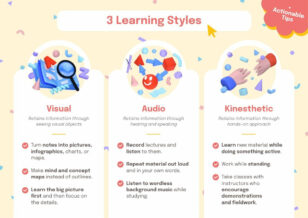
3 Types of Learning Styles
Infographics
3 Types of Learning Styles
 Infographics
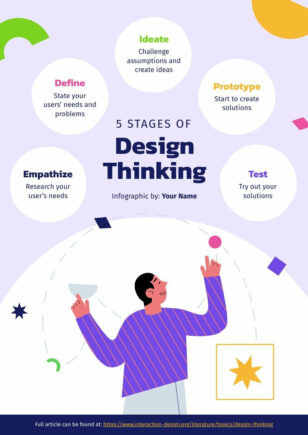
5 Stages of Design Thinking
Infographics
5 Stages of Design Thinking
 Infographics
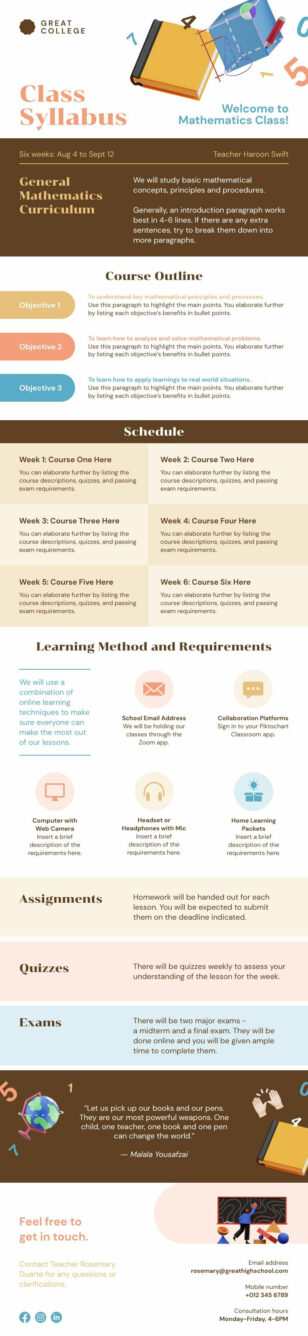
Maths Class Syllabus
Infographics
Impact of Depression on the Immune System Experiment Report
Infographics
The Scientific Method
Infographics
Maths Class Syllabus
Infographics
Impact of Depression on the Immune System Experiment Report
Infographics
The Scientific Method
 Infographics
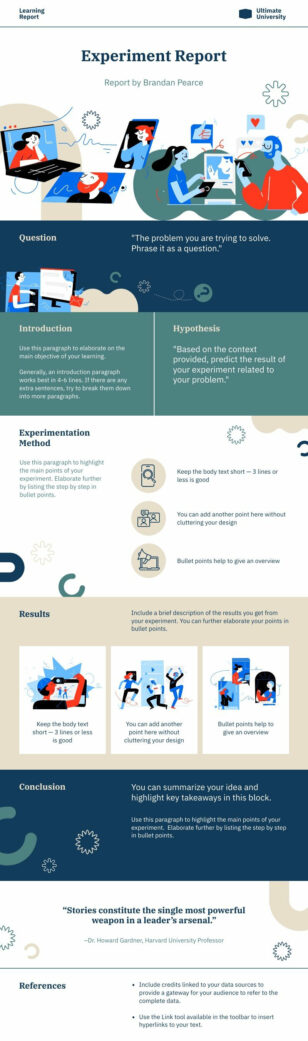
Experiment Report
Infographics
The Teacher’s Guide
Infographics
Experiment Report
Infographics
The Teacher’s Guide
 Infographics
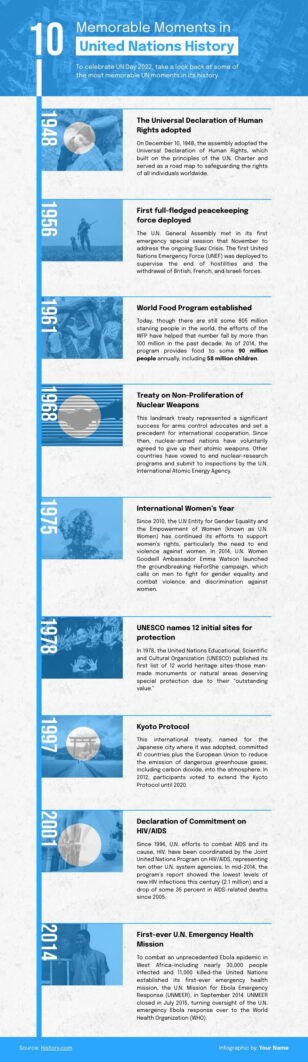
United Nations History
Infographics
United Nations History
 Infographics
Lab Report Template
Infographics
Lab Report Template
 Infographics
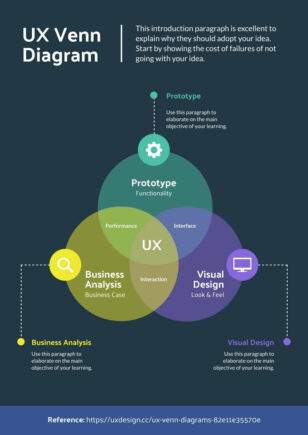
UX Design Jobs Venn Diagram
Infographics
UX Design Jobs Venn Diagram
 Infographics
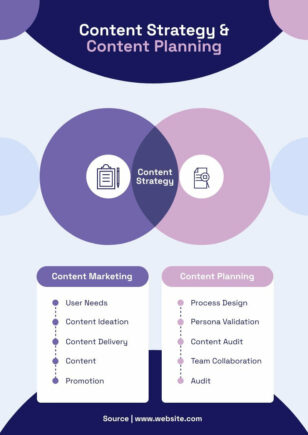
Content Planning Venn Diagram
Infographics
Content Planning Venn Diagram
 Infographics
Educational Infographic
Infographics
Educational Infographic
 Infographics
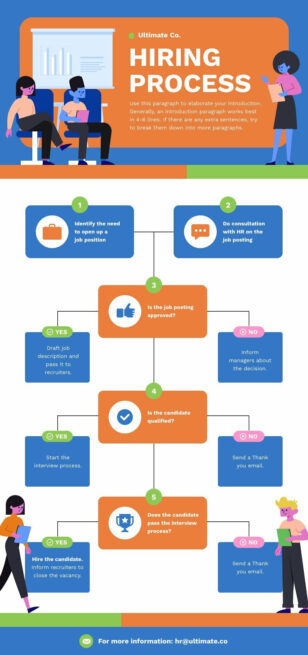
Hiring Process Flowchart
Infographics
Hiring Process Flowchart
 Infographics
Workflow Chart
Infographics
Workflow Chart
 Infographics
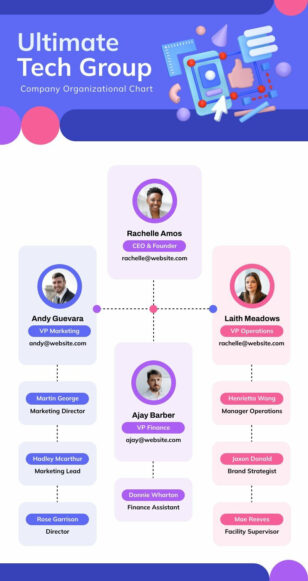
Tech Industry Organizational Chart
Infographics
Tech Industry Organizational Chart
 Infographics
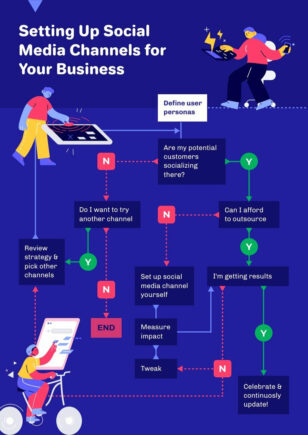
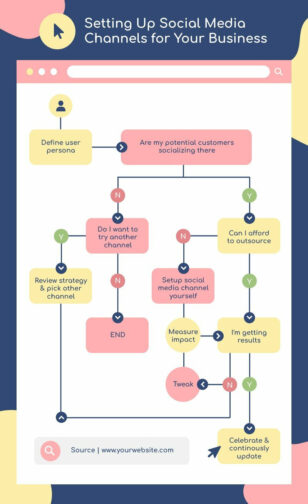
Social Media Flow Diagram
Infographics
Social Media Flow Diagram
 Infographics
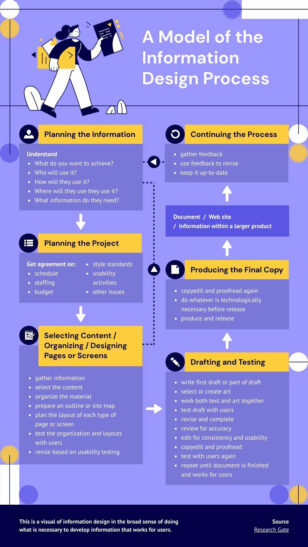
Graphic Design Process Flowchart
Infographics
Graphic Design Process Flowchart
 Infographics
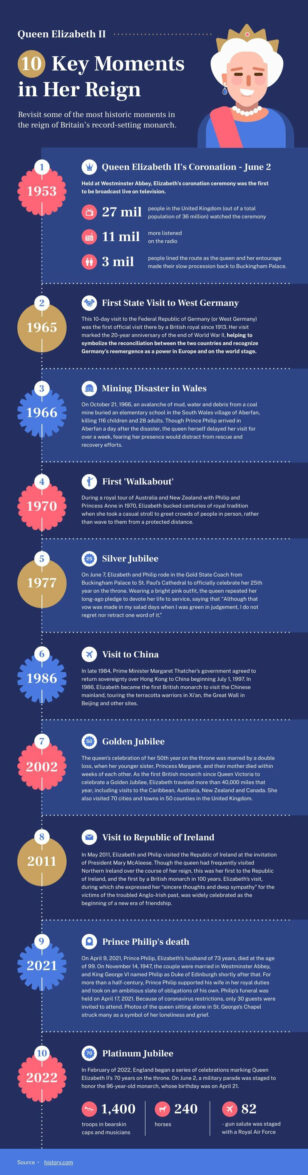
Queen Elizabeth Life Events
Infographics
Queen Elizabeth Life Events
 Infographics
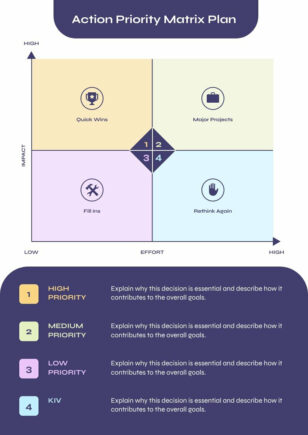
Graph Quadrants
Infographics
Graph Quadrants
 Infographics
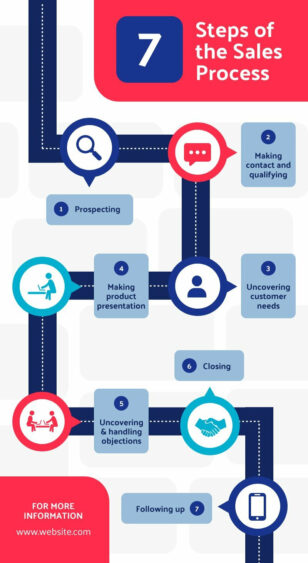
Sales Process Flow Chart
Infographics
Sales Process Flow Chart
 Infographics
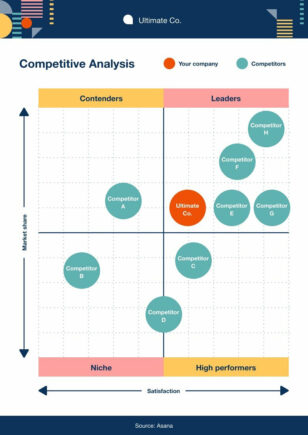
Competitive Analysis Quadrant Graph
Infographics
Competitive Analysis Quadrant Graph
 Infographics
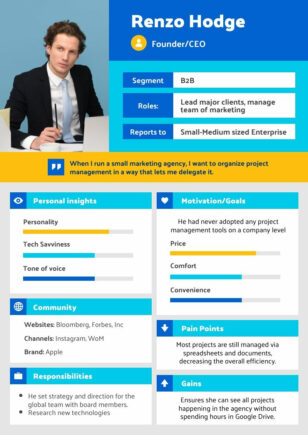
User Persona
Infographics
User Persona
 Infographics
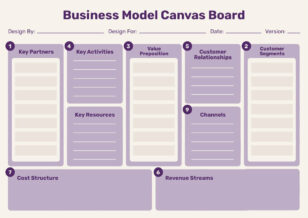
Business Model Canvas Board
Infographics
Business Model Canvas Board
 Infographics
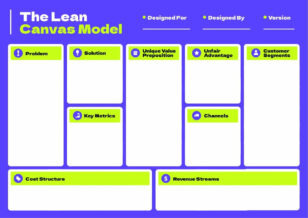
Lean Canvas Model
Infographics
Lean Canvas Model
 Infographics
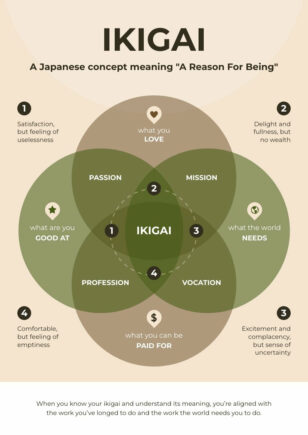
Ikigai 4-Way Venn Diagram
Infographics
Ikigai 4-Way Venn Diagram
 Infographics
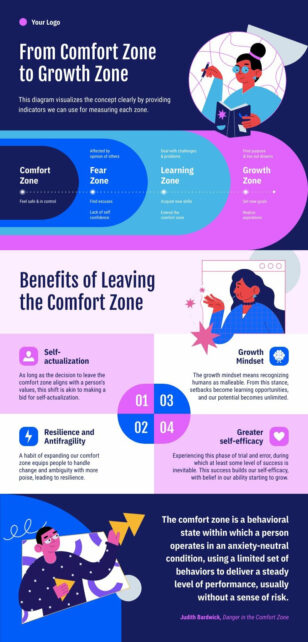
Growth Zone Venn Diagram
Infographics
Growth Zone Venn Diagram
 Infographics
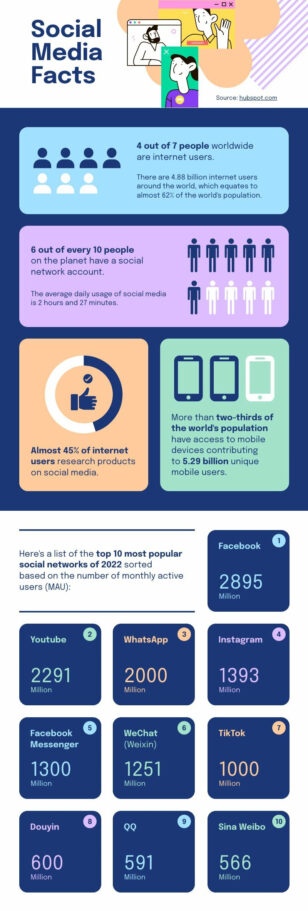
Social Media Facts Pictogram
Infographics
Social Media Facts Pictogram
 Infographics
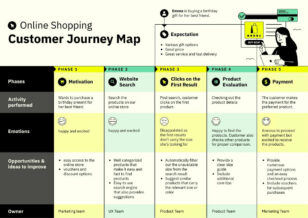
eCommerce Customer Journey Map
Infographics
eCommerce Customer Journey Map
 Infographics
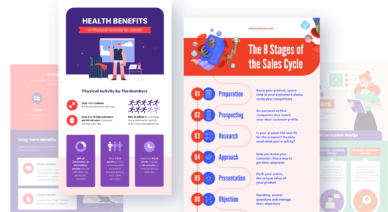
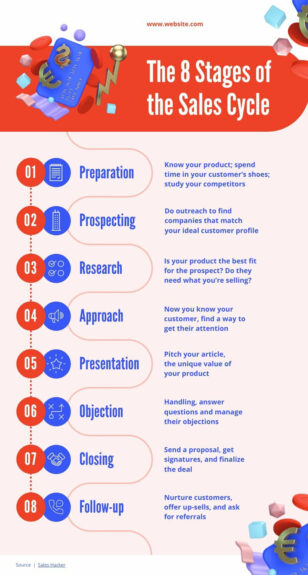
Sales Cycle Flowchart
Infographics
Sales Cycle Flowchart
 Infographics
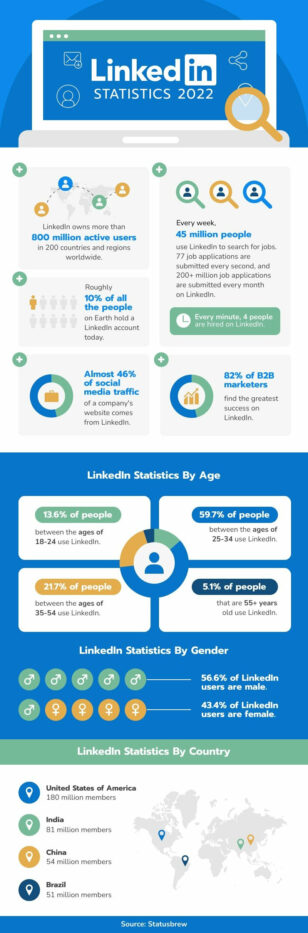
LinkedIn Statistics Pictogram
Infographics
LinkedIn Statistics Pictogram
 Infographics
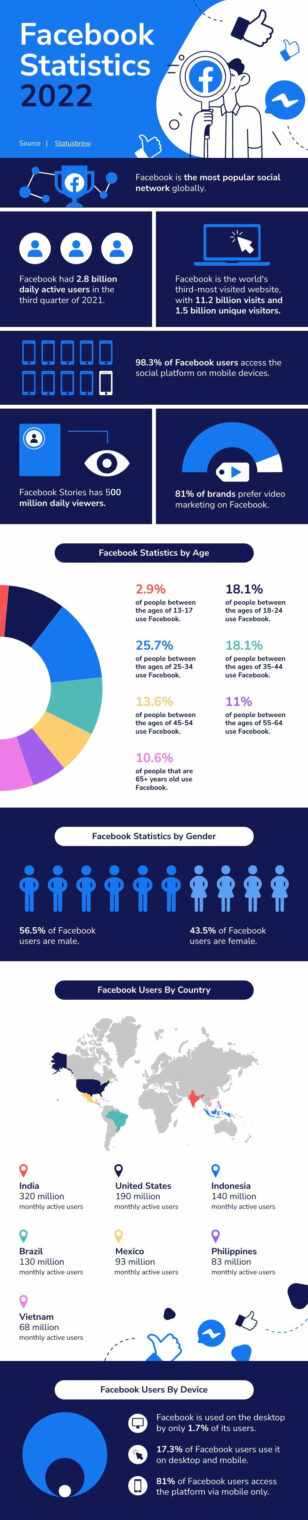
Facebook Statistics Pictogram
Infographics
Facebook Statistics Pictogram
 Infographics
Career Mapping
Infographics
Career Mapping
 Infographics
By The Numbers
Infographics
By The Numbers
 Infographics
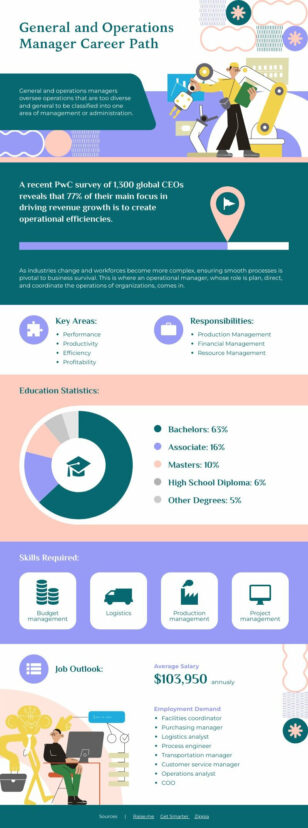
Career Path
Infographics
Career Path
 Infographics
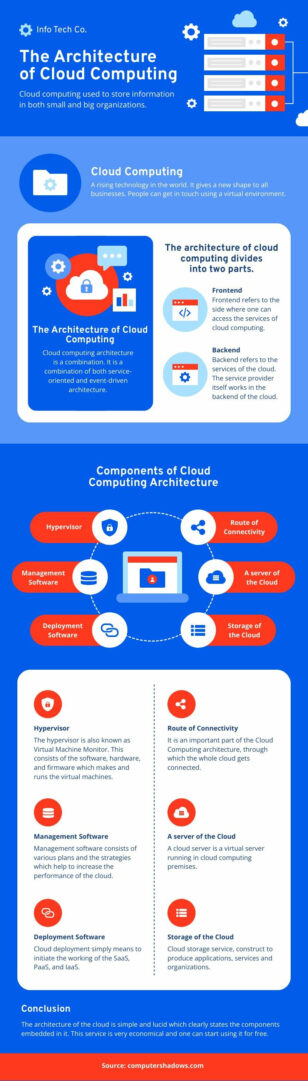
Cloud Computing Architecture
Infographics
Cloud Computing Architecture
 Infographics
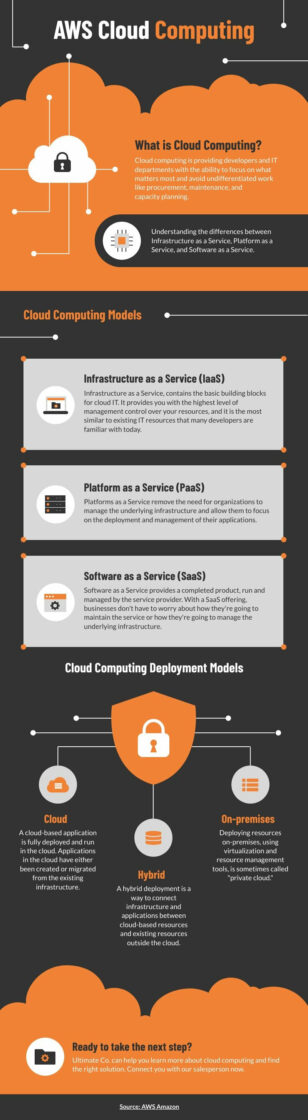
AWS Cloud Computing
Infographics
AWS Cloud Computing
 Infographics
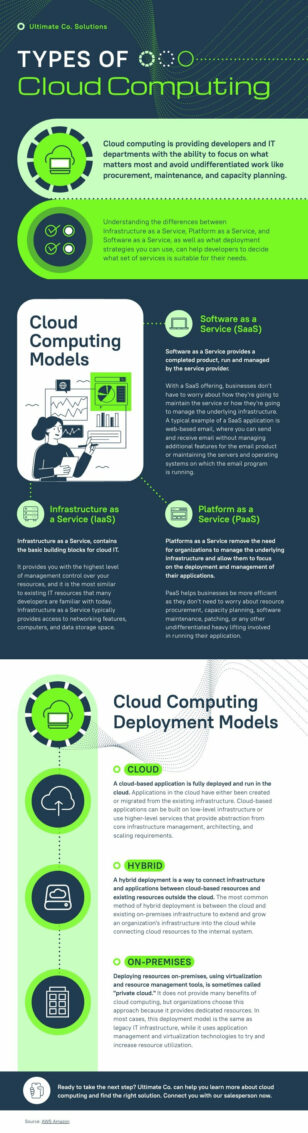
Types of Cloud Computing
Infographics
Types of Cloud Computing
 Infographics
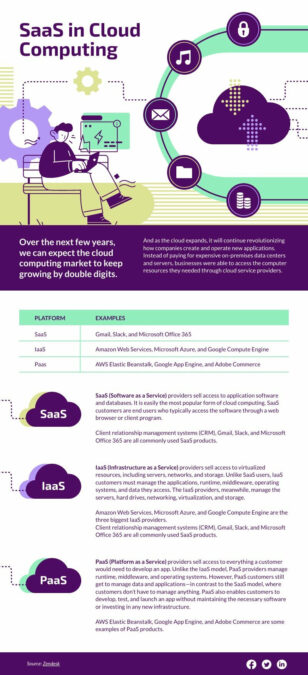
SaaS in Cloud Computing
Infographics
SaaS in Cloud Computing
 Infographics
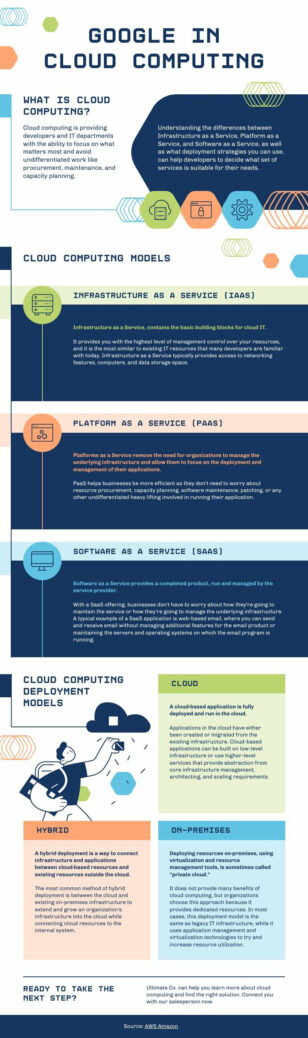
Google in Cloud Computing
Infographics
Google in Cloud Computing
 Infographics
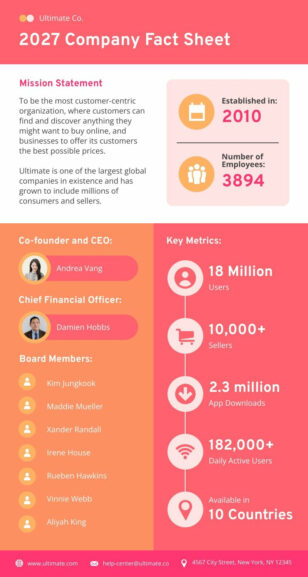
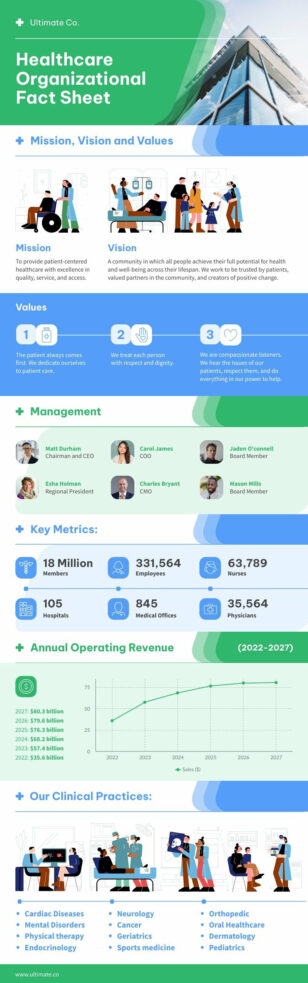
Company Fact Sheet
Infographics
Company Fact Sheet
 Infographics
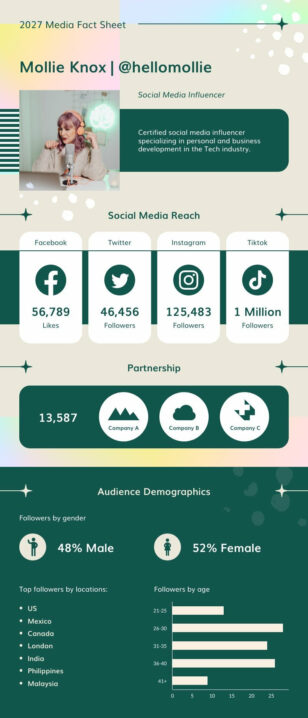
Media Kit Fact Sheet
Infographics
Media Kit Fact Sheet
 Infographics
Business Fact Sheet
Infographics
Health Benefits of Physical Activity
Infographics
Business Fact Sheet
Infographics
Health Benefits of Physical Activity
 Infographics
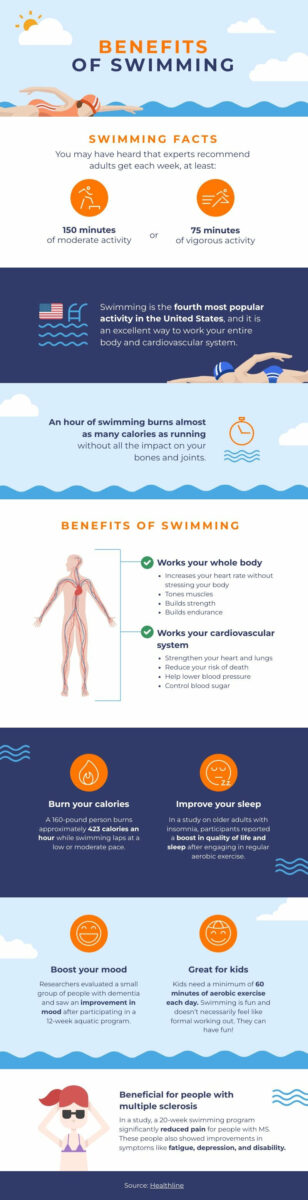
Benefits of Swimming
Infographics
Benefits of Swimming
Simplify Complex Information with Professional Infographics
Infographics are one of the most effective ways to communicate data, processes, and comparisons at a glance. Whether you’re creating a statistical infographic for a blog post, a timeline for a project update, or a comparison chart for a sales deck, starting with a professionally designed template saves hours of layout work.
Piktochart’s infographic templates cover every popular format: statistical, informational, timeline, process, geographic, comparison, and list-based. Each layout is built with visual hierarchy in mind so your audience absorbs the most important points first. Add your own data, swap icons, adjust the color scheme to your brand, and your infographic is ready to publish.
Educators use these templates to create classroom handouts that students actually read. Marketing teams turn quarterly reports into shareable social assets. HR departments visualize onboarding processes so new hires get up to speed faster. The use cases are as varied as the data you need to communicate.
Need an infographic in seconds? Try Piktochart’s AI-powered editor — describe what you need, and get a fully editable starting point instantly.