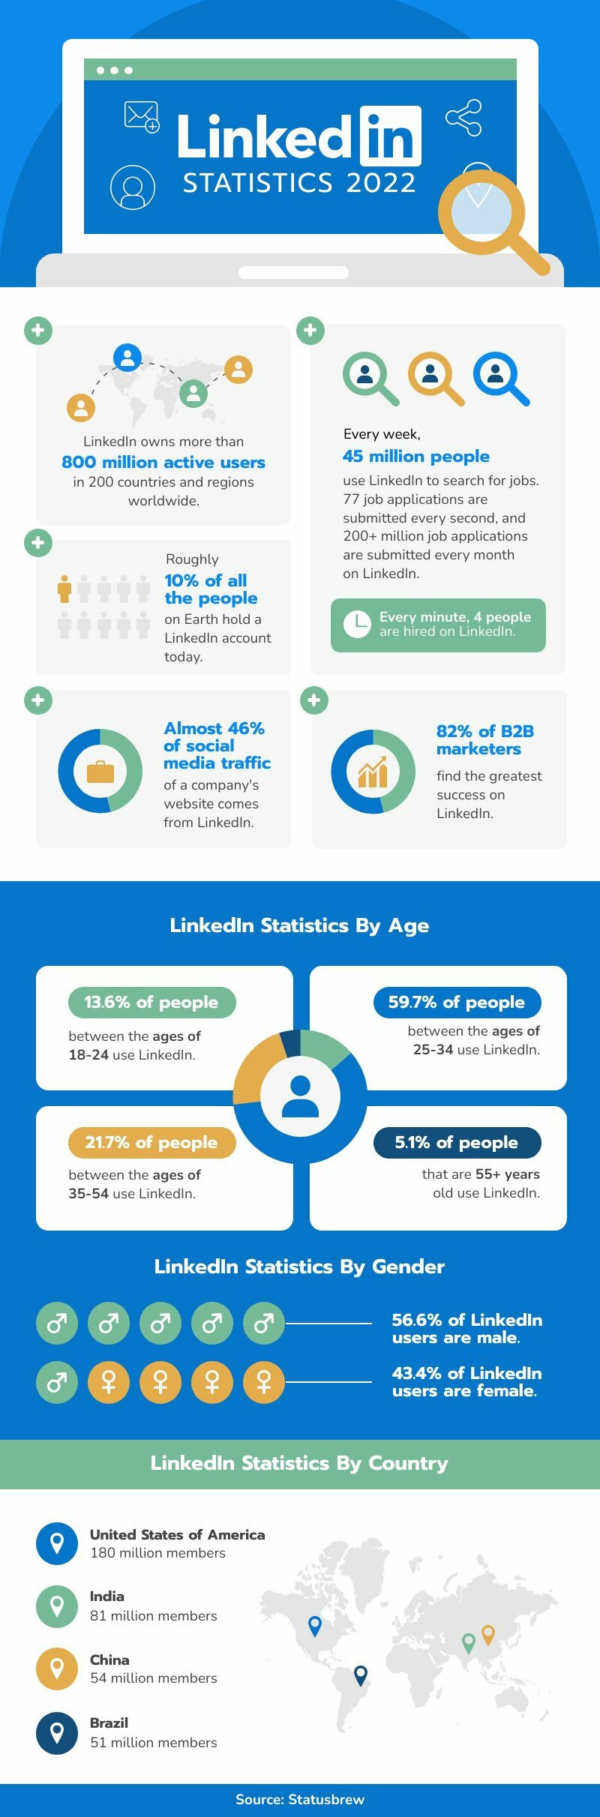
LinkedIn Statistics Pictogram
Infographics
Edit for freeYou'll be asked to log in or sign up for a free Piktochart account first.
Create a LinkedIn statistics pictogram by using this free infographic template designed by Piktochart. With blue, green, and yellow, the infographic is perfect for visualizing data and efficiently presenting statistics. Utilize the maps feature to showcase the demographic of your statistics. Edit and customize the infographic template online and download it as a PDF or PNG when it's complete. Try it for free with Piktochart.
Available File Type
Customization
100% customizable
Tags
More Templates Like This
 Infographics
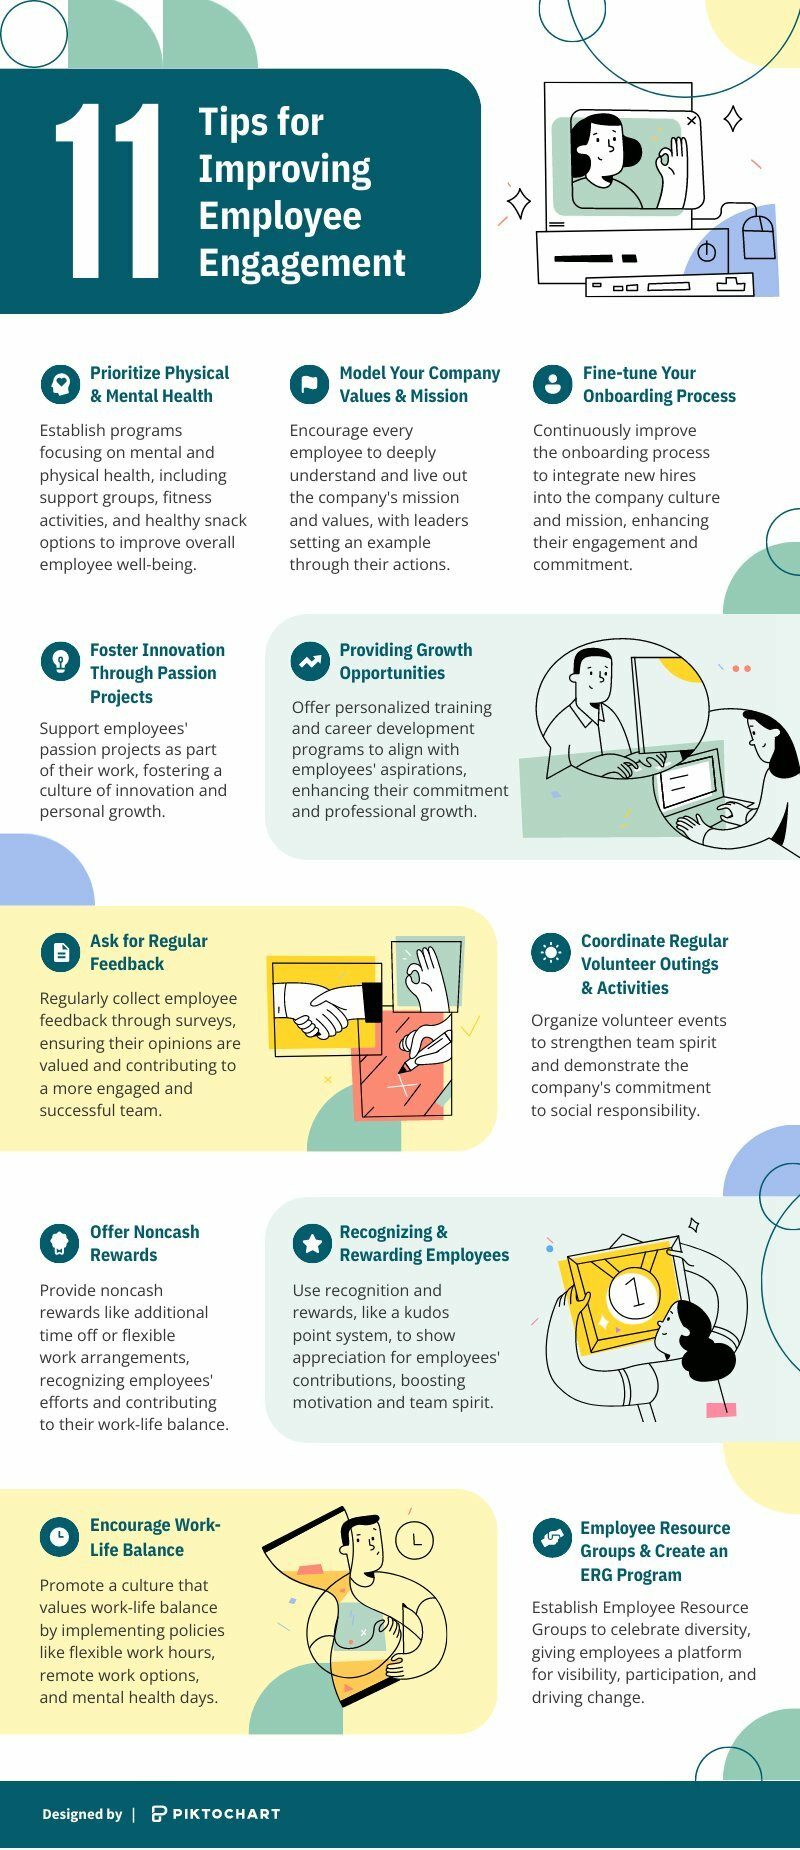
Tips for Improving Employee Engagement
Infographics
Tips for Improving Employee Engagement
 Infographics
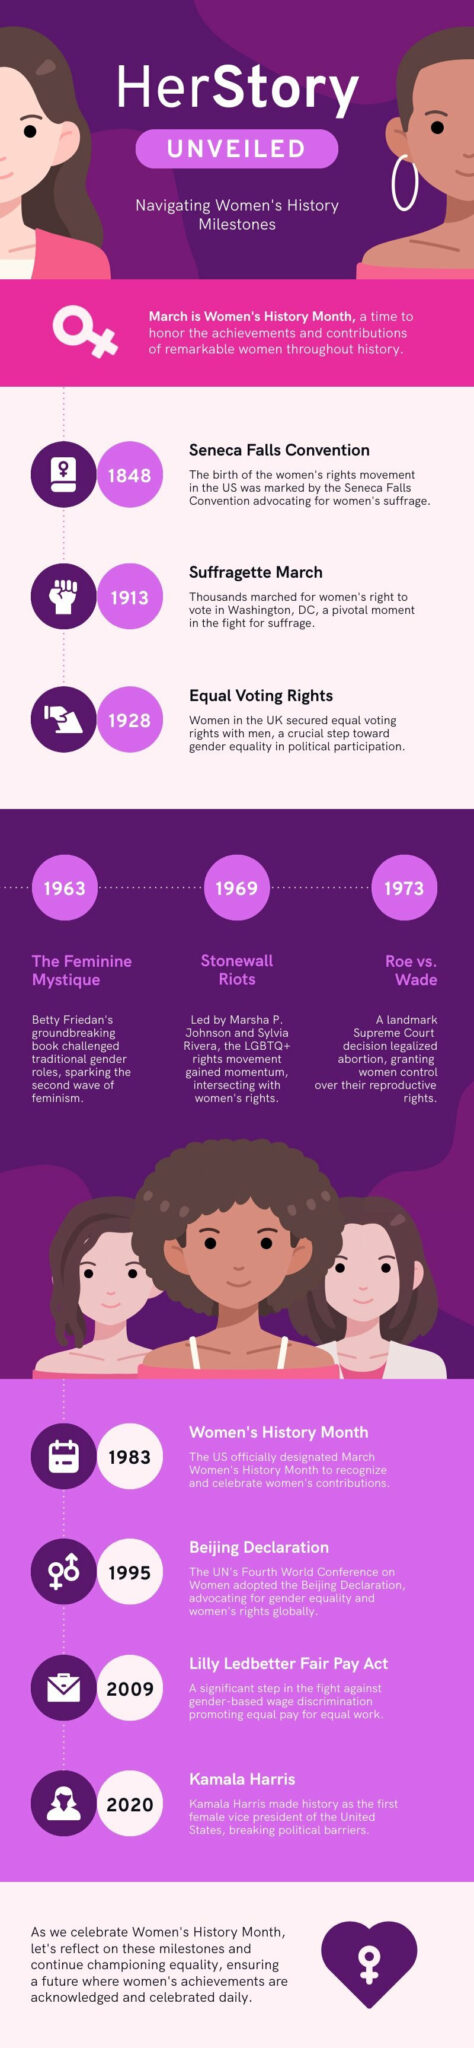
International Women’s Day Infographic
Infographics
International Women’s Day Infographic
 Infographics
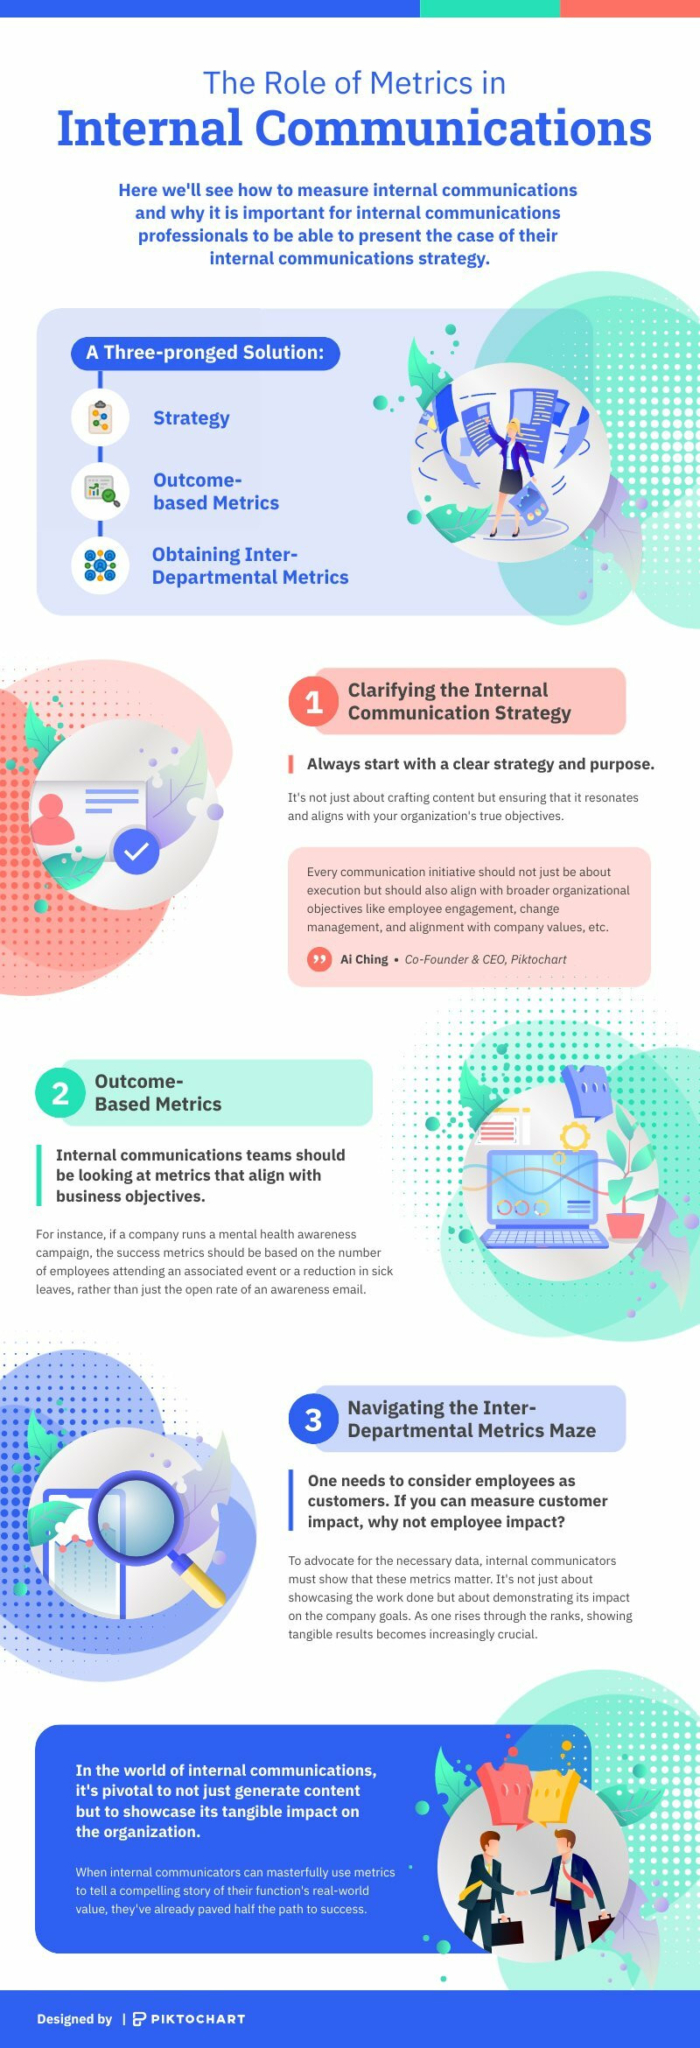
The Role Of Metrics In Internal Communications
Infographics
The Role Of Metrics In Internal Communications
 Infographics
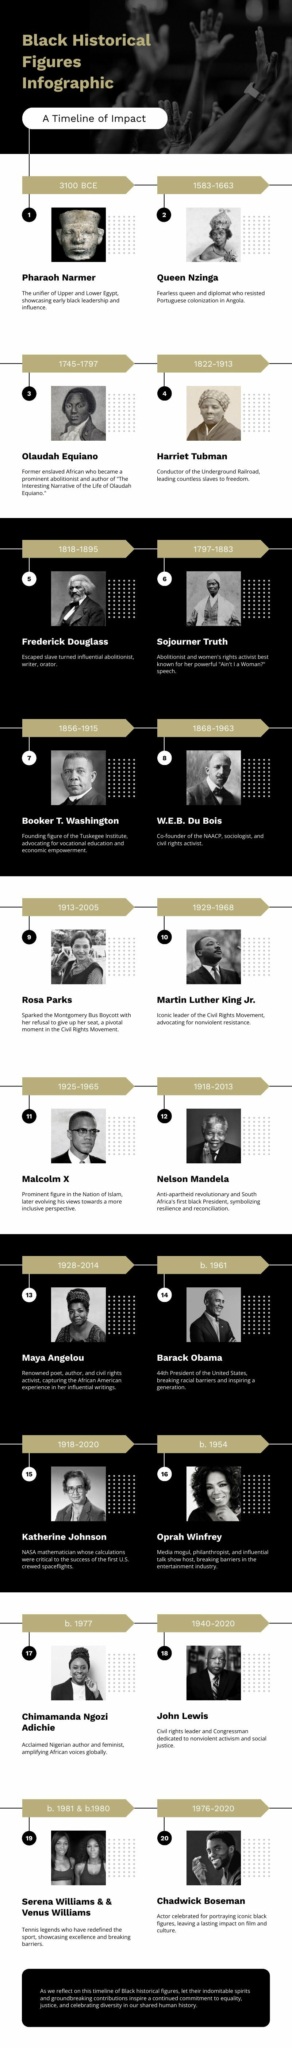
Black Historical Figures Infographic
Infographics
Black Historical Figures Infographic
 Infographics
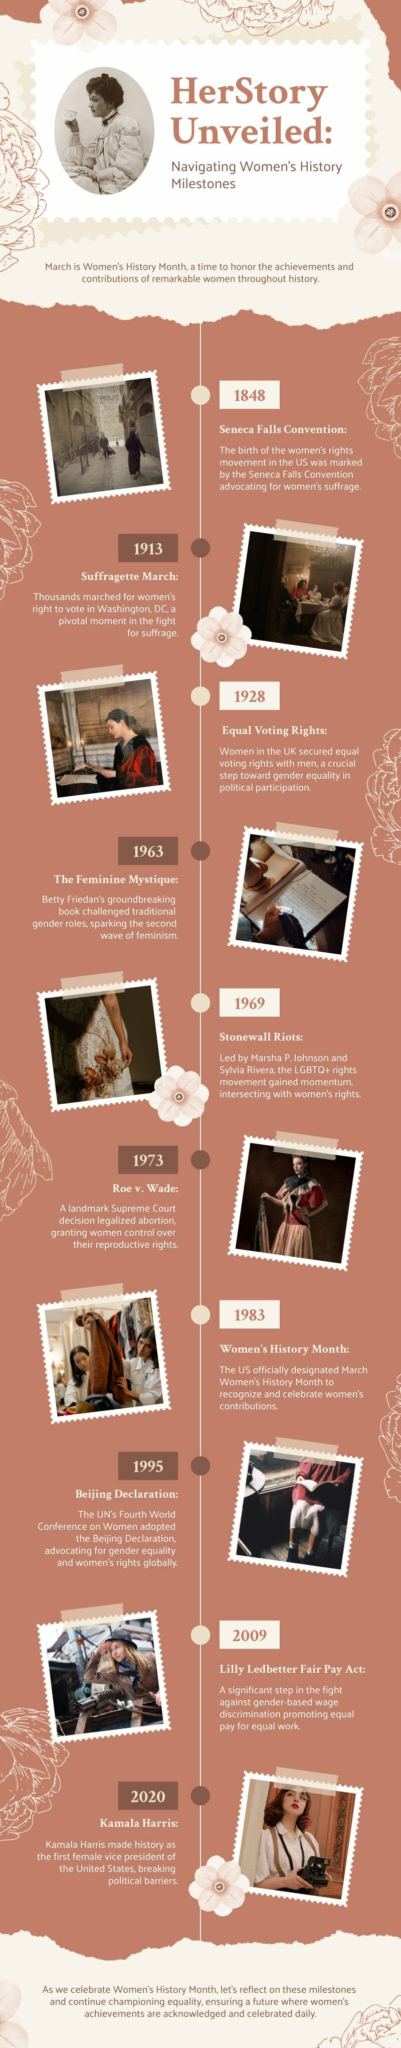
Facts About Women’s History Month
Infographics
Facts About Women’s History Month
 Infographics
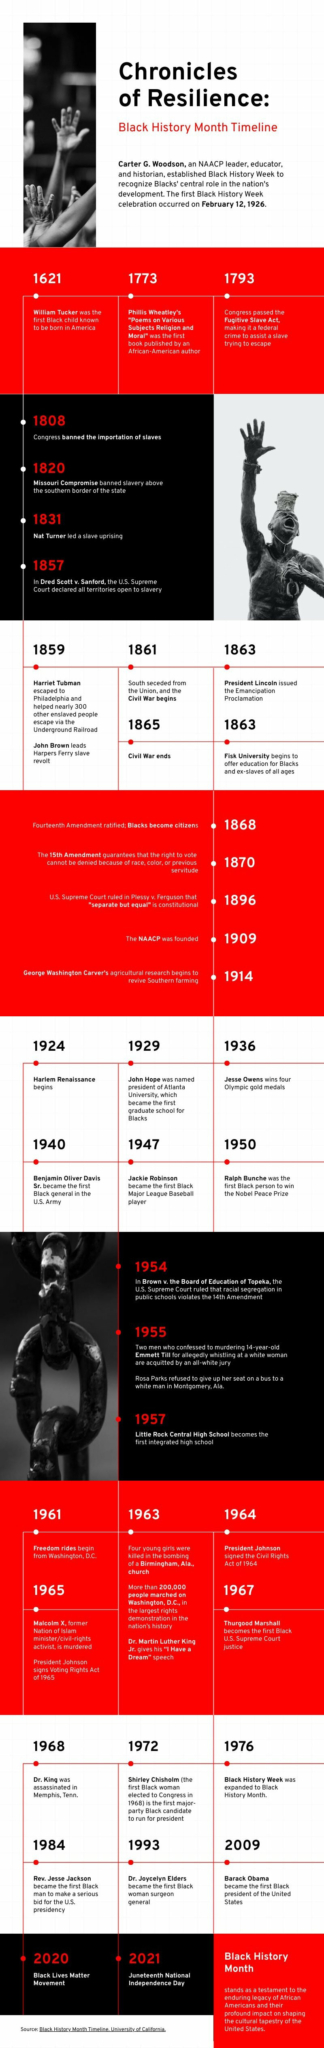
History of Black History Month Infographic
Infographics
History of Black History Month Infographic
 Infographics
What Jobs Will AI Replace
Infographics
What Jobs Will AI Replace
 Infographics
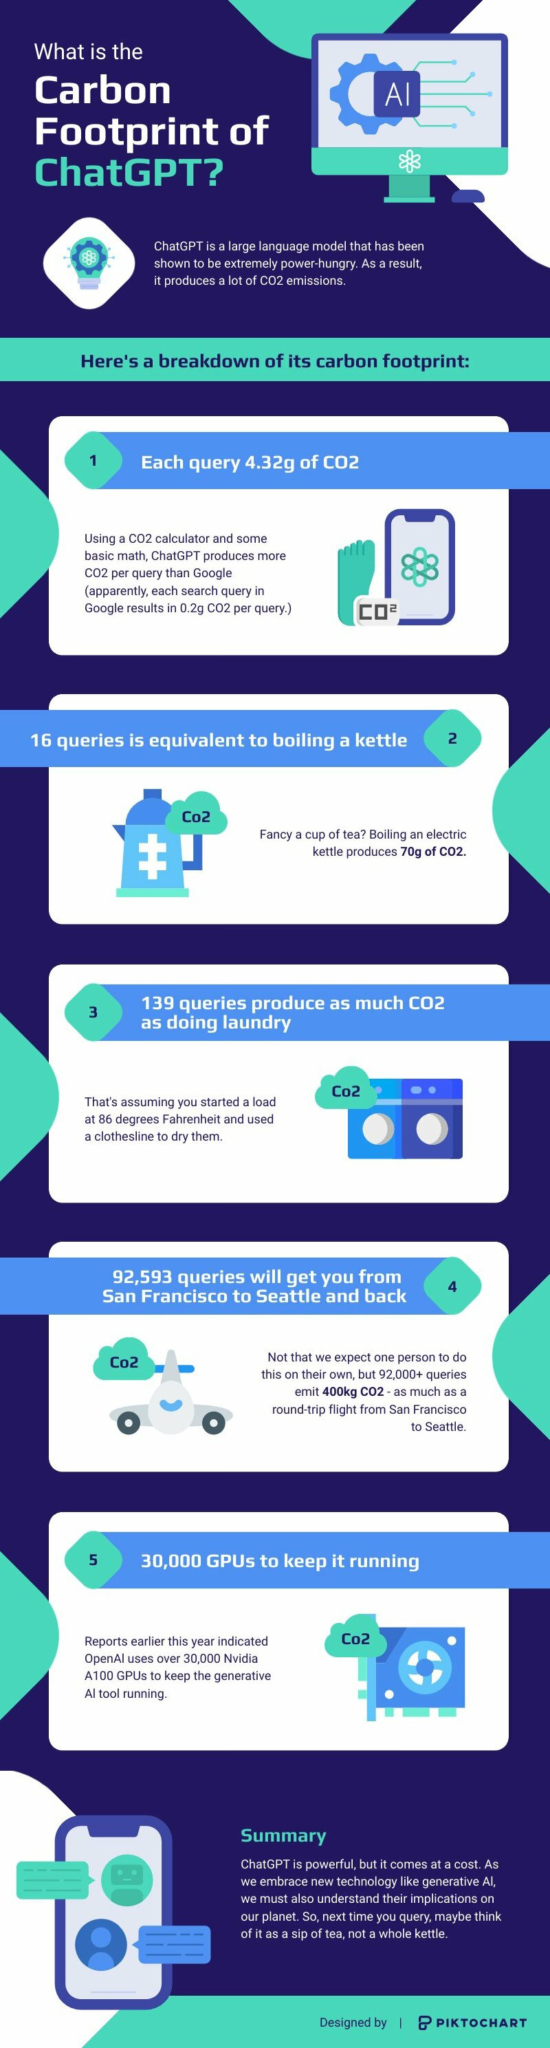
AI Carbon Footprint
Infographics
AI Carbon Footprint
 Infographics
Modern Mental Health Statistics
Infographics
Modern Mental Health Statistics
 Infographics
Artificial Intelligence Statistics
Infographics
Artificial Intelligence Statistics
 Infographics
Mental Health Facts
Infographics
Mental Health Facts
 Infographics
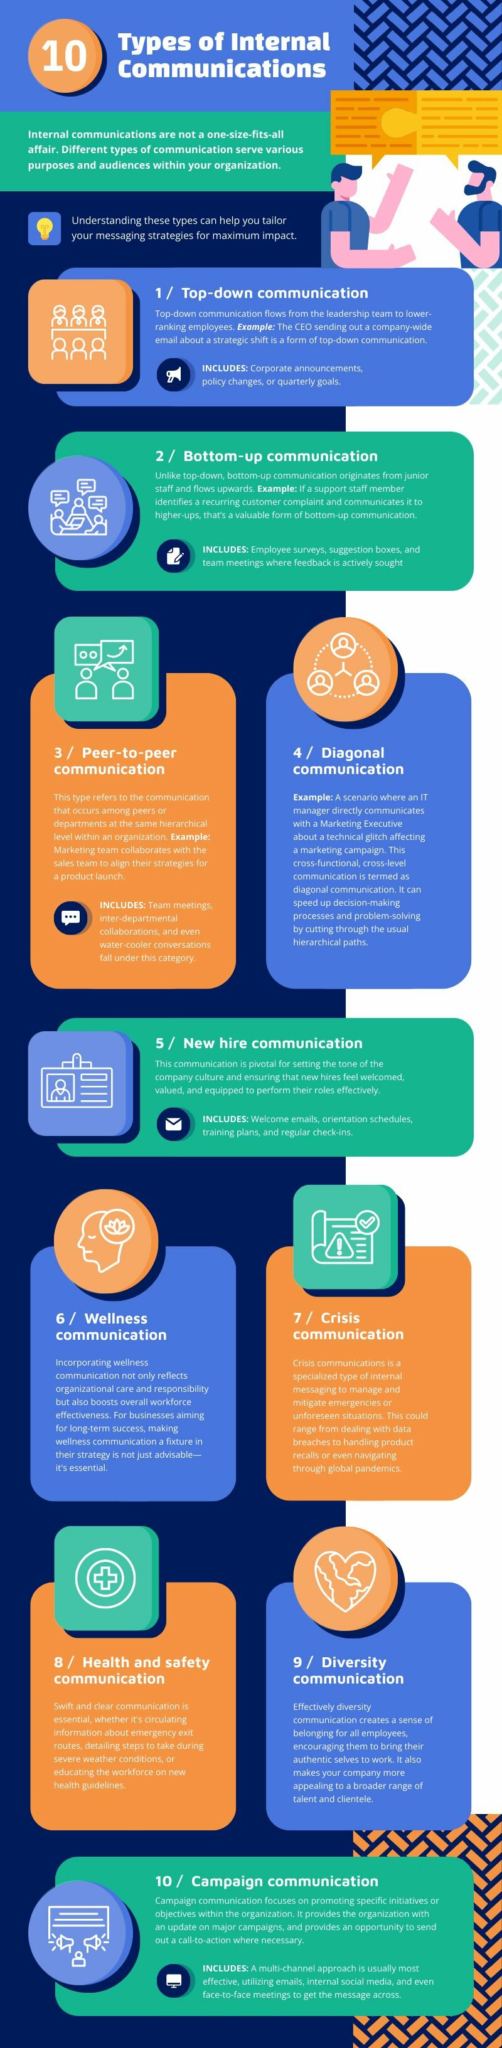
Types of Internal Communications
Infographics
Types of Internal Communications