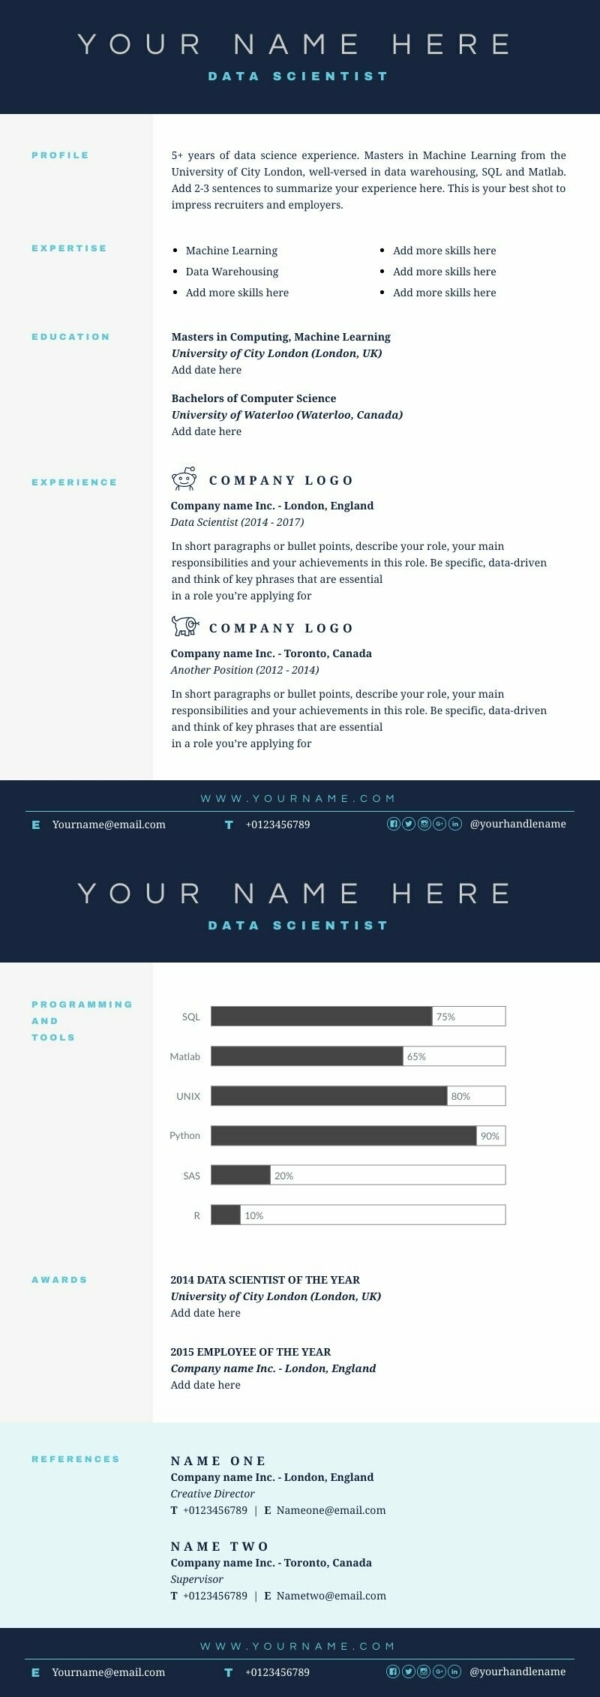
CV Data Scientist
Resumes
Edit for freeYou'll be asked to log in or sign up for a free Piktochart account first.
Build a professional resume by using the CV Data Scientist Resume template by Piktochart. It is a simple yet effective layout where you can list down your skills. It comes with a pre-placed text that can act as a guide to write your own texts. Plus, you can customize each section, including font, size, and color, as per your needs. Once you are done with editing, you can download this template in PDF format. Try it now!
Available File Type
Customization
100% customizable
Tags
More Templates Like This
 Resumes
White Minimalist ATS Resume
Resumes
White Minimalist ATS Resume
 Resumes
White Simple ATS Resume
Resumes
White Simple ATS Resume
 Resumes
Minimalist ATS Resume
Resumes
Minimalist ATS Resume
 Resumes
Professional ATS Resume
Resumes
Professional ATS Resume
 Resumes
Medical CV
Resumes
Medical CV
 Resumes
Modern Tech Resume
Resumes
Modern Tech Resume
 Resumes
Modern Job Cover Letter
Resumes
Modern Job Cover Letter
 Resumes
Modern Banker Resume
Resumes
Modern Banker Resume
 Resumes
Artistic Cover Letter
Resumes
Artistic Cover Letter
 Resumes
Marketing Job Application Letter
Resumes
Marketing Job Application Letter
 Resumes
Aesthetic Sales CV
Resumes
Aesthetic Sales CV
 Resumes
Developer Cover Letter
Resumes
Developer Cover Letter