
CV UX Research
Resumes
Edit for freeYou'll be asked to log in or sign up for a free Piktochart account first.
For all the UX researchers looking for a CV that matches your style and level of creativity, Piktochart presents its UX researcher CV template. The multi-page CV offers you an area to share everything from your educational history to your best work. It also has a graph that you can use along with a number of other attractive graphics and icons. Simply adjust the element according to your needs, download the CV in PDF or PNG format, and you are good to go. Try now!
Available File Type
Customization
100% customizable
Tags
More Templates Like This
 Resumes
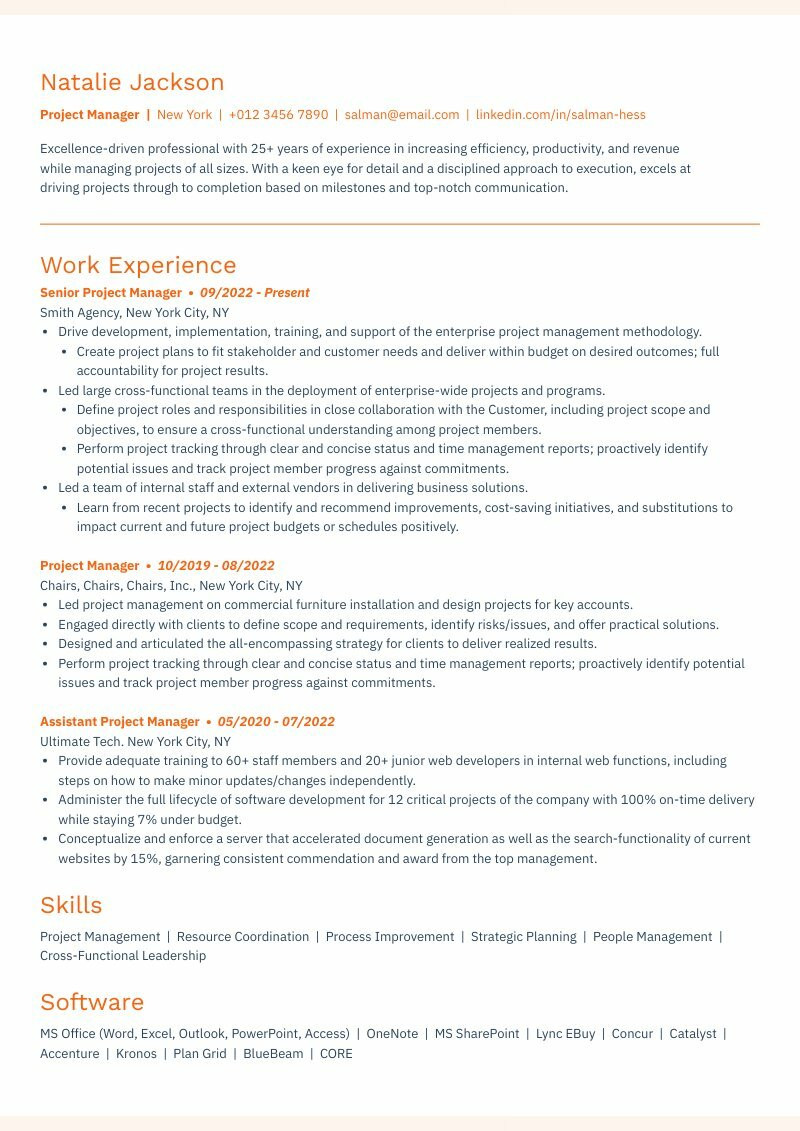
White Minimalist ATS Resume
Resumes
White Minimalist ATS Resume
 Resumes
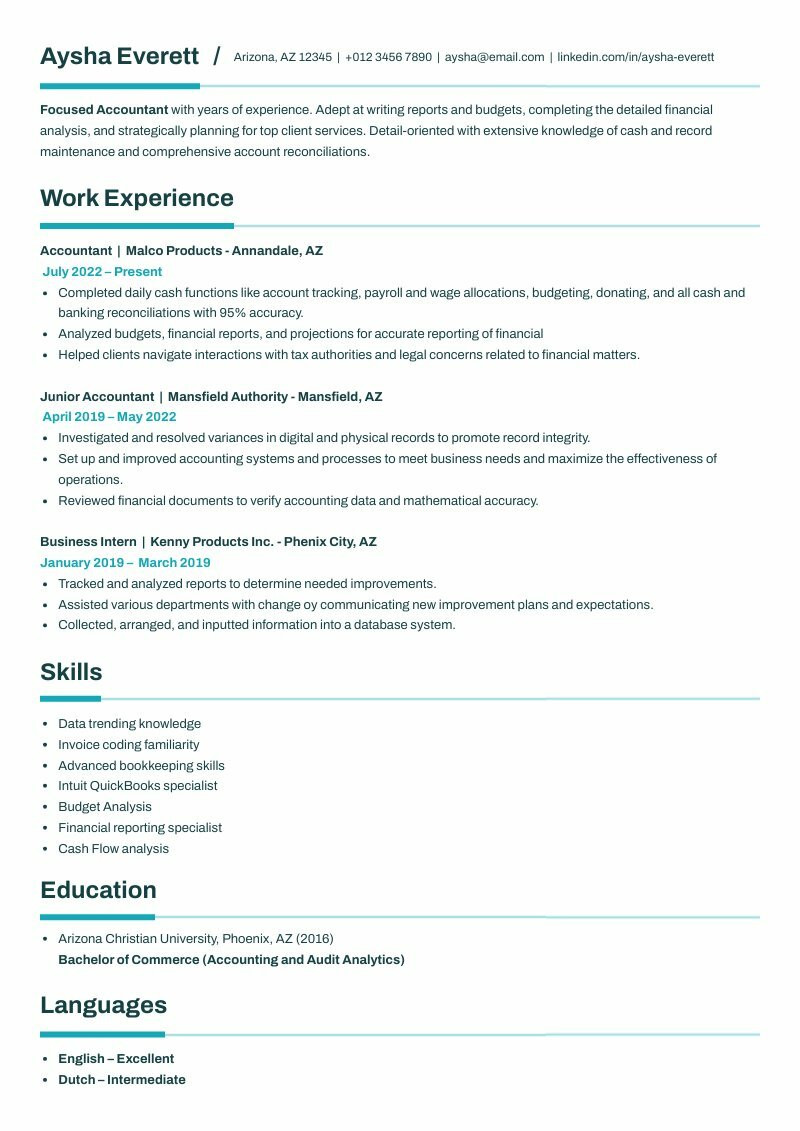
White Simple ATS Resume
Resumes
White Simple ATS Resume
 Resumes
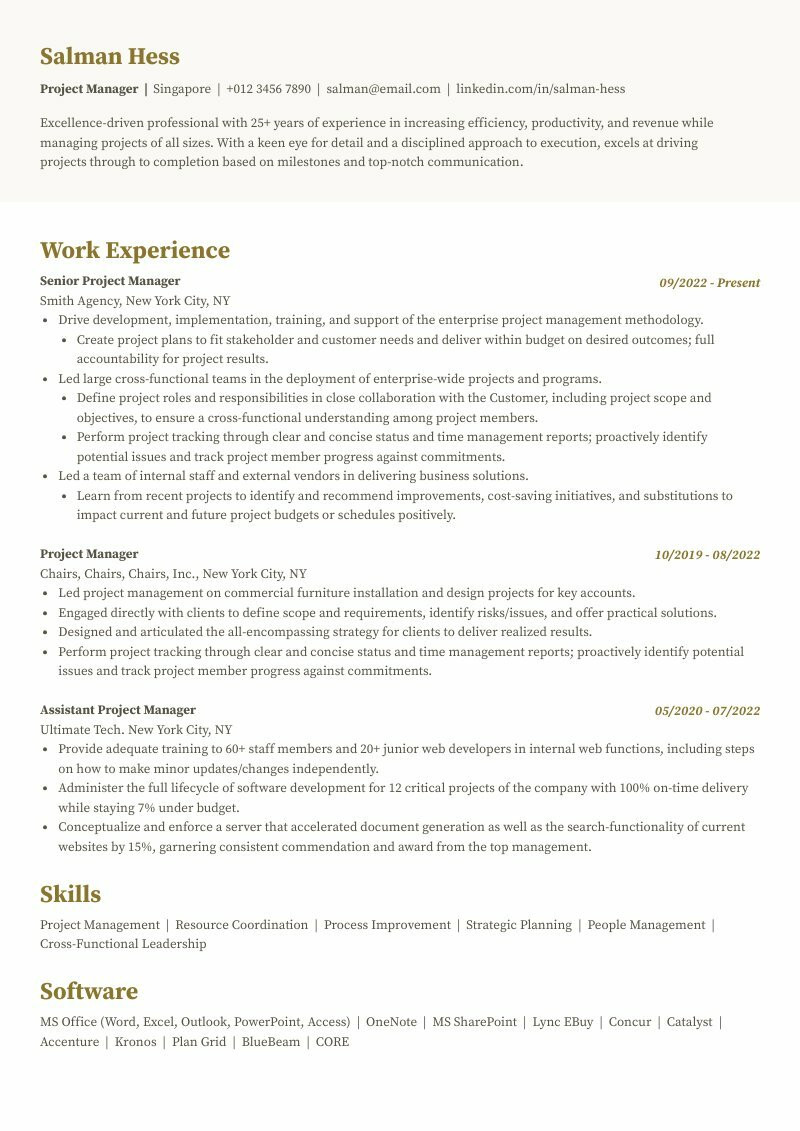
Minimalist ATS Resume
Resumes
Minimalist ATS Resume
 Resumes
Professional ATS Resume
Resumes
Professional ATS Resume
 Resumes
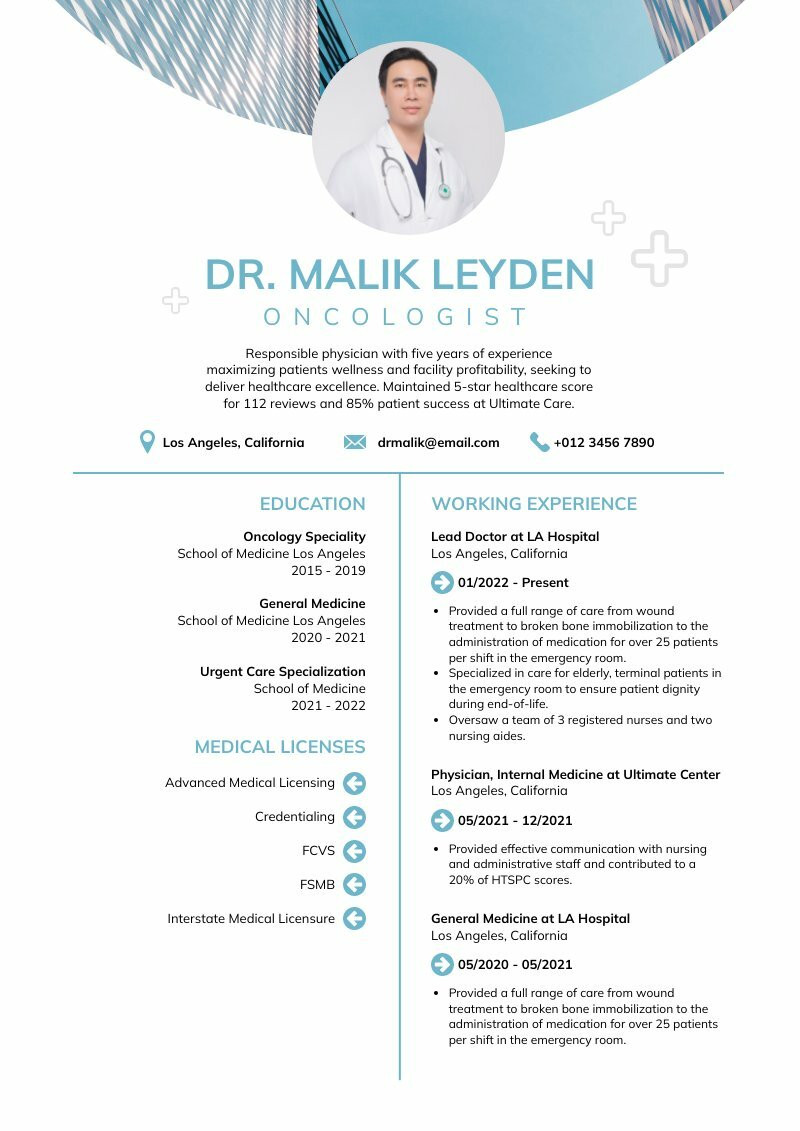
Medical CV
Resumes
Medical CV
 Resumes
Modern Tech Resume
Resumes
Modern Tech Resume
 Resumes
Modern Job Cover Letter
Resumes
Modern Job Cover Letter
 Resumes
Modern Banker Resume
Resumes
Modern Banker Resume
 Resumes
Artistic Cover Letter
Resumes
Artistic Cover Letter
 Resumes
Marketing Job Application Letter
Resumes
Marketing Job Application Letter
 Resumes
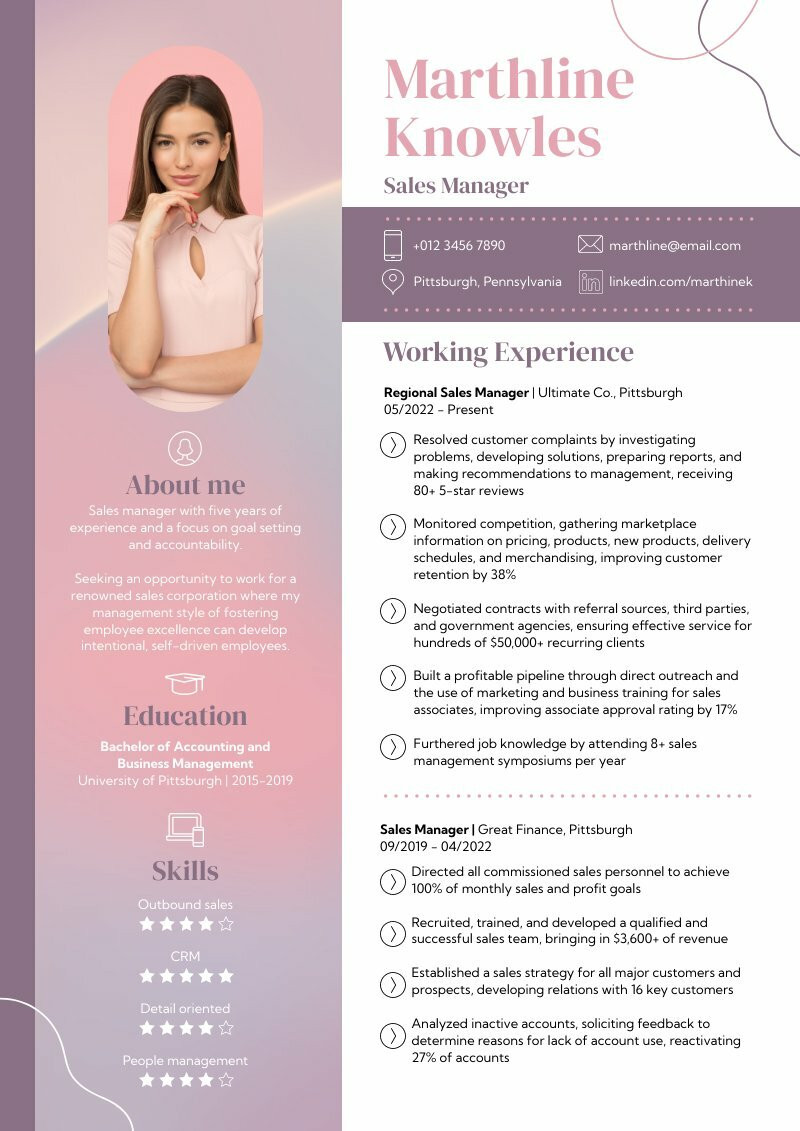
Aesthetic Sales CV
Resumes
Aesthetic Sales CV
 Resumes
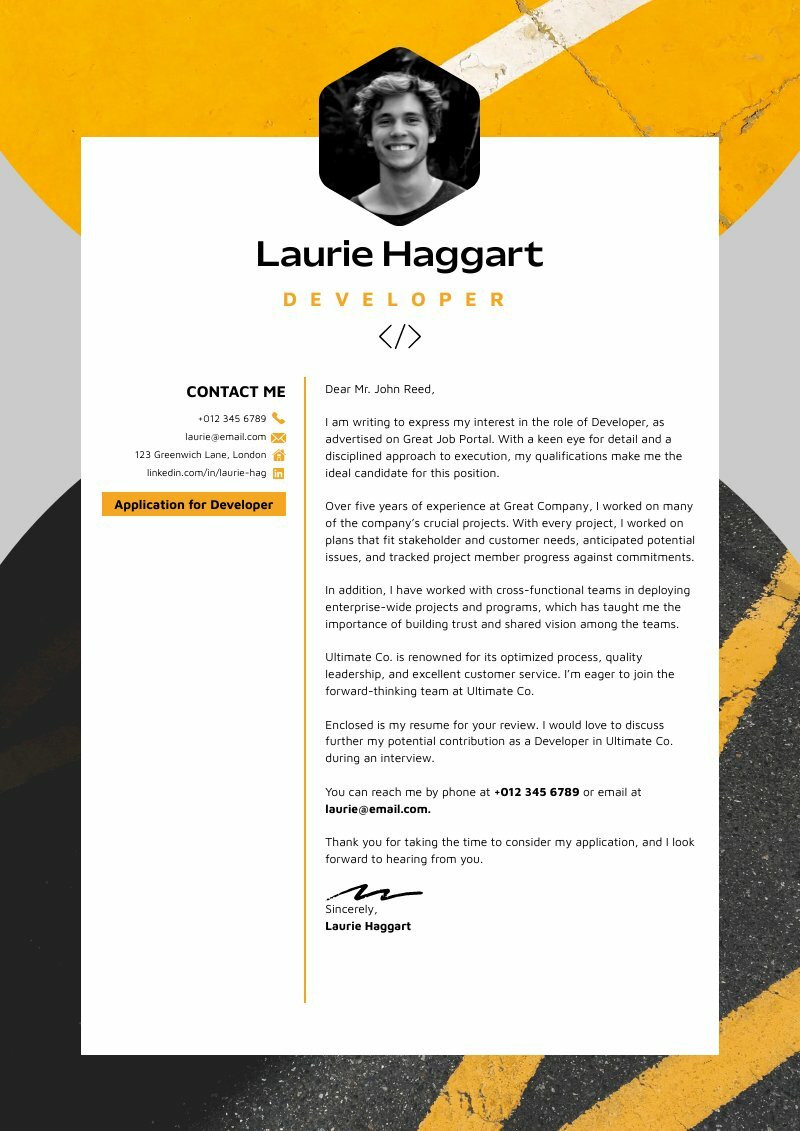
Developer Cover Letter
Resumes
Developer Cover Letter