Piktochart Templates Reports / Dashboards
Dashboard Report Templates
Design eye-catching, data-driven reports effortlessly with Piktochart's customizable dashboard templates. Visualize your data and impress your audience.
Dashboard Report Templates
 Dashboards
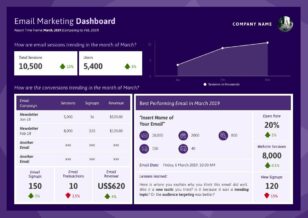
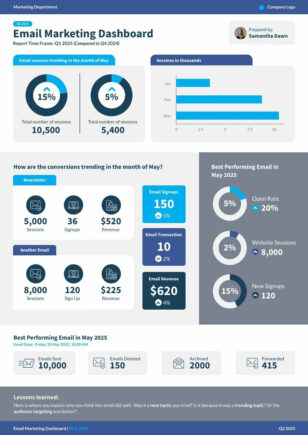
Email Marketing Dashboard
Dashboards
Email Marketing Dashboard
 Dashboards
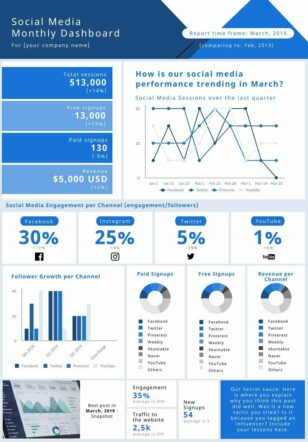
Social Media Monthly Dashboard
Dashboards
Social Media Monthly Dashboard
 Dashboards
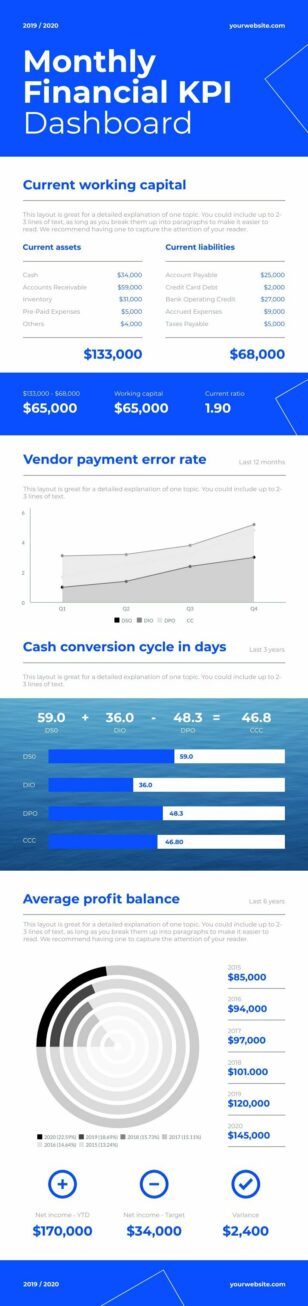
Financial KPI Dashboard
Dashboards
Financial KPI Dashboard
 Dashboards
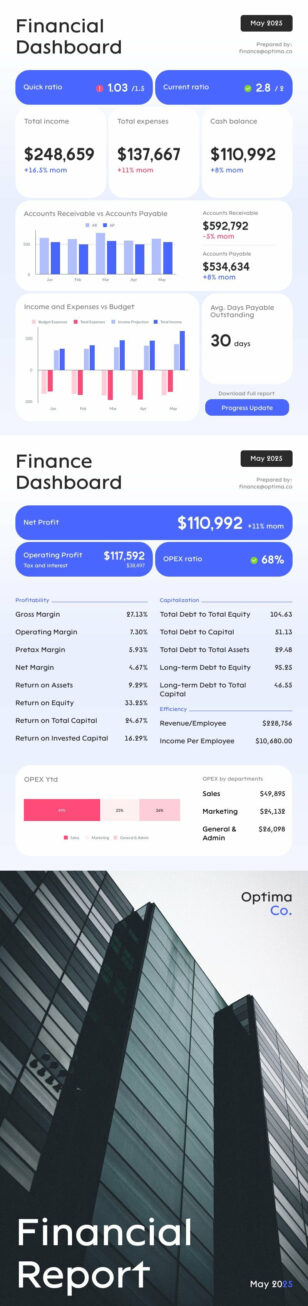
Financial Dashboard
Dashboards
Financial Dashboard
 Dashboards
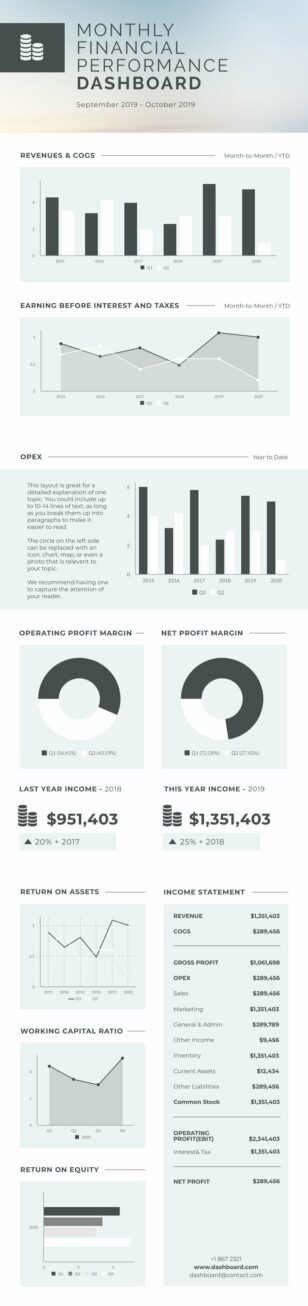
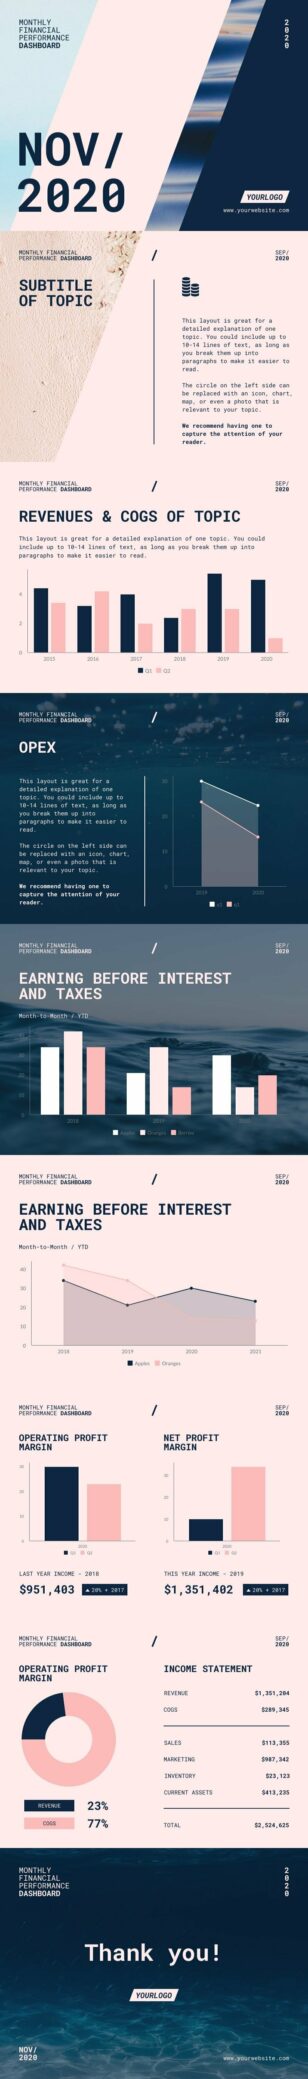
Financial Performance Dashboard
Dashboards
Financial Performance Dashboard
 Dashboards
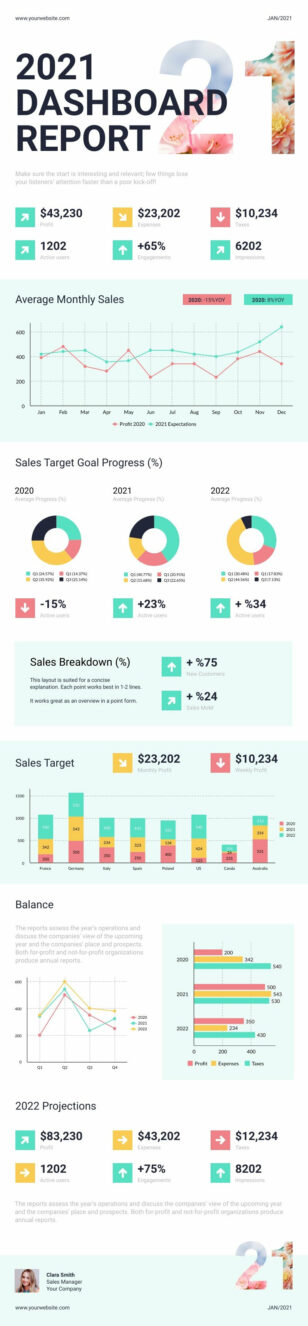
Dashboard Report
Dashboards
Dashboard Report
 Dashboards
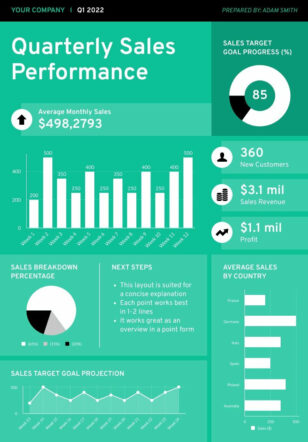
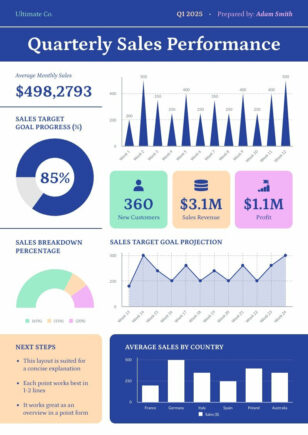
Quarterly Sales Dashboard
Dashboards
Quarterly Sales Dashboard
 Dashboards
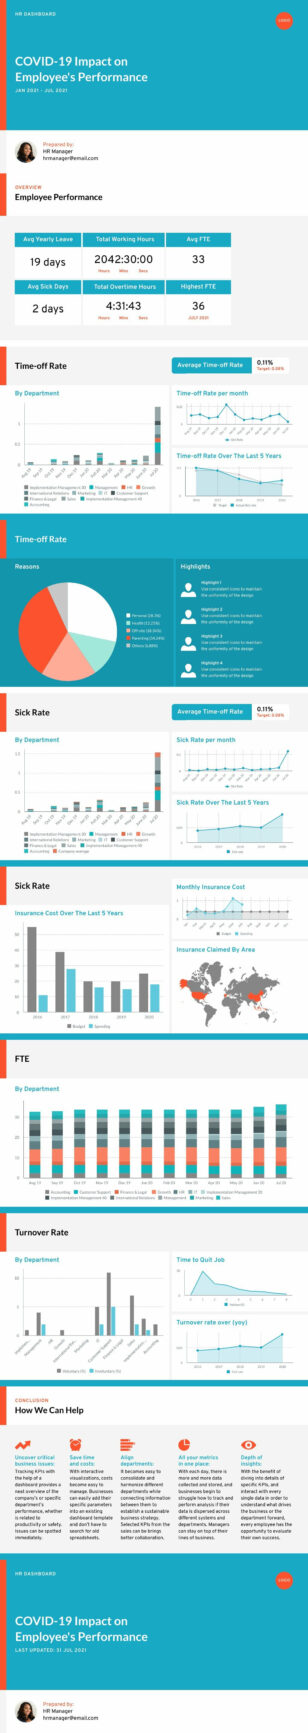
HR Dashboard Widescreen
Dashboards
HR Dashboard Widescreen
 Dashboards
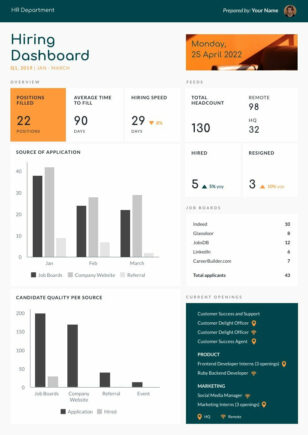
Hiring Dashboard
Dashboards
Hiring Dashboard
 Dashboards
Financial Analysis Report
Dashboards
Financial Analysis Report
 Dashboards
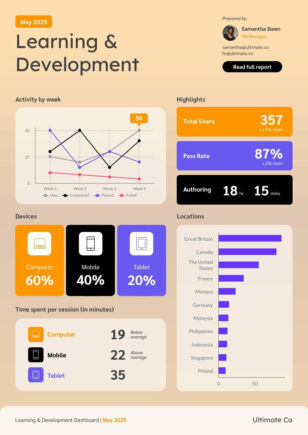
HR L&D Dashboard
Dashboards
HR L&D Dashboard
 Dashboards
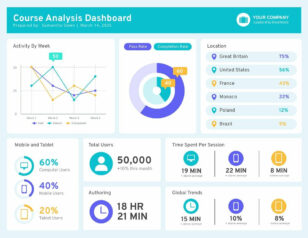
Course Analysis Dashboard
Dashboards
Course Analysis Dashboard
 Dashboards
Quarterly Email Marketing Dashboard
Dashboards
Quarterly Email Marketing Dashboard
 Dashboards
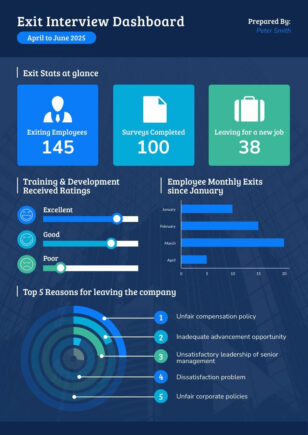
Exit Interview Dashboard
Dashboards
Exit Interview Dashboard
 Dashboards
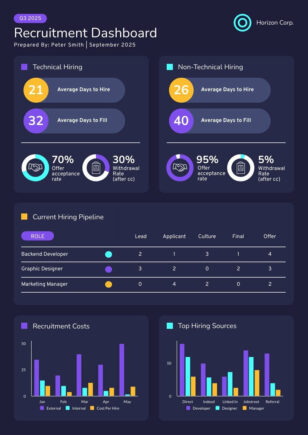
Recruitment Dashboard
Dashboards
Recruitment Dashboard
 Dashboards
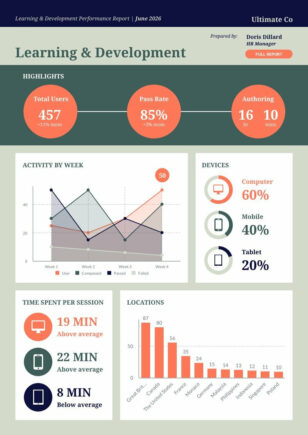
L&D Performance Report
Dashboards
L&D Performance Report
 Dashboards
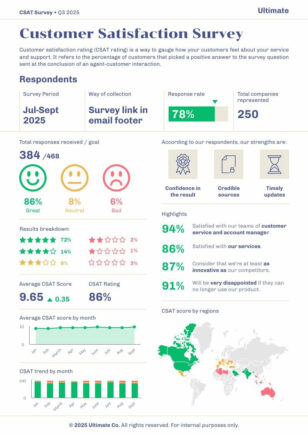
CSAT Dashboard
Dashboards
CSAT Dashboard
 Dashboards
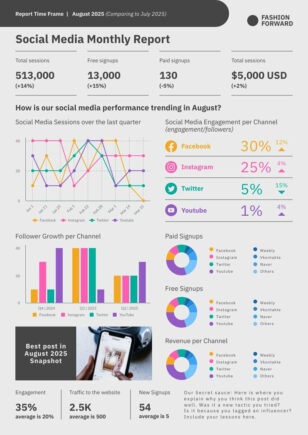
Social Media Monthly Report
Dashboards
Social Media Monthly Report
 Dashboards
Quarterly Report
Dashboards
Quarterly Report
 Dashboards
Satisfaction Survey
Dashboards
Satisfaction Survey
 Dashboards
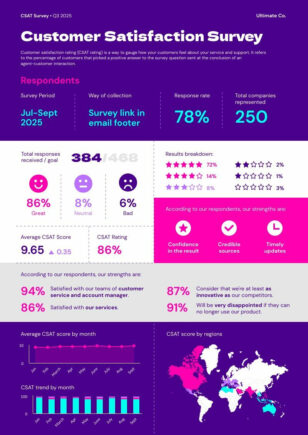
Modern Customer Satisfaction Survey
Dashboards
Modern Customer Satisfaction Survey
 Dashboards
Project Progress
Dashboards
Project Progress
 Dashboards
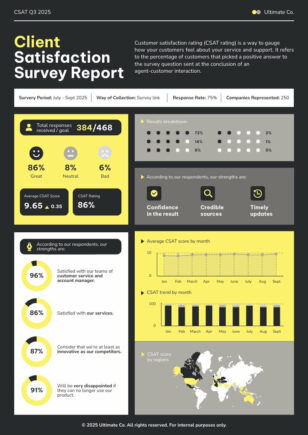
Client Satisfaction Survey
Dashboards
Client Satisfaction Survey
 Dashboards
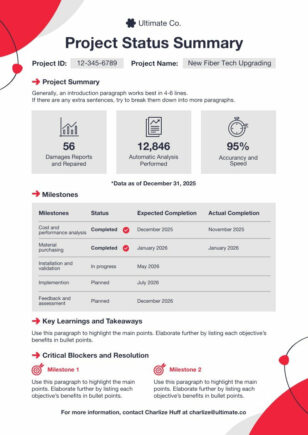
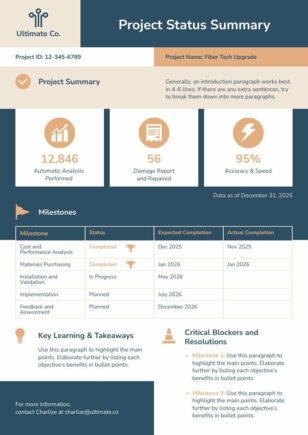
Project Status Report
Dashboards
Project Status Report
Dashboard report templates for KPIs and metrics
Piktochart offers an extensive collection of dashboard report templates designed for professionals across various industries. Our templates simplify data visualization, allowing you to create compelling reports without extensive design experience.
With Piktochart, you can customize every aspect of your dashboard to match your brand and specific reporting needs. Choose from a wide range of charts, graphs, and infographic elements to present your data effectively. Our user-friendly interface lets you drag-and-drop components, edit colors, and input your data with ease.
Whether you’re crafting marketing performance reports, sales analytics, or executive summaries, Piktochart’s templates provide a solid foundation for your data storytelling. Save time and resources by starting with our professionally designed layouts, and focus on what matters most – interpreting and presenting your insights.
Browse the dashboard report templates above and pick one that matches your data — every template is fully editable in minutes, no design skills required.
Dashboard Report FAQs
What should a dashboard report include?
A good dashboard report shows the 3–5 KPIs that matter most, each with a trend line and a one-sentence interpretation — Piktochart’s templates structure this for you out of the box.
How do I visualise multiple metrics in one dashboard?
Use Piktochart’s grid layouts to lay out charts, gauges, and number callouts side by side, so leadership can scan all your key metrics at a glance.
Can I customise a dashboard to my company’s branding?
Yes — apply your brand colours, fonts, and logo via the brand kit and every dashboard you build will be on-brand automatically.
What’s the best way to share a dashboard report with stakeholders?
Export to PDF for static reporting, PNG for embedding in decks, or share a live Piktochart link so collaborators can view the latest version.
Do I need to know data visualisation theory to create a dashboard?
No — every Piktochart template uses chart types and layouts based on data viz best practices, so even a first-time user can produce a clean, readable dashboard.