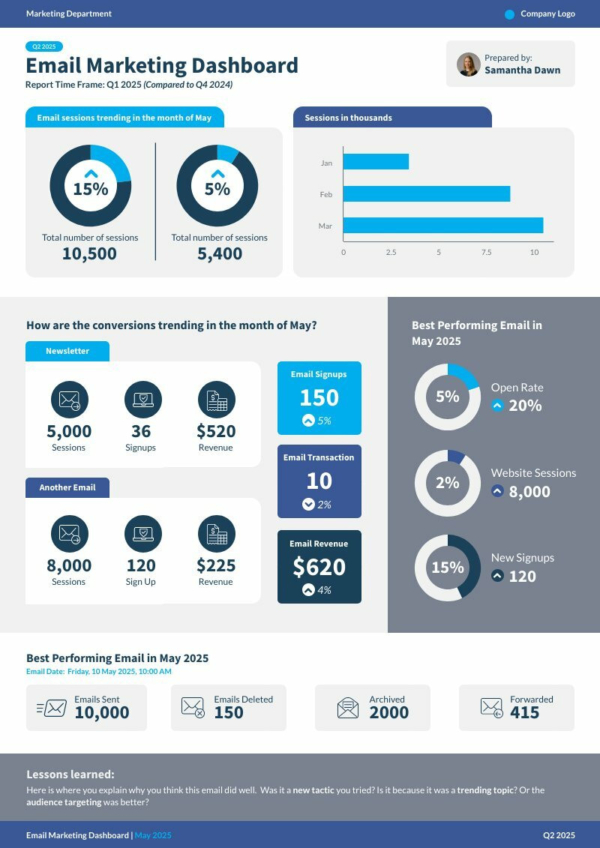
Quarterly Email Marketing Dashboard
Reports
Edit for freeYou'll be asked to log in or sign up for a free Piktochart account first.
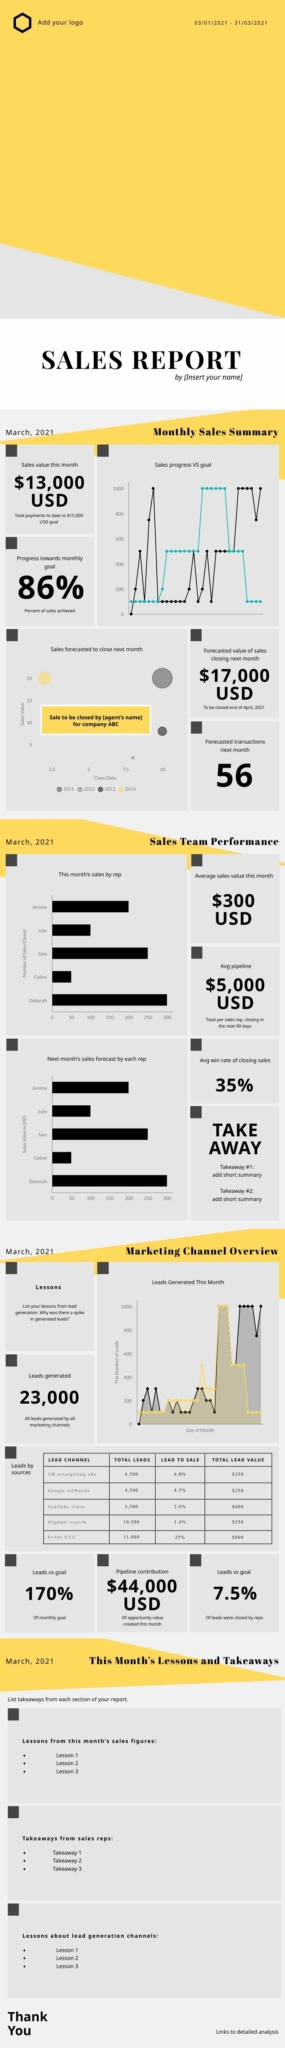
Create an email marketing dashboard with this easy-to-edit visual template. Report on your email drip campaigns and visualize data like conversions, open rates, and CTRs, present the best performing emails, all in a professional visual that looks like it was created by a graphic designer. The report template can be adapted to weekly, monthly, or quarterly goals and the topic is easily changeable to fit your needs.
Available File Type
Customization
100% customizable
Tags
More Templates Like This
 Annual
Internal Audit Report
Annual
Internal Audit Report
 Monthly
Employee Engagement Strategies
Monthly
Employee Engagement Strategies
 Monthly
Trend Report
Monthly
Trend Report
 Monthly
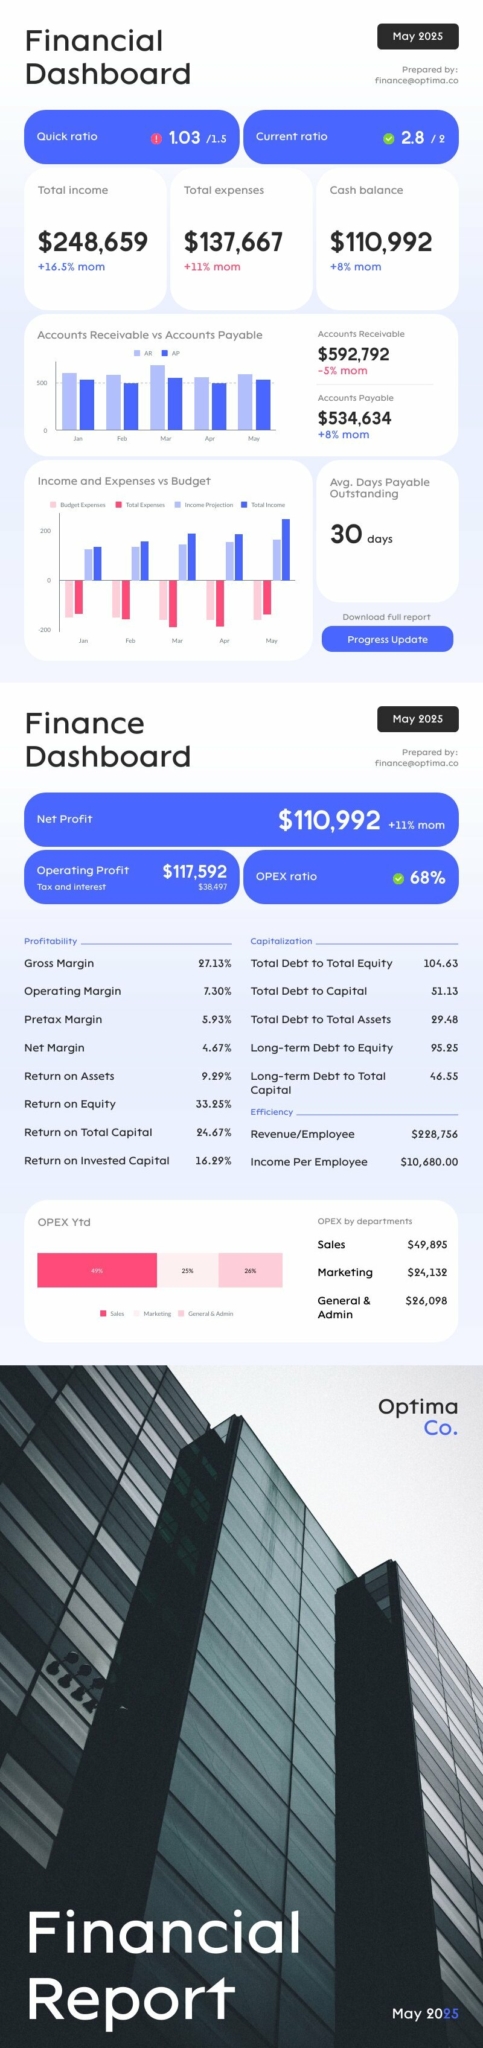
Financial Analysis Report
Monthly
Financial Analysis Report
 Monthly
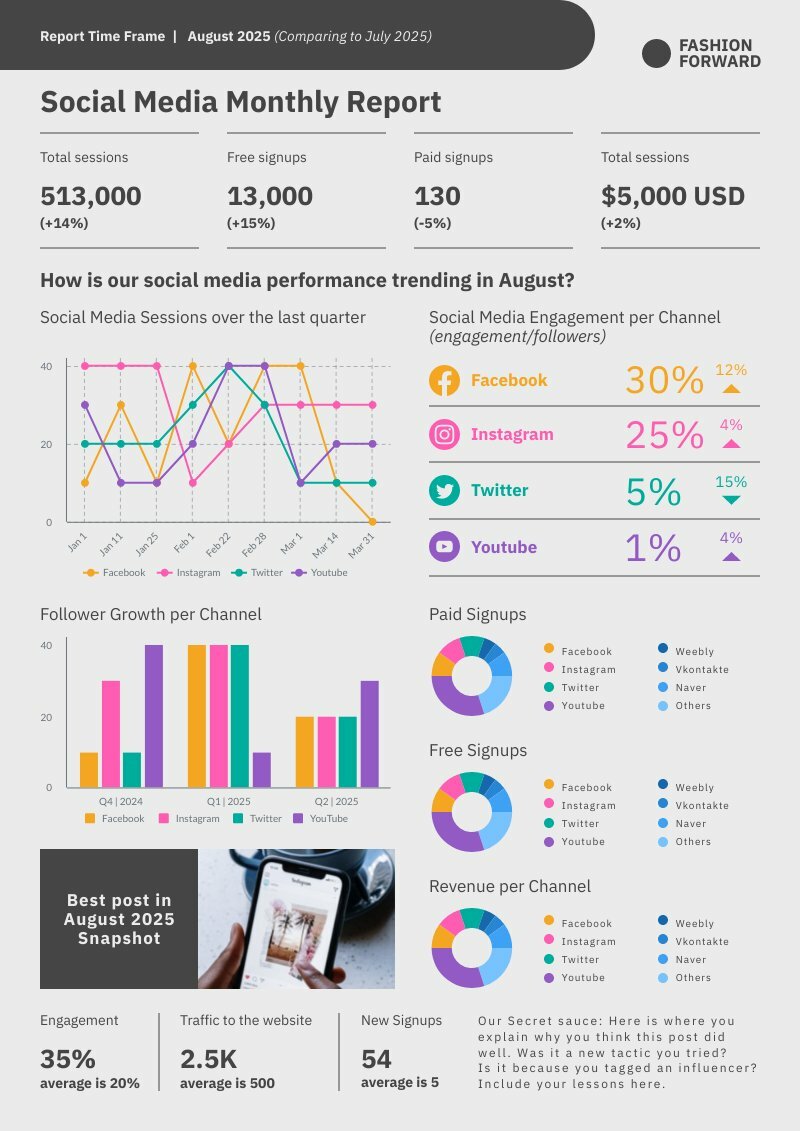
Social Media Monthly Report
Monthly
Social Media Monthly Report
 Monthly
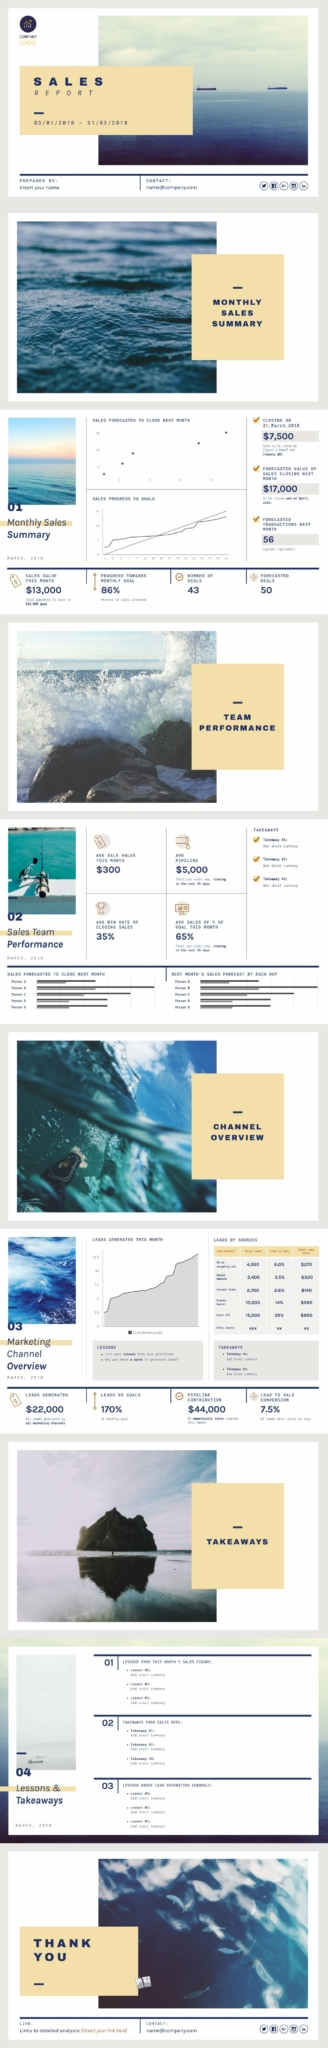
 Sales Report (Landscape)
Monthly
Monthly Sales Report (Landscape)
 Monthly
 Marketing Report
Monthly
Monthly Marketing Report
 Monthly
 Progress Form
Monthly
Monthly Progress Form
 Monthly
 Progress Report
Monthly
Monthly Progress Report
 Monthly
 Sales Report
Monthly
Monthly Sales Report
 Annual
Corporate Financial Review
Annual
Corporate Financial Review
 Annual
 E-commerce Sales Report
Annual
Annual E-commerce Sales Report