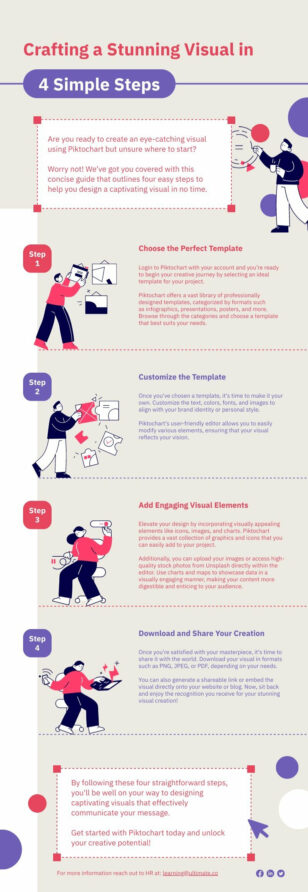
Piktochart Templates Infographics
Free Infographic Templates
Turn complex data and ideas into clear, visual stories with free infographic templates. Perfect for marketers, educators, and teams who need to explain processes, share statistics, or summarize reports — customize and download in minutes.
Infographic Templates for Data-Driven Visual Storytelling
 Infographics
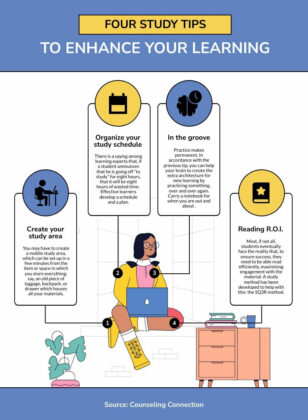
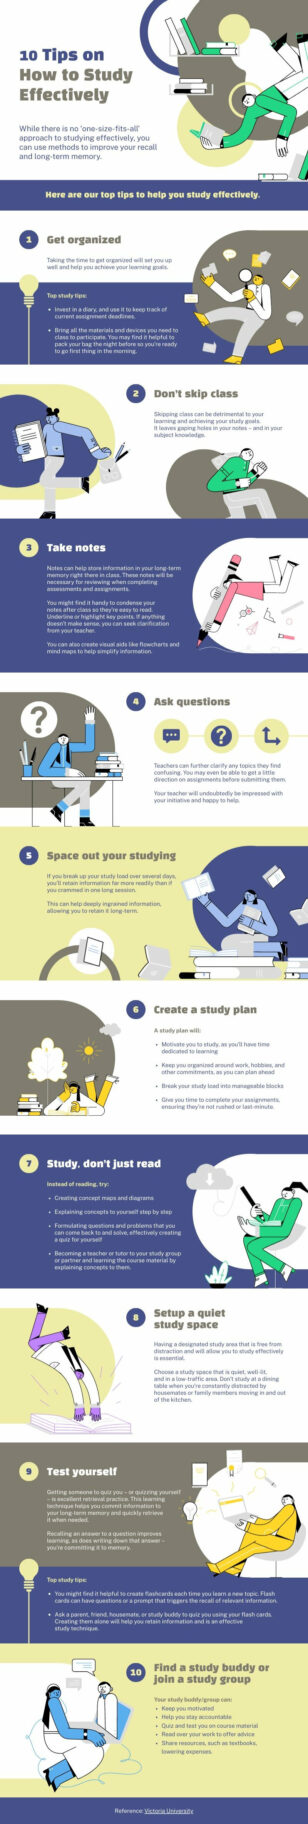
Study Tips
Infographics
Study Tips
 Infographics
Exam Preparation Tips
Infographics
Exam Preparation Tips
 Infographics
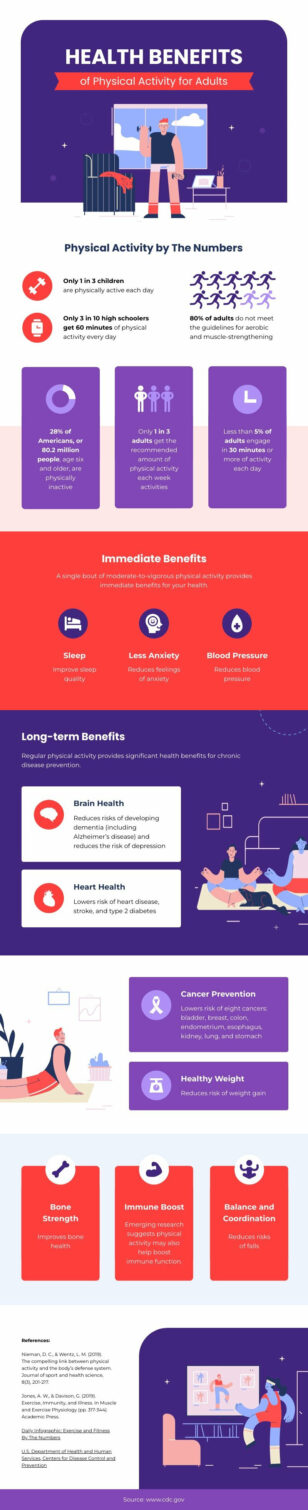
Health Benefits of Physical Activity
Infographics
Health Benefits of Physical Activity
 Infographics
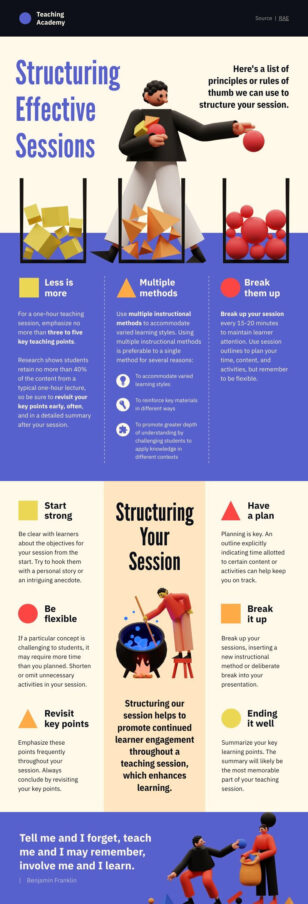
The Teacher’s Guide
Infographics
The Teacher’s Guide
 Infographics
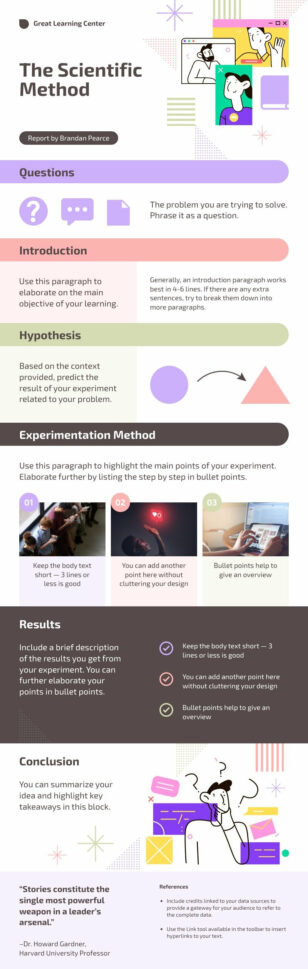
The Scientific Method
Infographics
The Scientific Method
 Infographics
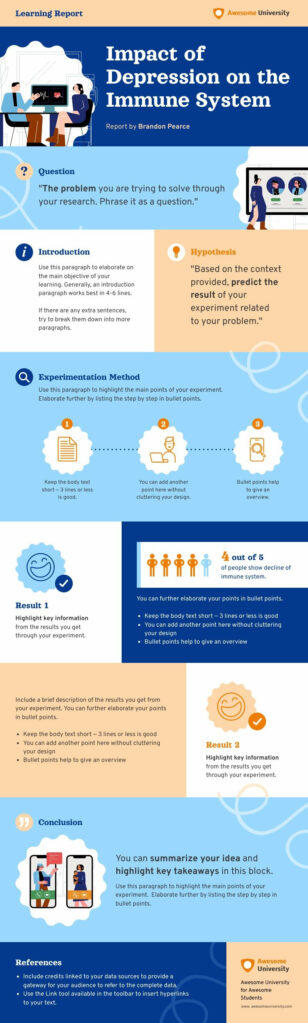
Impact of Depression on the Immune System Experiment Report
Infographics
Impact of Depression on the Immune System Experiment Report
 Infographics
Blue Modern Telehealth
Infographics
Blue Modern Telehealth
 Infographics
Modern Study Tips
Infographics
Modern Study Tips
 Infographics
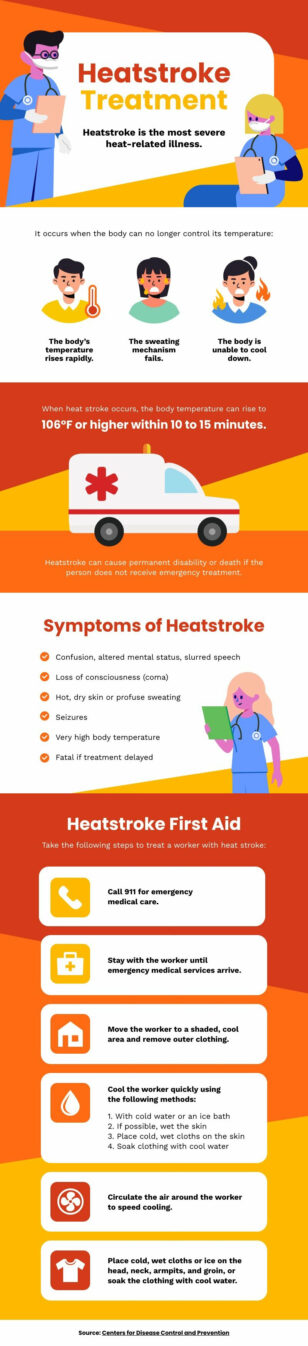
Heat Stroke Treatment
Infographics
Heat Stroke Treatment
 Infographics
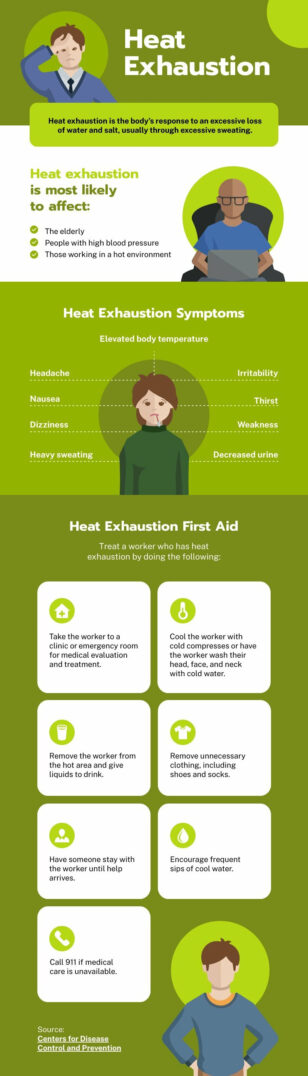
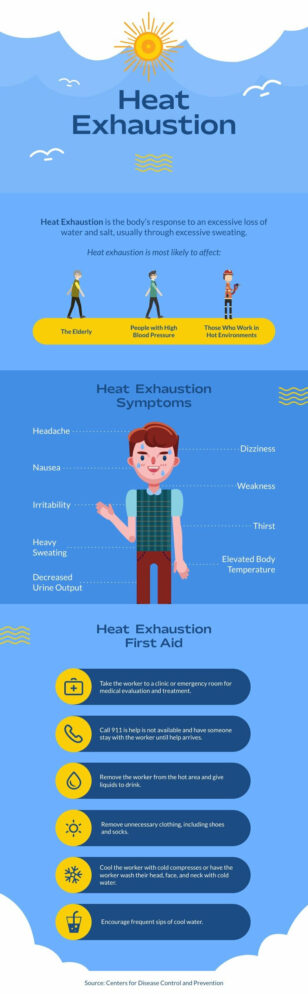
Heat Exhaustion
Infographics
Heat Exhaustion
 Infographics
Heat Exhaustion Symptoms
Infographics
Heat Exhaustion Symptoms
 Infographics
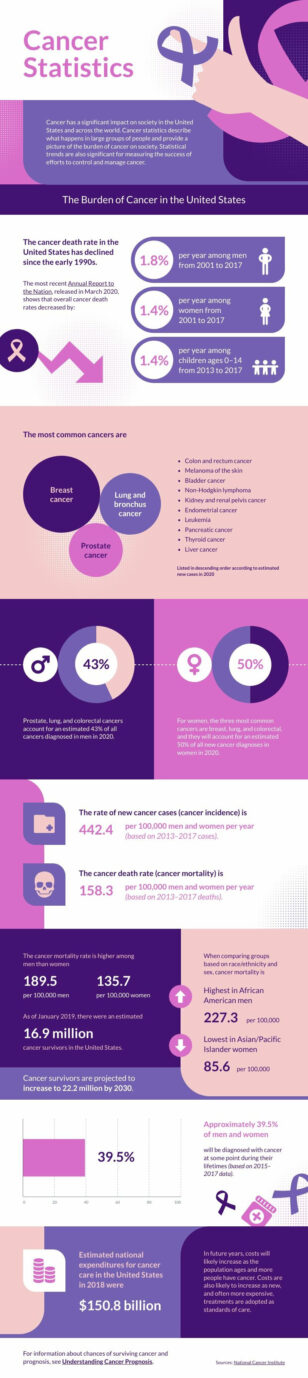
Cancer Statistics
Infographics
Cancer Statistics
 Infographics
Summary Infographic
Infographics
Summary Infographic
 Infographics
Modern Survey Report
Infographics
Modern Survey Report
 Infographics
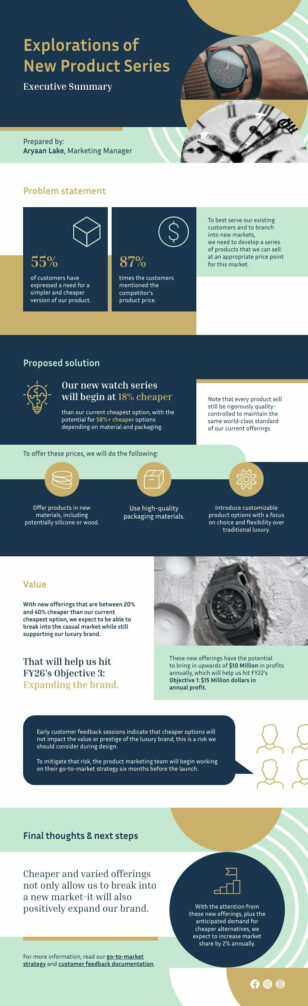
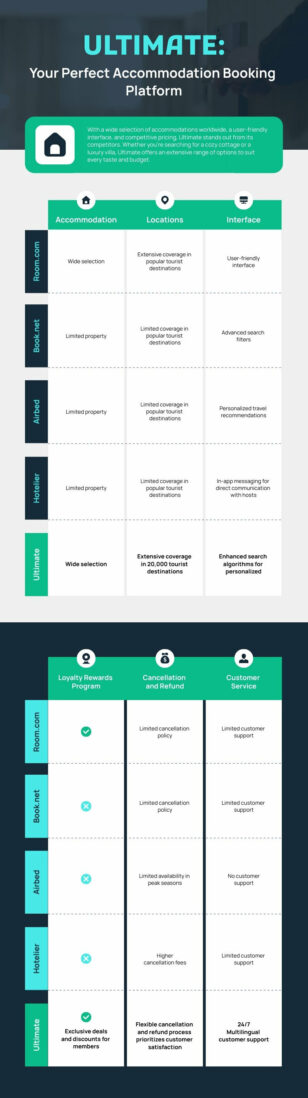
Competitor Comparison
Infographics
Competitor Comparison
 Infographics
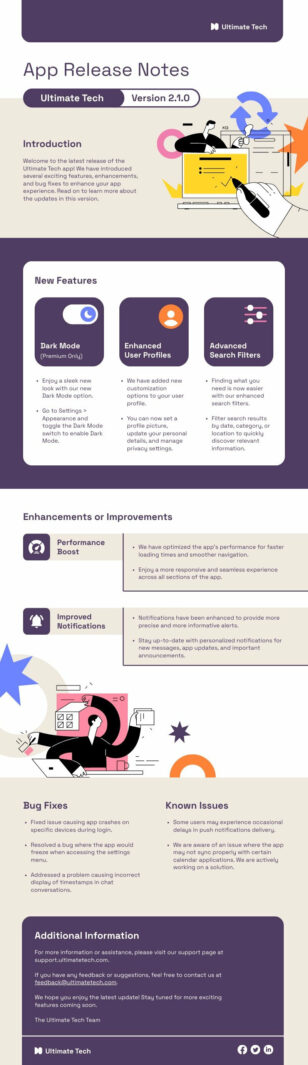
Release Notes
Infographics
Release Notes
 Infographics
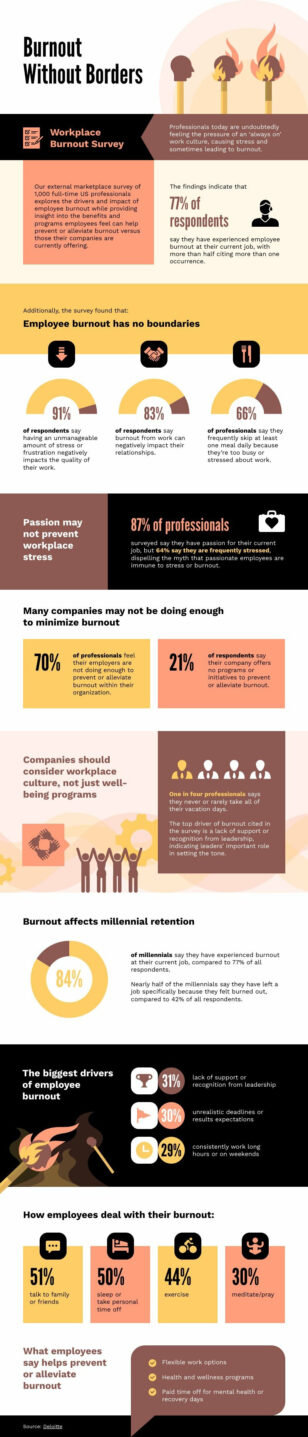
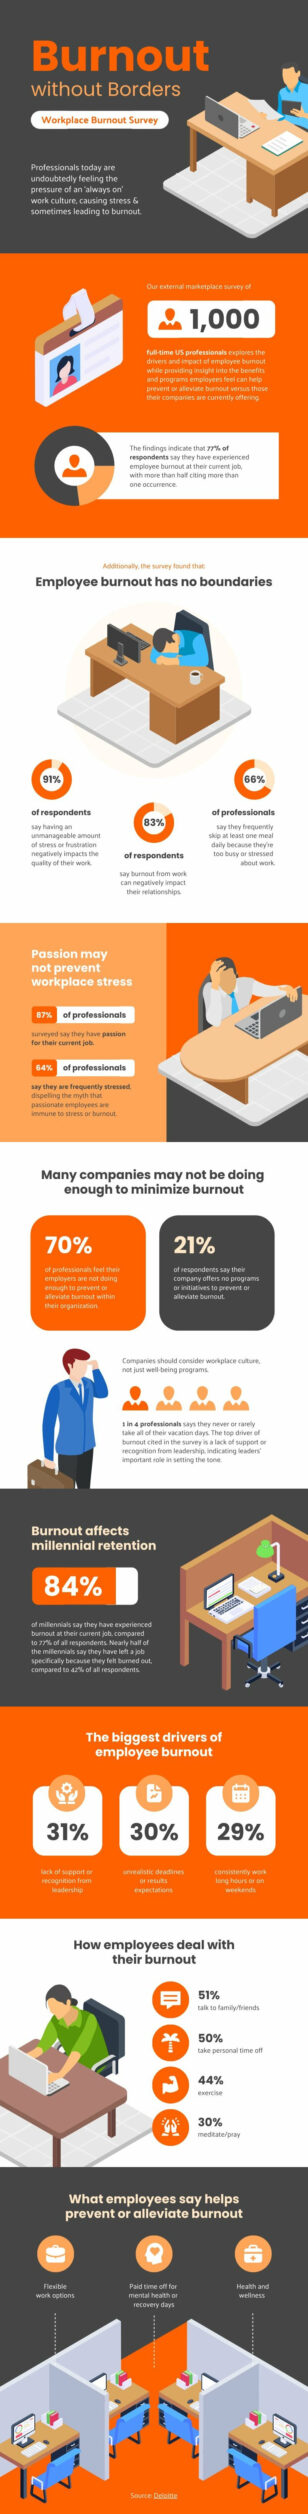
Burnout Survey
Infographics
Burnout Survey
 Infographics
Study Techniques
Infographics
Study Techniques
 Infographics
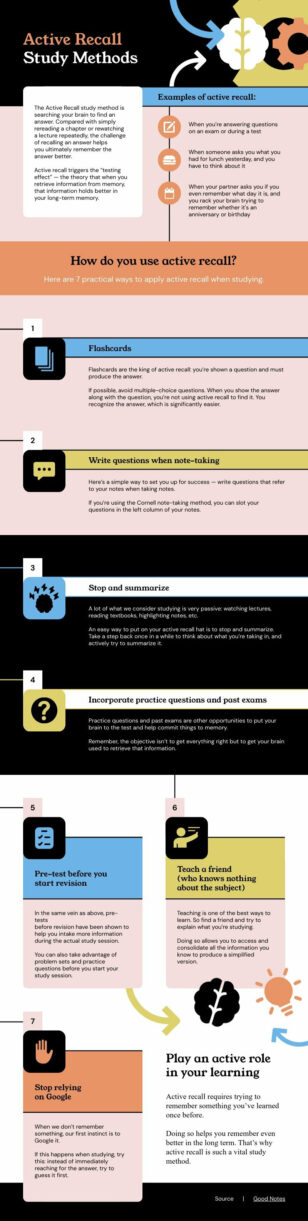
Simple Active Recall Study Methods
Infographics
Simple Active Recall Study Methods
 Infographics
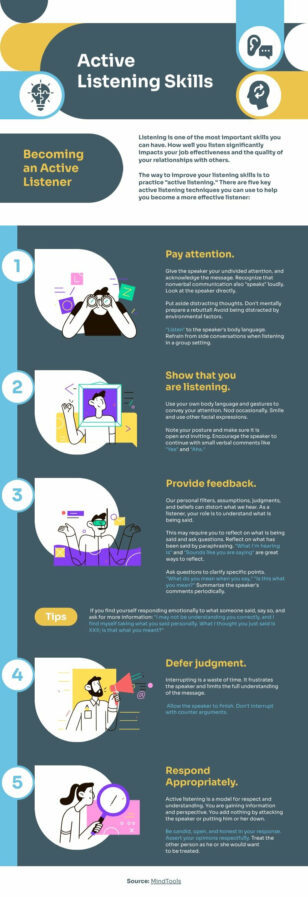
Active Listening Skills
Infographics
Active Listening Skills
 Infographics
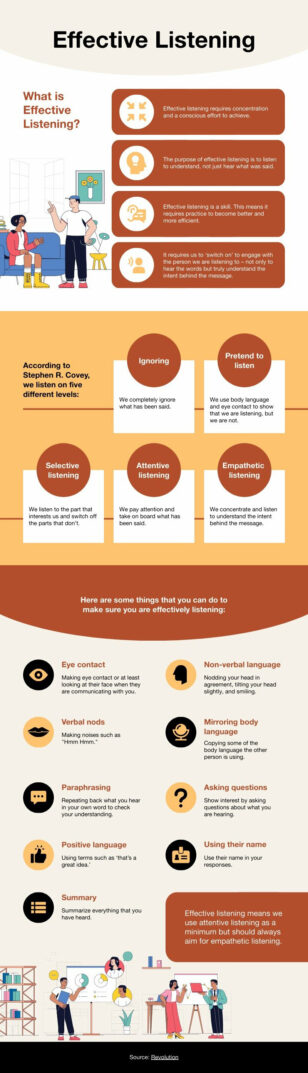
Effective Listening
Infographics
Effective Listening
 Infographics
User Guide
Infographics
User Guide
 Infographics
User Manuals
Infographics
User Manuals
 Infographics
Study Tips for Exams
Infographics
Study Tips for Exams
 Infographics
Modern Exam Preparation Tips
Infographics
Modern Exam Preparation Tips
 Infographics
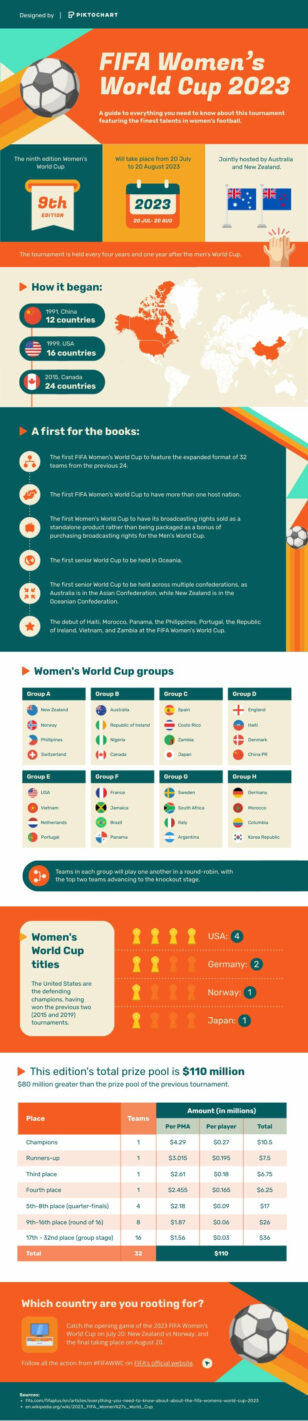
FIFA Women’s World Cup
Infographics
FIFA Women’s World Cup
 Infographics
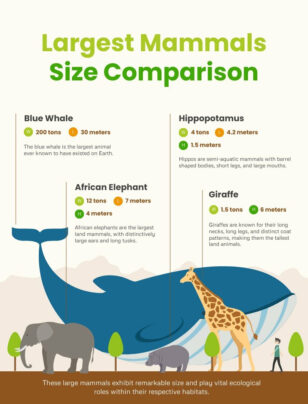
Largest Mammals Size Comparison
Infographics
Largest Mammals Size Comparison
 Infographics
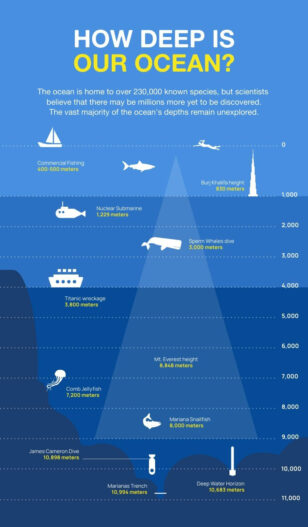
How Deep Is Our Ocean
Infographics
How Deep Is Our Ocean
 Infographics
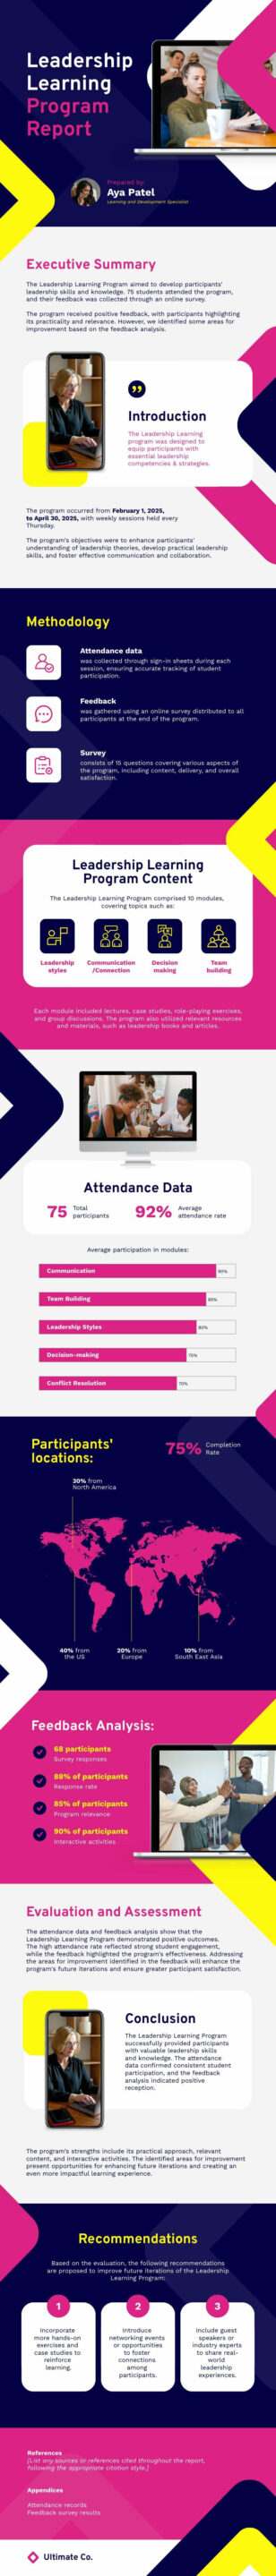
Leadership Training
Infographics
Leadership Training
 Infographics
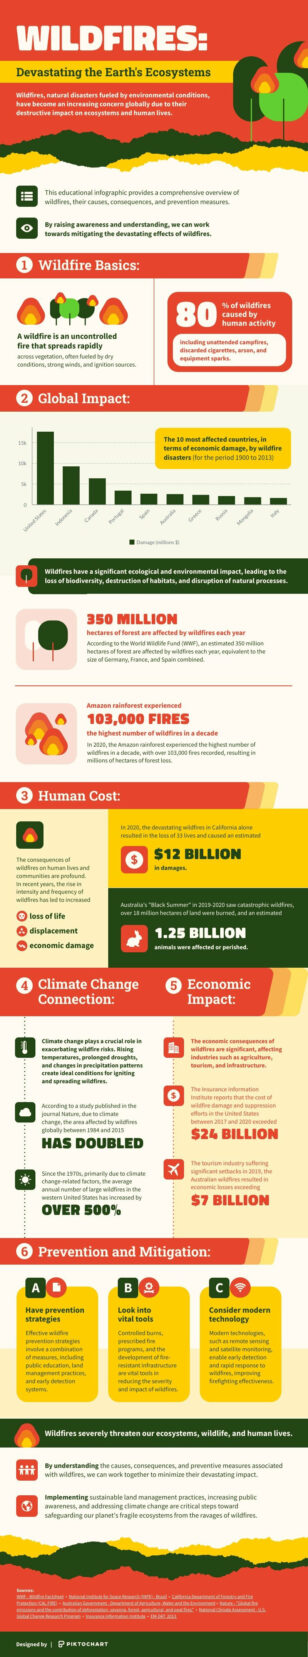
Facts About Wildfires
Infographics
Facts About Wildfires
 Infographics
Sunstroke Symptoms
Infographics
Sunstroke Symptoms
 Infographics
Signs of Heat Stroke
Infographics
Signs of Heat Stroke
 Infographics
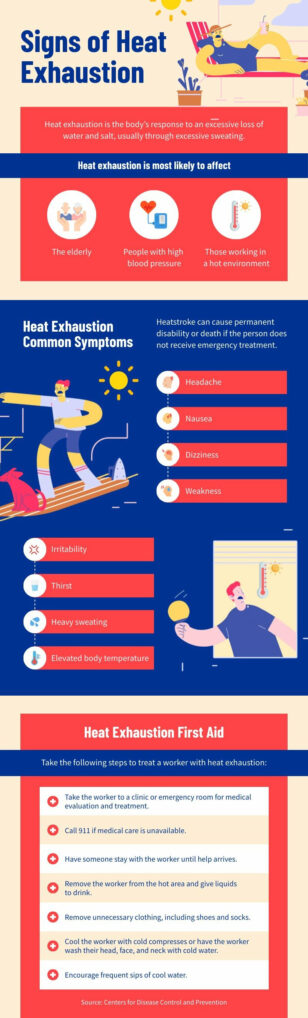
Signs of Heat Exhaustion
Infographics
Signs of Heat Exhaustion
 Infographics
Comparison Table
Infographics
Comparison Table
 Infographics
Competitive Analysis
Infographics
Competitive Analysis
 Infographics
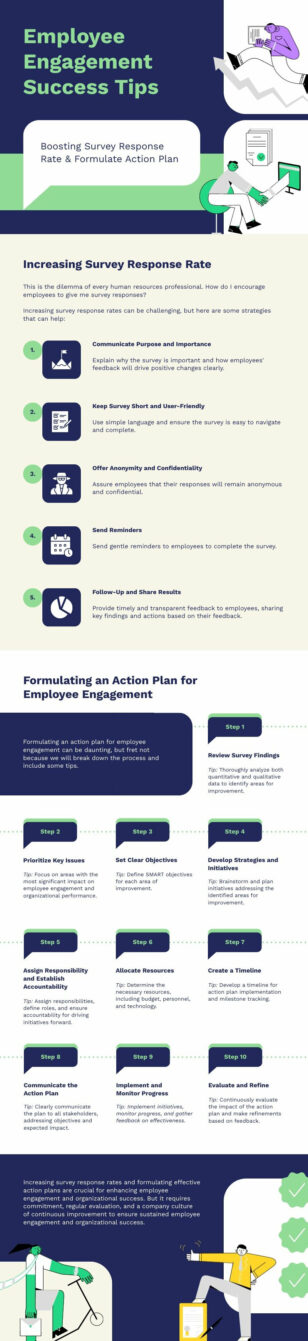
Employee Engagement Tips
Infographics
Employee Engagement Tips
 Infographics
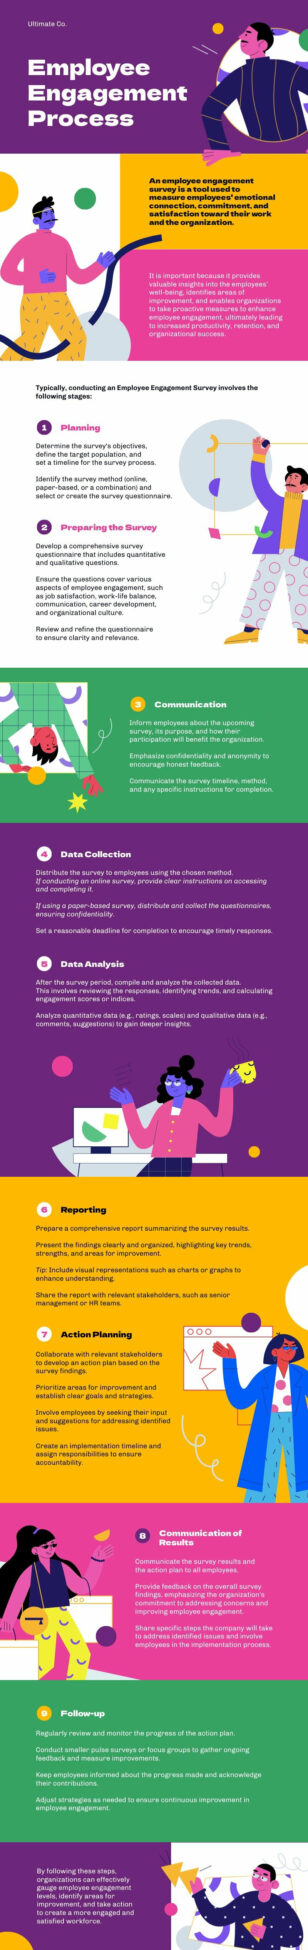
Employee Engagement Process
Infographics
Employee Engagement Process
 Infographics
Engaging Managers
Infographics
Engaging Managers
 Infographics
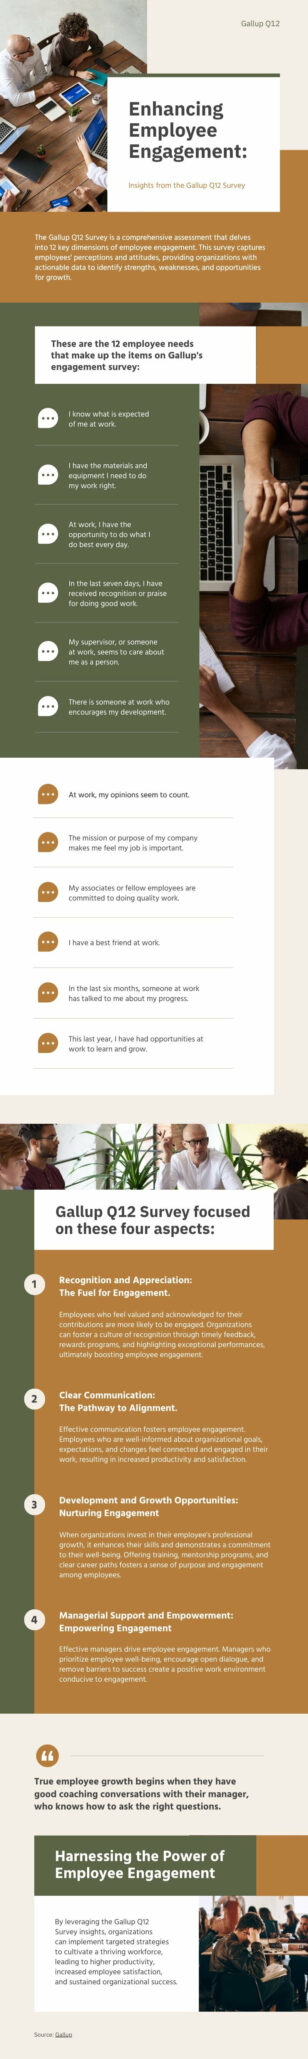
Gallup Q12
Infographics
Gallup Q12
 Infographics
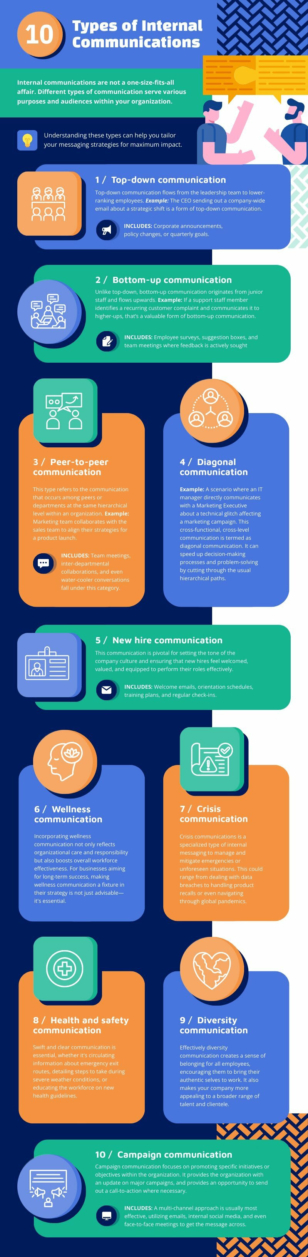
Types of Internal Communications
Infographics
Types of Internal Communications
 Infographics
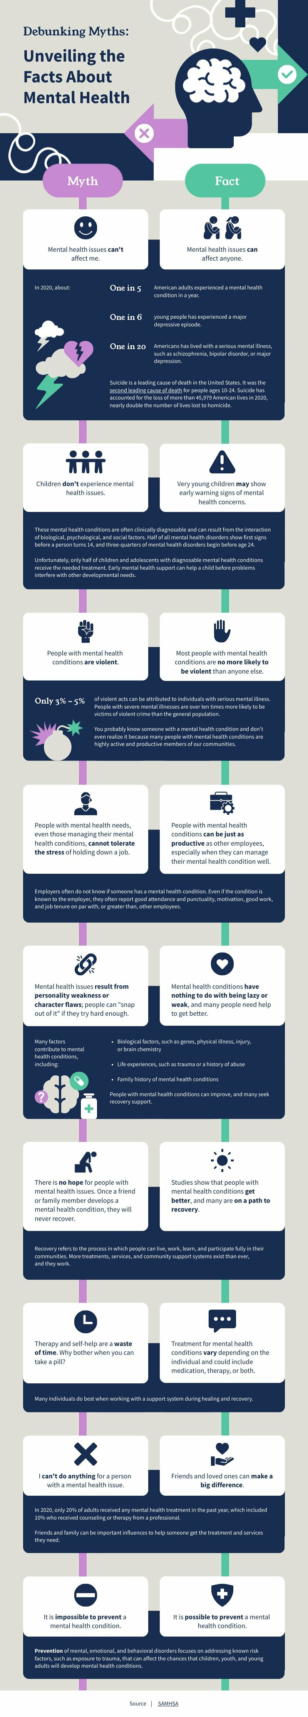
Mental Health Facts
Infographics
Mental Health Facts
 Infographics
Artificial Intelligence Statistics
Infographics
Artificial Intelligence Statistics
 Infographics
Modern Mental Health Statistics
Infographics
Modern Mental Health Statistics
 Infographics
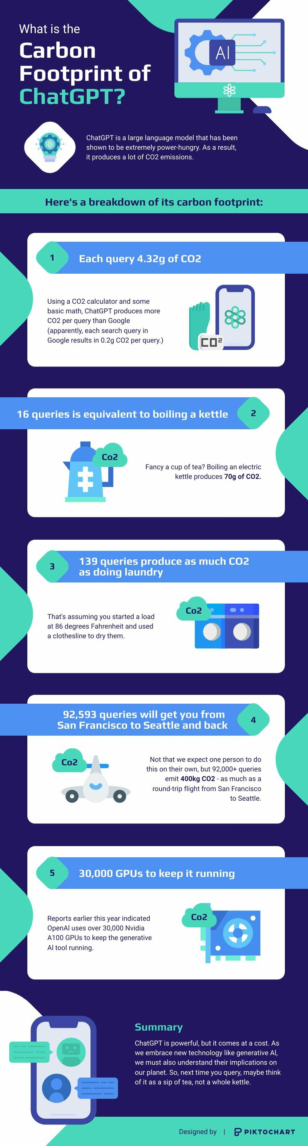
AI Carbon Footprint
Infographics
AI Carbon Footprint
 Infographics
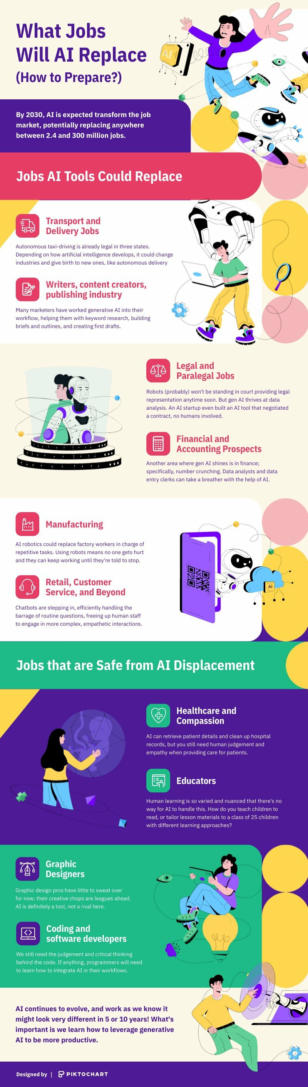
What Jobs Will AI Replace
Infographics
What Jobs Will AI Replace
 Infographics
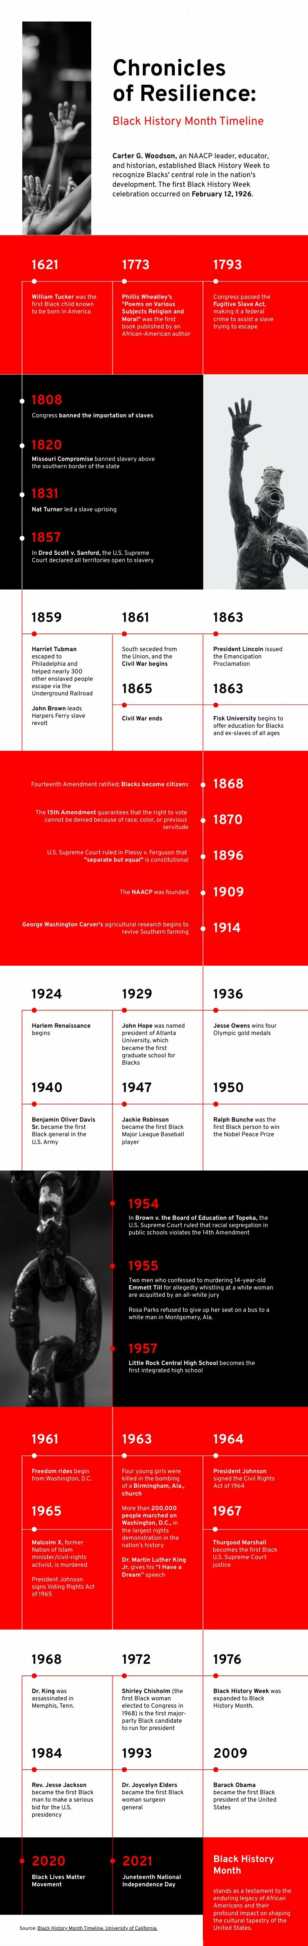
History of Black History Month Infographic
Infographics
History of Black History Month Infographic
 Infographics
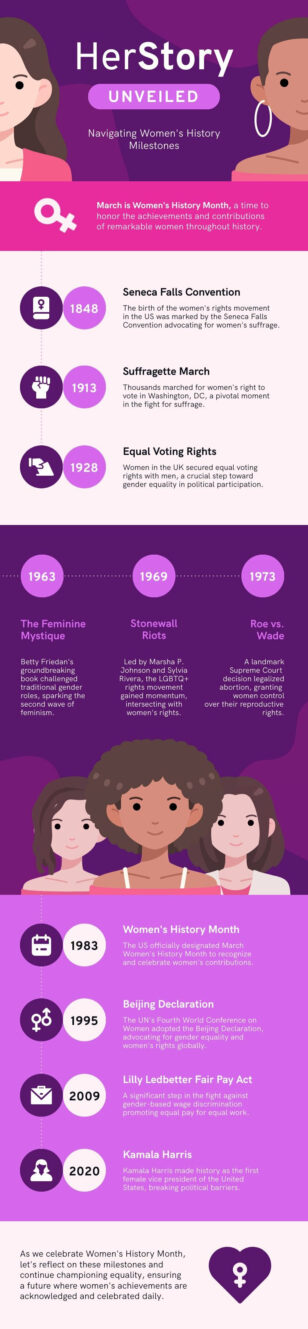
Facts About Women’s History Month
Infographics
Facts About Women’s History Month
 Infographics
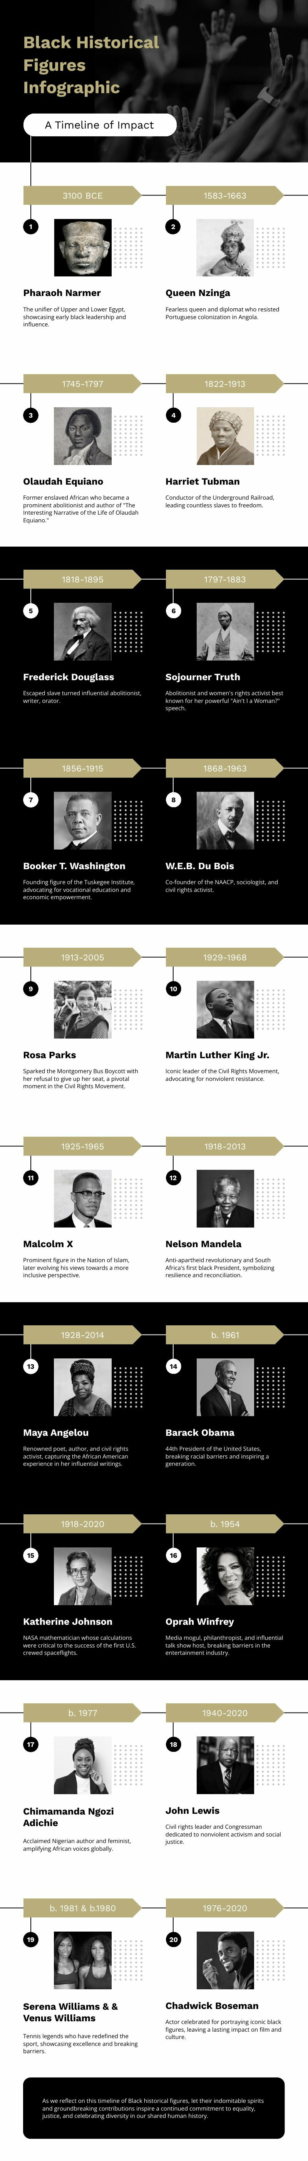
Black Historical Figures Infographic
Infographics
Black Historical Figures Infographic
 Infographics
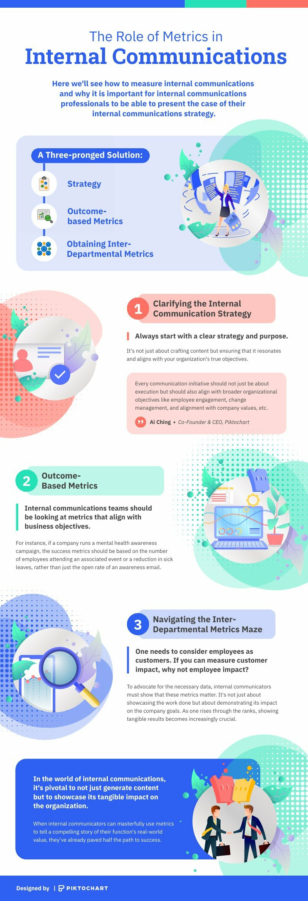
The Role Of Metrics In Internal Communications
Infographics
The Role Of Metrics In Internal Communications
 Infographics
International Women’s Day Infographic
Infographics
International Women’s Day Infographic
 Infographics
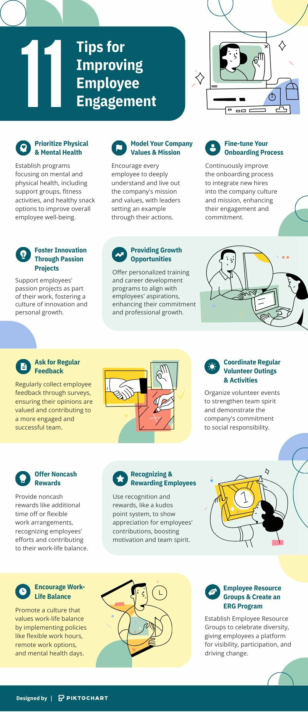
Tips for Improving Employee Engagement
Infographics
Tips for Improving Employee Engagement
Simplify Complex Information with Professional Infographics
Infographics are one of the most effective ways to communicate data, processes, and comparisons at a glance. Whether you’re creating a statistical infographic for a blog post, a timeline for a project update, or a comparison chart for a sales deck, starting with a professionally designed template saves hours of layout work.
Piktochart’s infographic templates cover every popular format: statistical, informational, timeline, process, geographic, comparison, and list-based. Each layout is built with visual hierarchy in mind so your audience absorbs the most important points first. Add your own data, swap icons, adjust the color scheme to your brand, and your infographic is ready to publish.
Educators use these templates to create classroom handouts that students actually read. Marketing teams turn quarterly reports into shareable social assets. HR departments visualize onboarding processes so new hires get up to speed faster. The use cases are as varied as the data you need to communicate.
Need an infographic in seconds? Try Piktochart’s AI-powered editor — describe what you need, and get a fully editable starting point instantly.