Piktochart Templates Healthcare / Diabetes Infographics
Diabetes Infographics Templates
With over 537 million adults living with diabetes globally, knowing the symptoms is crucial. Explore our templates to simplify complex information into engaging visuals.
Diabetes Infographic Templates
 Diabetes Infographics
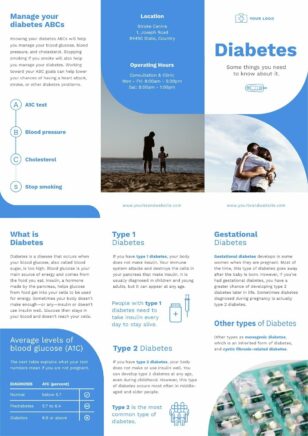
Diabetes Trifold Brochure
Diabetes Infographics
Diabetes Trifold Brochure
 Diabetes Infographics
Diabetes Disease Trifold Brochure
Diabetes Infographics
Diabetes Disease Trifold Brochure
 Diabetes Infographics
Diabetes Symptoms
Diabetes Infographics
Diabetes Symptoms
 Diabetes Infographics
Signs of Diabetes
Diabetes Infographics
Signs of Diabetes
 Diabetes Infographics
Types of Diabetes
Diabetes Infographics
Types of Diabetes
Diabetes infographic templates for patient education
Discover a wealth of visually compelling diabetes infographics in Piktochart’s comprehensive gallery. Our carefully curated templates transform complex medical information into easily digestible, engaging visuals that educate and empower both healthcare professionals and patients. From risk factors and prevention tips to treatment options and lifestyle management, our infographics cover a wide range of essential diabetes-related topics.
Need to create a custom timeline for diabetes management or research? Try Piktochart’s free timeline maker to craft your own infographic from scratch. It’s perfect for illustrating disease progression, treatment milestones, or historical developments in diabetes care.
Whether you’re a healthcare provider looking to educate patients or an individual seeking to understand diabetes better, our gallery offers ready-to-use templates that simplify complex concepts into actionable insights. Explore our diabetes infographics templates gallery today to find the perfect visual aid for your needs and start making a difference in diabetes education and care.
Want a diabetes infographic in seconds? Try our AI healthcare infographic maker — describe your topic and the tool produces a visual you can refine in our editor.
Diabetes Infographics FAQs
What should a diabetes infographic include?
Type 1 vs type 2 differences, symptoms, risk factors, blood sugar ranges, prevention tips, and management basics — Piktochart’s diabetes templates have sections for each.
Can I create patient handouts for newly diagnosed diabetics?
Yes — Piktochart’s diabetes infographic templates work for patient education, clinic posters, and printable handouts; just customise the content to your patient’s needs.
How do I cite medical sources on a diabetes infographic?
Add a small footer or sidebar with references to the ADA, CDC, WHO, or peer-reviewed journals — Piktochart’s templates leave space for source attribution.
Can I add charts to show blood sugar trends or A1c targets?
Yes — drop in any of Piktochart’s chart blocks (line, bar, gauge) to visualise blood glucose readings, A1c targets, or population statistics.
What’s the best format for printing a diabetes infographic at a clinic?
Export to high-resolution PDF and print on US Letter, A4, or A3 — Piktochart’s print presets handle DPI automatically.