Piktochart Templates Reports
Report Templates
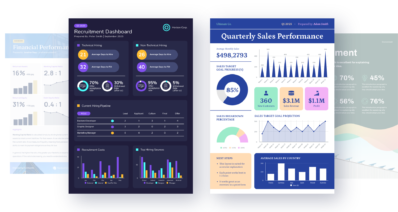
Craft professional reports effortlessly with our free, customizable templates. Present your data in engaging infographics that captivate your audience and convey information clearly.
Report Templates
 Reports
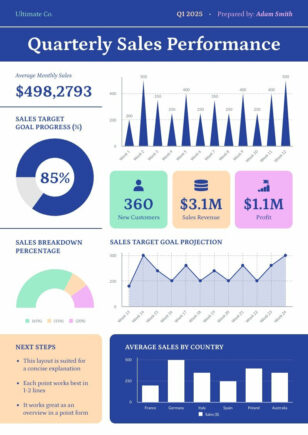
Quarterly Report
Reports
Quarterly Report
 Reports
Research Report Case Study
Reports
Research Report Case Study
 Reports
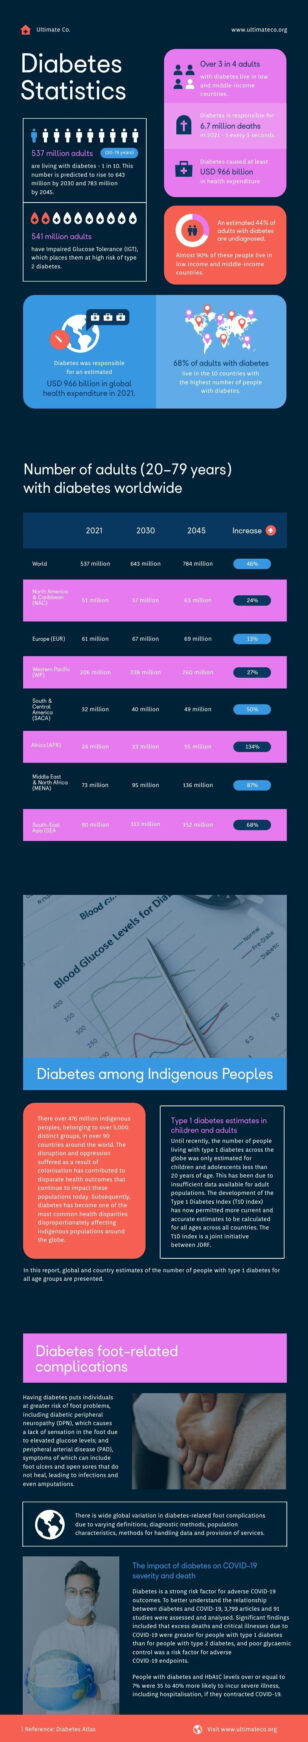
Medical Stats
Reports
Medical Stats
 Reports
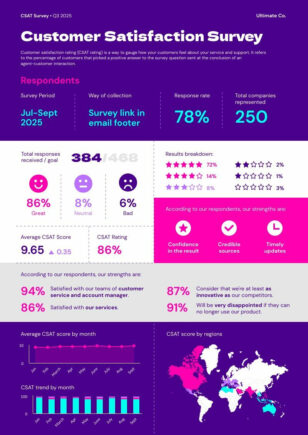
Satisfaction Survey
Reports
Satisfaction Survey
 Reports
Modern Customer Satisfaction Survey
Reports
Modern Customer Satisfaction Survey
 Reports
Trend Report
Reports
Trend Report
 Reports
Survey Report
Reports
Survey Report
 Reports
Project Progress
Reports
Project Progress
 Reports
Summary of Meeting
Reports
Summary of Meeting
 Reports
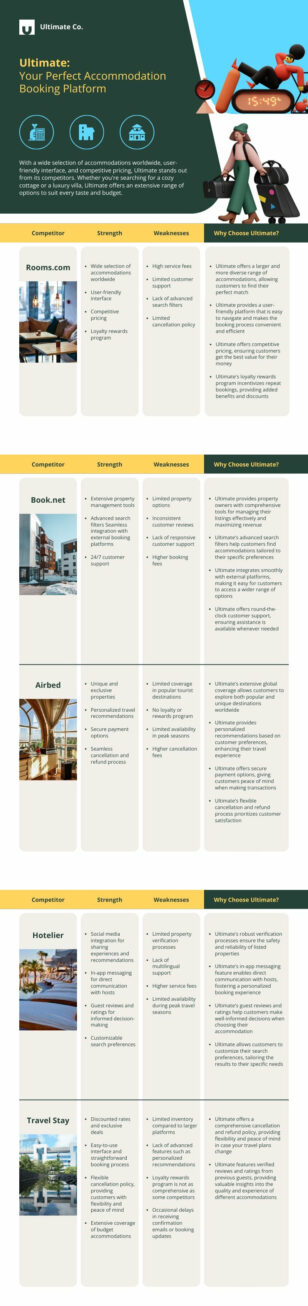
Modern Competitor Analysis
Reports
Modern Competitor Analysis
 Reports
Mid Year Review
Reports
Mid Year Review
 Reports
Employee Training Plan
Reports
Employee Training Plan
 Reports
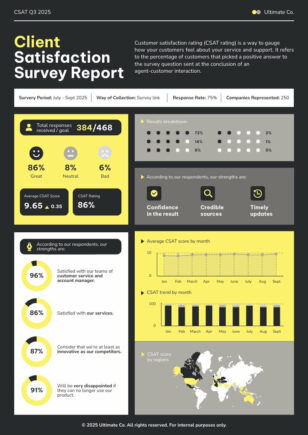
Client Satisfaction Survey
Reports
Client Satisfaction Survey
 Reports
Training Report
Reports
Training Report
 Reports
Simple Survey Report
Reports
Simple Survey Report
 Reports
Modern Employee Handbook
Reports
Modern Employee Handbook
 Reports
Company Handbook
Reports
Company Handbook
 Reports
Individual Development Plan
Reports
Individual Development Plan
 Reports
Roles and Responsibility
Reports
Roles and Responsibility
 Reports
Employee Policy
Reports
Employee Policy
 Reports
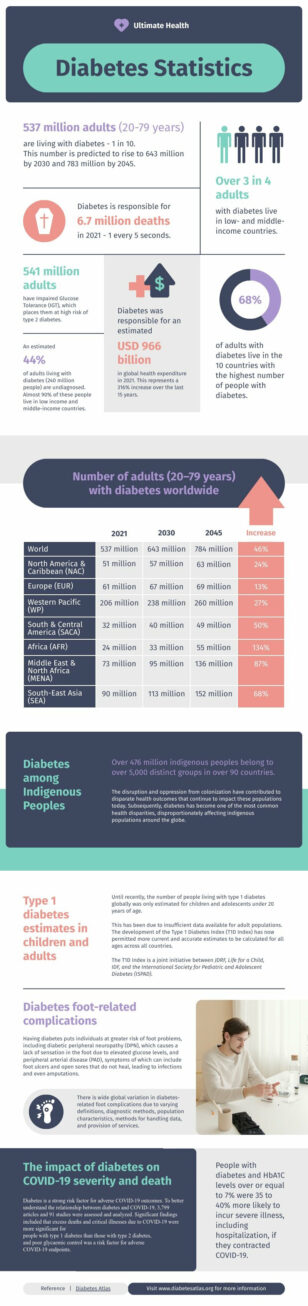
Modern Medical Stats
Reports
Modern Medical Stats
 Reports
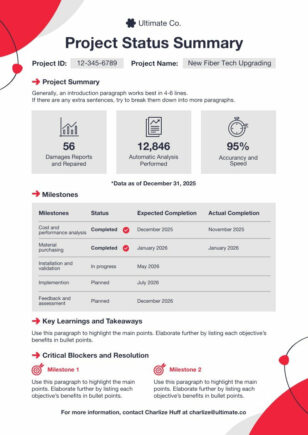
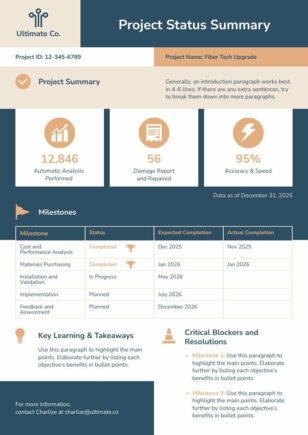
Project Status Report
Reports
Project Status Report
 Reports
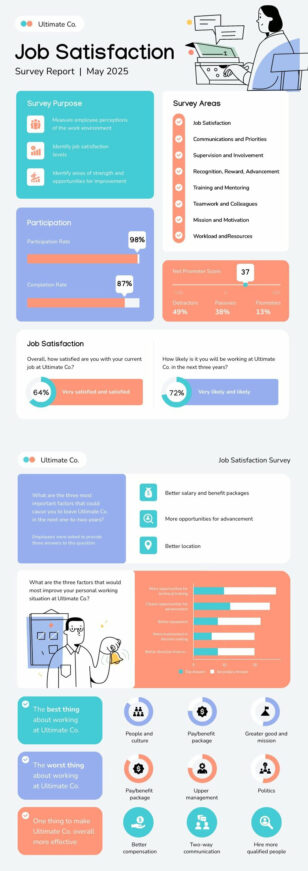
Job Satisfaction Survey
Reports
Job Satisfaction Survey
 Reports
Employee Engagement Survey Result
Reports
Employee Engagement Survey Result
 Reports
Modern Employee Satisfaction Survey
Reports
Modern Employee Satisfaction Survey
 Reports
Employee Engagement Strategies
Reports
Employee Engagement Strategies
 Reports
Simple Employee Engagement Survey
Reports
Simple Employee Engagement Survey
 Reports
Nonprofit Investment White Paper
Reports
Nonprofit Investment White Paper
 Reports
One Page White Paper
Reports
One Page White Paper
 Reports
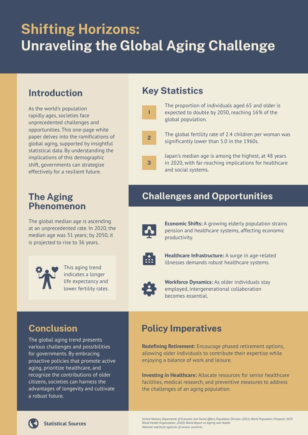
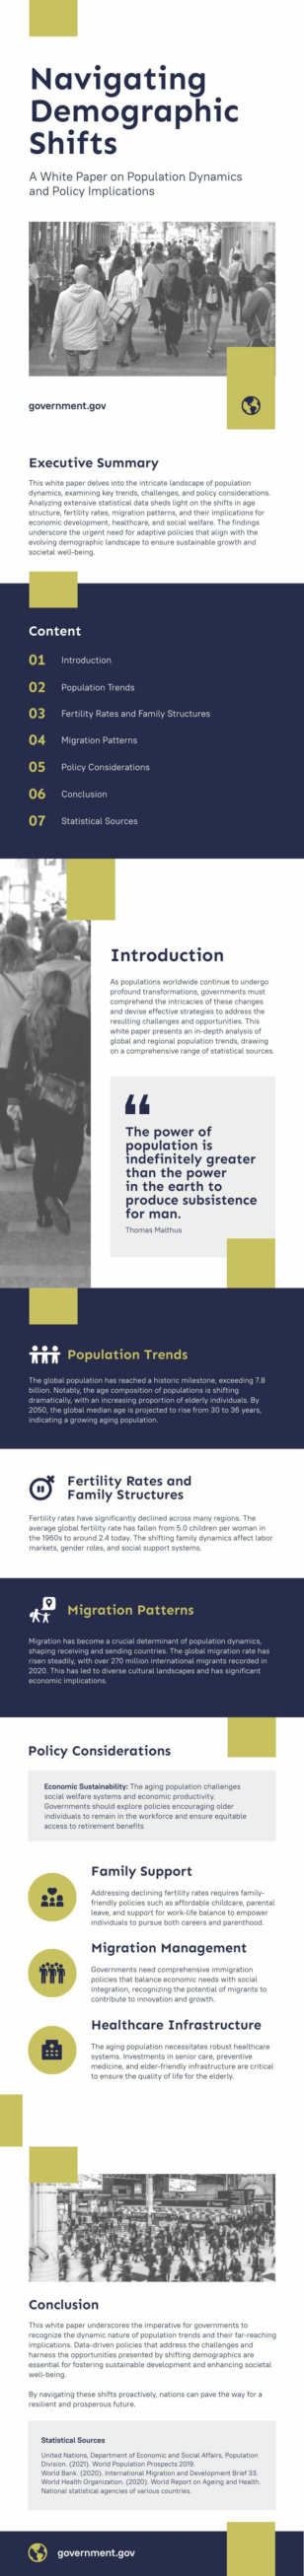
Government White Paper
Reports
Government White Paper
 Reports
Business White Paper
Reports
Business White Paper
 Reports
Technical White Paper
Reports
Technical White Paper
 Reports
Simple White Paper
Reports
Simple White Paper
 Reports
White Paper
Reports
White Paper
 Reports
Social Media White Paper
Reports
Social Media White Paper
 Reports
Marketing White Paper
Reports
Marketing White Paper
 Reports
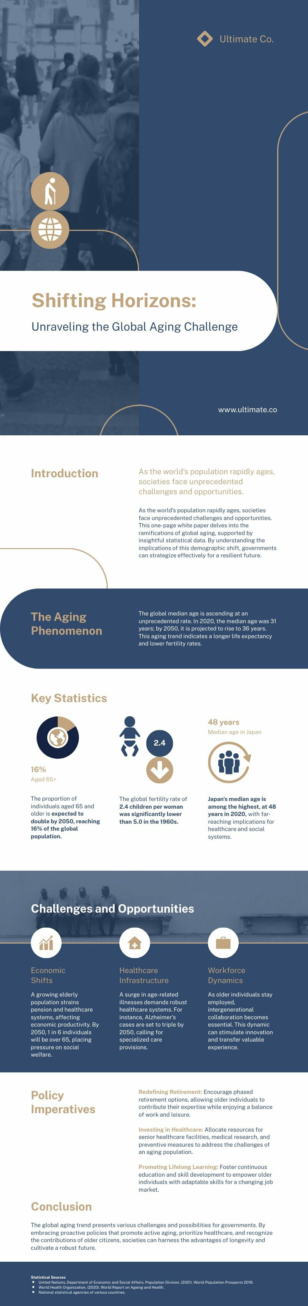
Technology White Paper
Reports
Technology White Paper
 Reports
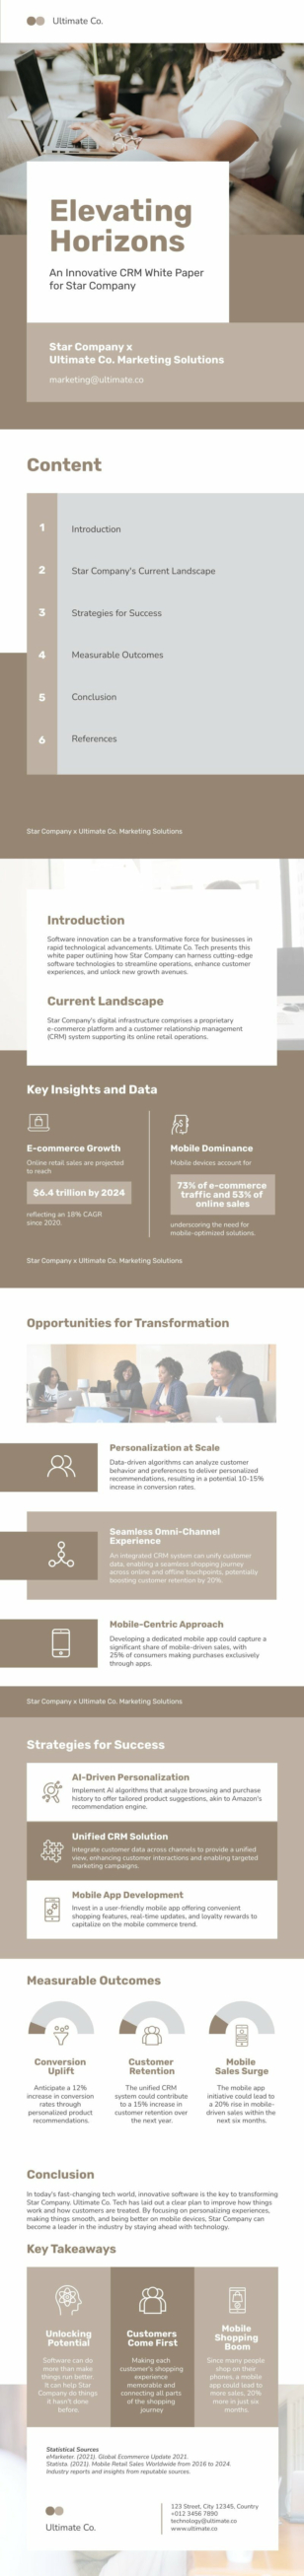
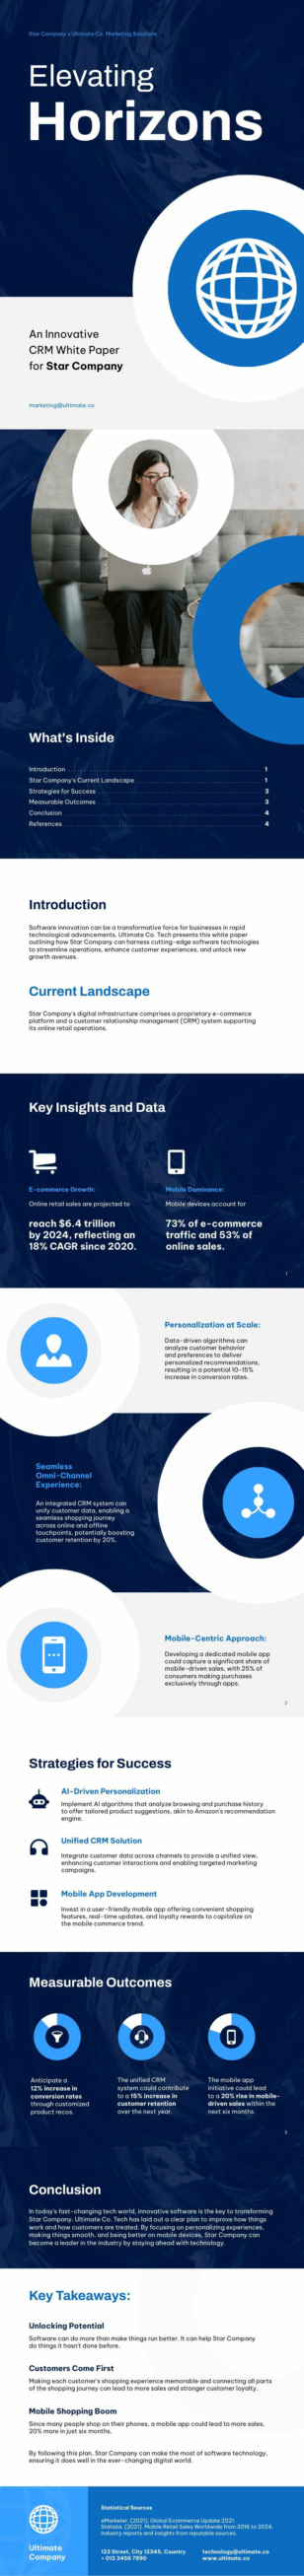
Software White Paper
Reports
Software White Paper
Stunning Report Templates: Transform Your Data Visually
From annual financial reports to monthly marketing analyses, our collection of report templates lets you present data in a visually compelling manner. Each template is crafted by professional designers, ensuring a polished and impactful final product.
Our user-friendly interface allows you to customize every aspect of your chosen template. Modify colors, fonts, and layouts to align with your brand identity or personal preferences. Integrate charts, graphs, and icons seamlessly to showcase your data effectively. With Piktochart, you can transform complex information into clear, engaging visuals that resonate with your audience.
Experience the power of visual storytelling in your reports. Our templates guide you through the process of organizing and presenting your data, helping you create narratives that capture attention and drive action. Whether you’re a seasoned designer or a novice, Piktochart’s intuitive tools make it simple to produce professional-quality reports that stand out.