Piktochart Templates Reports / Business
Business Report Templates
Transform your data into visually compelling stories using our diverse range of customizable business report templates. Impress stakeholders with professional designs.
Business Report Templates
 Business
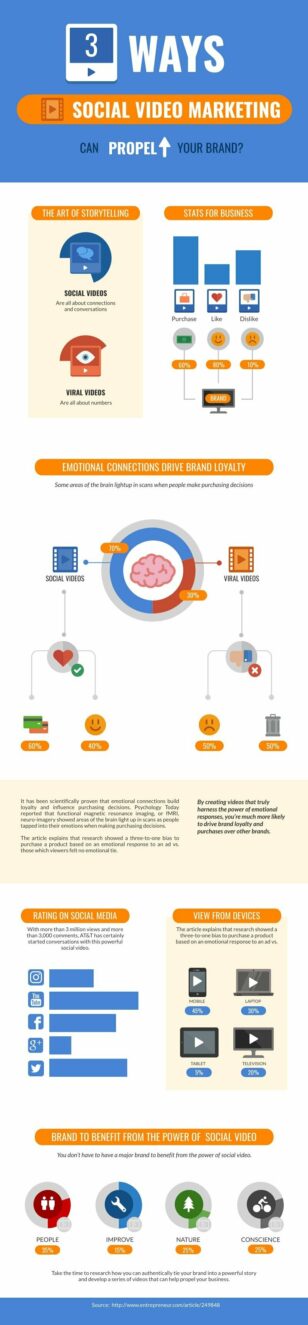
Social Video Marketing Report
Business
Social Video Marketing Report
 Business
 Proposal Report
Business
Business Proposal Report
 Business
Marketing Overview Report
Business
Marketing Overview Report
 Business
Social Media Report
Business
Social Media Report
 Business
Audience Report
Business
Audience Report
 Business
 Proposal
Business
Business Proposal
 Business
Overview Marketing Newsletter
Business
Overview Marketing Newsletter
 Business
Customer Case Study Report
Business
Customer Case Study Report
 Business
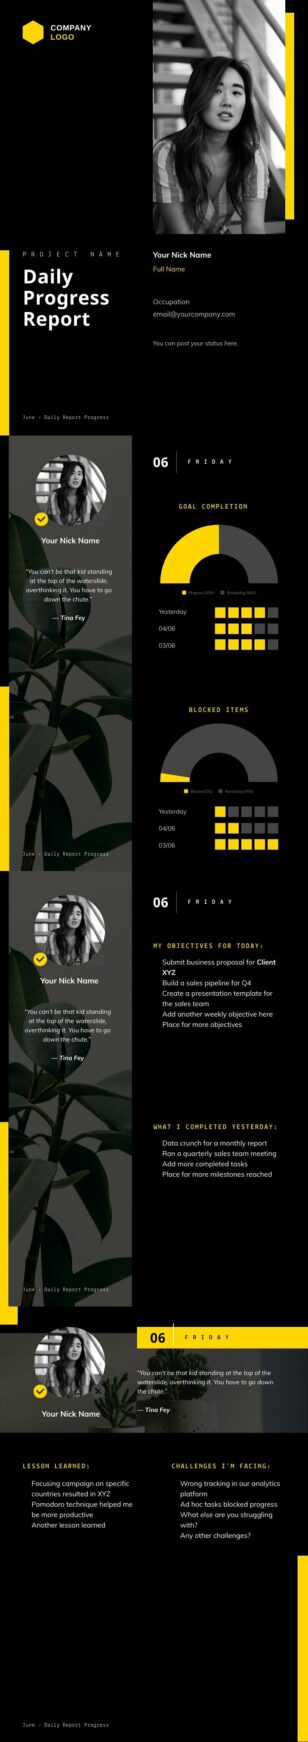
Daily Progress Report
Business
Daily Progress Report
 Business
Marketing Guidebook
Business
Marketing Guidebook
 Business
Team Progress
Business
Team Progress
 Business
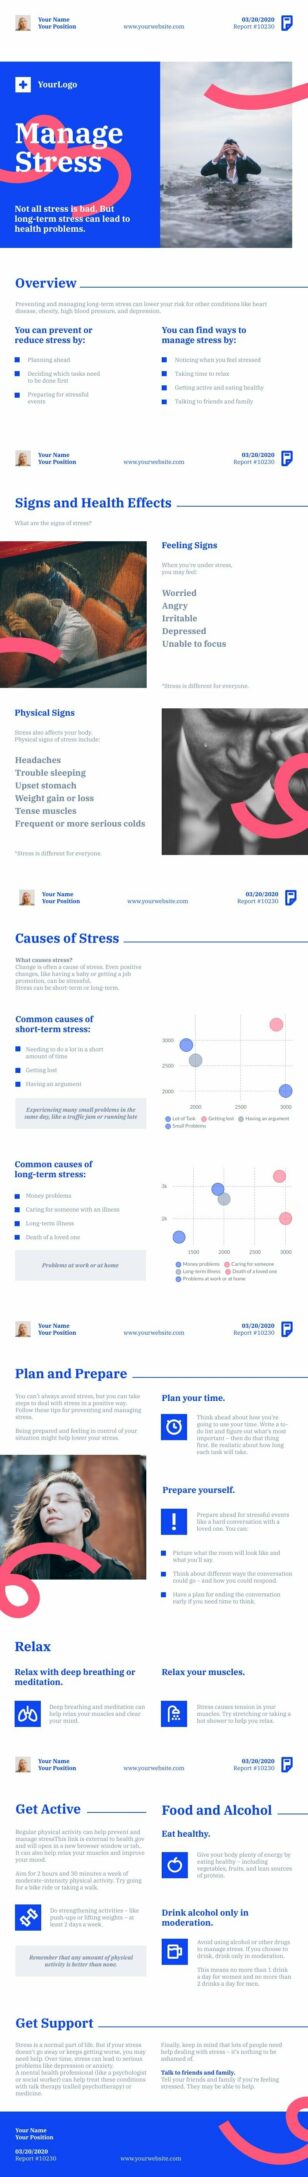
Manage Stress
Business
Manage Stress
 Business
Corporate Annual Report
Business
Corporate Annual Report
 Business
Annual Review
Business
Annual Review
 Business
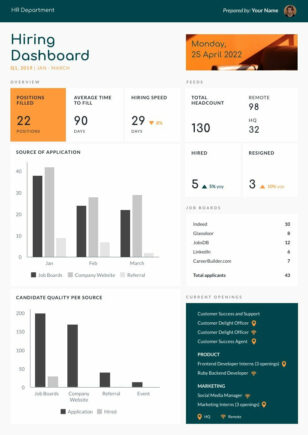
Hiring Dashboard
Business
Hiring Dashboard
 Business
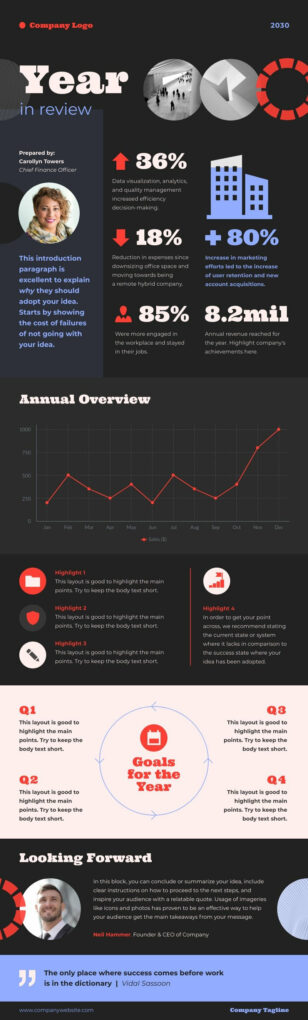
Year In Review
Business
Year In Review
 Business
HR Annual Report
Business
HR Annual Report
 Business
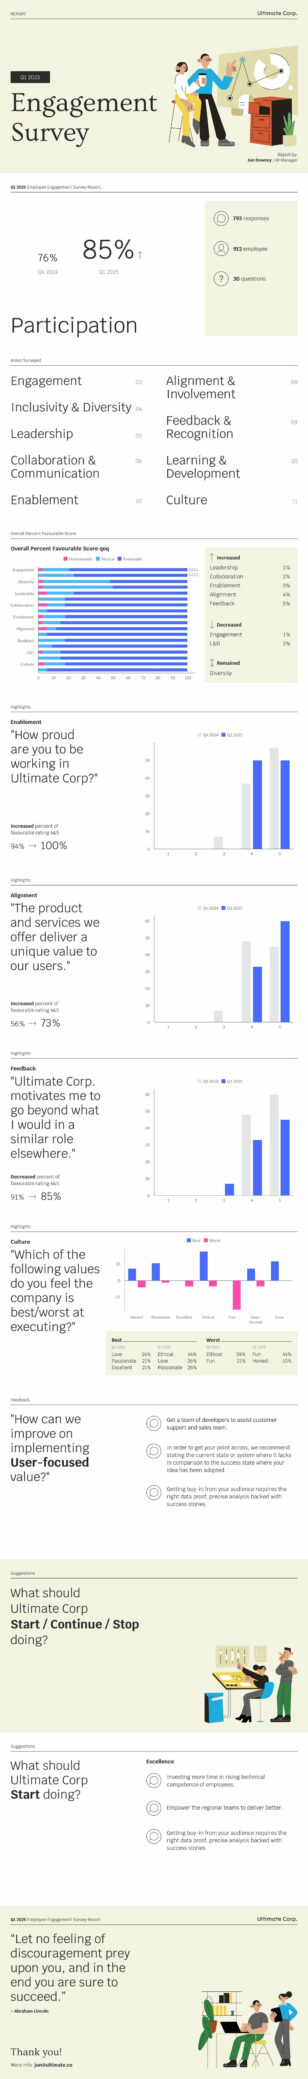
Employee Engagement Survey Report
Business
Employee Engagement Survey Report
 Business
Corporate Financial Review
Business
Corporate Financial Review
 Business
Internal Audit Report
Business
Internal Audit Report
 Business
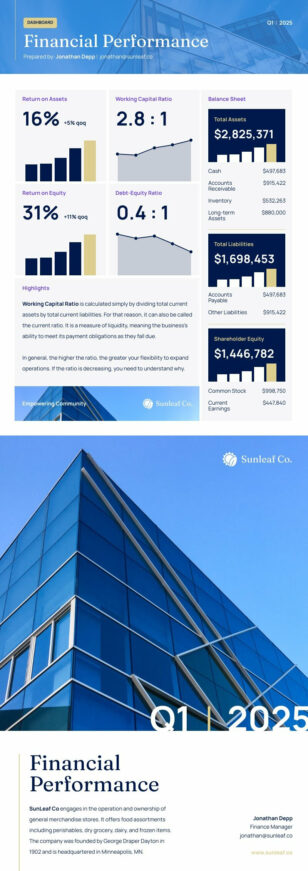
Financial Performance Report
Business
Financial Performance Report
 Business
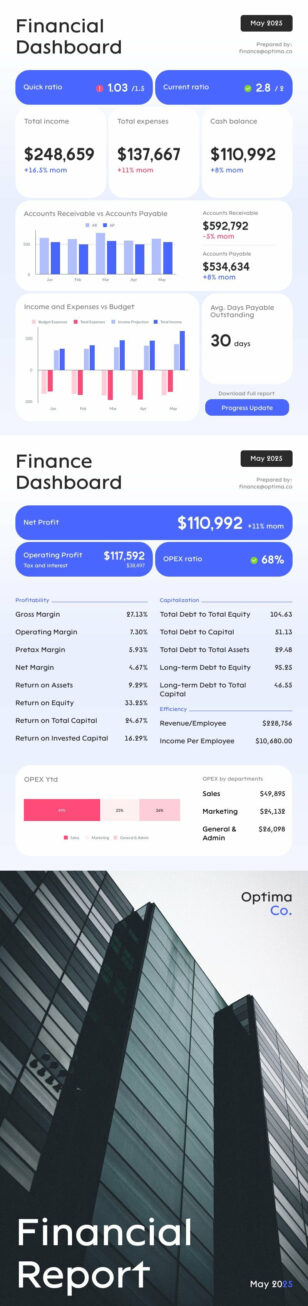
Financial Analysis Report
Business
Financial Analysis Report
 Business
Talent Management Report
Business
Talent Management Report
 Business
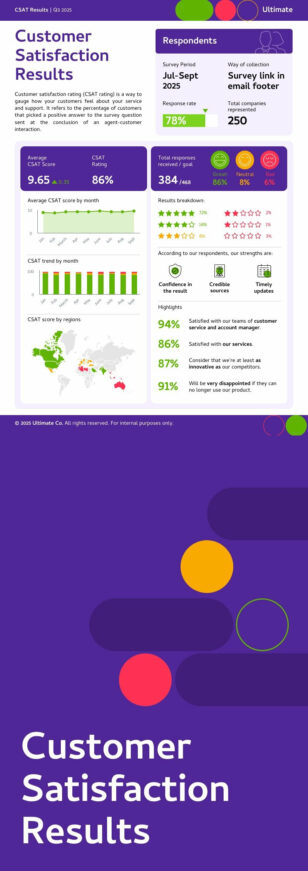
CSAT Results
Business
CSAT Results
 Business
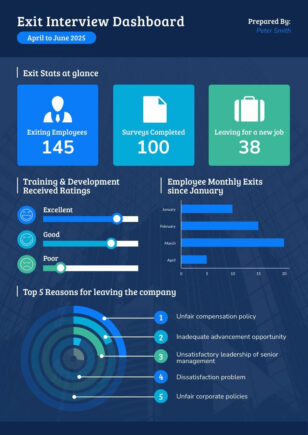
Exit Interview Dashboard
Business
Exit Interview Dashboard
 Business
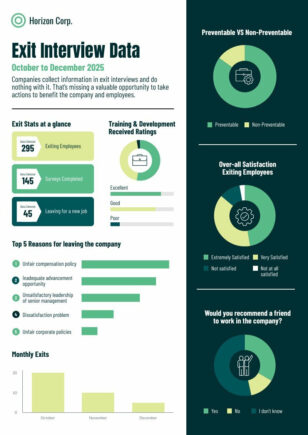
Exit Interview Data
Business
Exit Interview Data
 Business
SDG Report
Business
SDG Report
 Business
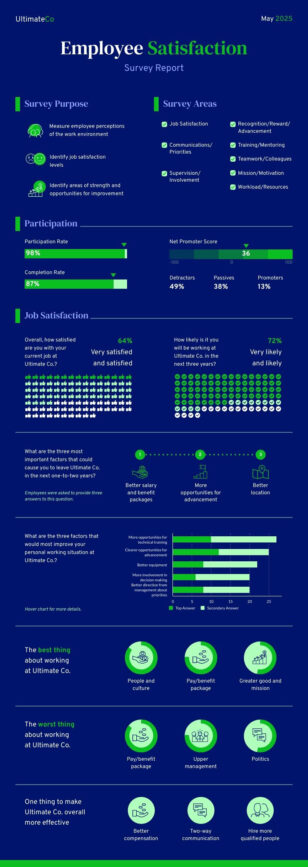
Employee Satisfaction Report
Business
Employee Satisfaction Report
 Business
Corporate Sustainability Report
Business
Corporate Sustainability Report
 Business
CSR Report
Business
CSR Report
 Business
Sustainability Report
Business
Sustainability Report
 Business
Global Reporting Initiatives
Business
Global Reporting Initiatives
 Business
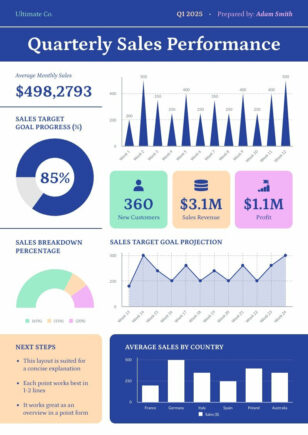
Quarterly Report
Business
Quarterly Report
 Business
Trend Report
Business
Trend Report
 Business
Project Progress
Business
Project Progress
 Business
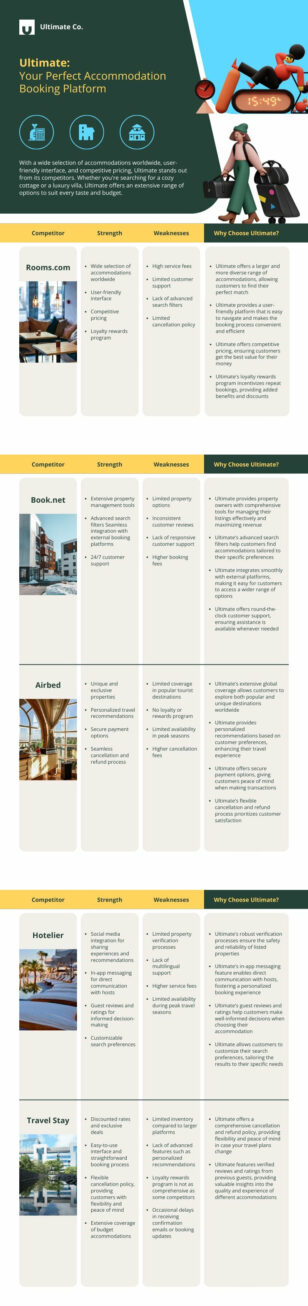
Modern Competitor Analysis
Business
Modern Competitor Analysis
 Business
Mid Year Review
Business
Mid Year Review
 Business
Employee Training Plan
Business
Employee Training Plan
 Business
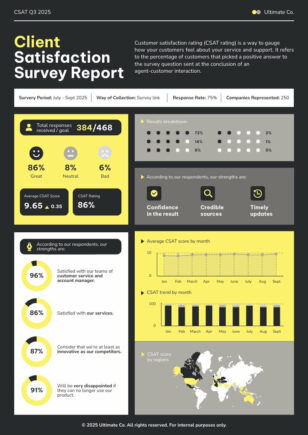
Client Satisfaction Survey
Business
Client Satisfaction Survey
 Business
Training Report
Business
Training Report
 Business
Simple Survey Report
Business
Simple Survey Report
 Business
Modern Employee Handbook
Business
Modern Employee Handbook
 Business
Company Handbook
Business
Company Handbook
 Business
Individual Development Plan
Business
Individual Development Plan
 Business
Roles and Responsibility
Business
Roles and Responsibility
 Business
Employee Policy
Business
Employee Policy
 Business
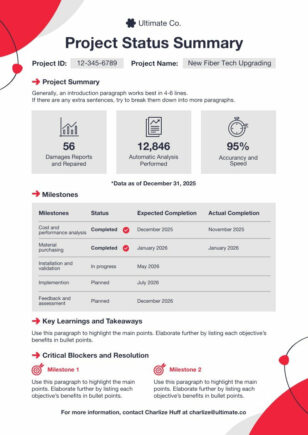
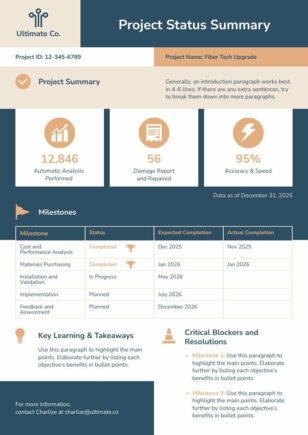
Project Status Report
Business
Project Status Report
Business report templates for teams and leadership
Piktochart’s business report templates offer a solution for professionals seeking to present data in an engaging, visually appealing format. Our diverse collection caters to various industries and reporting needs, from monthly sales updates to comprehensive annual reviews.
Each template is designed with user-friendliness in mind. You can easily customize colors, fonts, and layouts to match your brand identity. Add your own data, charts, and images with our intuitive drag-and-drop interface. The result? Professional-looking reports created in a fraction of the time it would take to design from scratch.
By using Piktochart’s templates, you’re not only saving time but also enhancing the impact of your reports. Visual storytelling helps convey complex information more effectively, making it easier for your audience to grasp key insights. Start creating reports that captivate and inform with Piktochart today.
Want a business report in seconds? Try our AI business report generator — describe your data and the tool drafts a fully editable report you can refine in our editor.
Business Report FAQs
What sections should a business report include?
A standard business report includes an executive summary, introduction, findings, analysis, recommendations, and a conclusion — Piktochart’s templates follow this structure so you don’t have to start from scratch.
How do I turn raw data into a business report quickly?
Paste your numbers into a Piktochart chart block, pick a template that fits the report type (monthly, quarterly, annual), and the visuals update automatically.
Can I create a monthly sales or marketing report from a template?
Yes — Piktochart has dedicated templates for monthly sales, marketing performance, and project status reports that you can customise with your KPIs in minutes.
How do I include charts and graphs in a business report?
Drag any of Piktochart’s built-in chart types (bar, line, pie, area, donut) into your report and connect them to your data — no Excel or external chart tool needed.
Can I export a business report as a PDF for stakeholders?
Yes — every Piktochart business report exports to high-resolution PDF, PNG, or PPTX so you can share it via email, Slack, or upload it to your reporting platform.