Piktochart Templates Infographics / Statistical
Free Statistical Infographic Templates
Transform raw data into clear, visually compelling statistical infographics. Customize charts, graphs, and data visualizations with your own numbers — then download, embed, or share.
Statistical Infographic Templates for Reports, Research, and Presentations
 Statistical
Social Connection
Statistical
Social Connection
 Statistical
Content Stats Instagram Post
Statistical
Content Stats Instagram Post
 Statistical
Content Stats LinkedIn Post
Statistical
Content Stats LinkedIn Post
 Statistical
Content Stats Twitter Post
Statistical
Content Stats Twitter Post
 Statistical
Content Stats Twitter Header
Statistical
Content Stats Twitter Header
 Statistical
Facebook Ad Stats
Statistical
Facebook Ad Stats
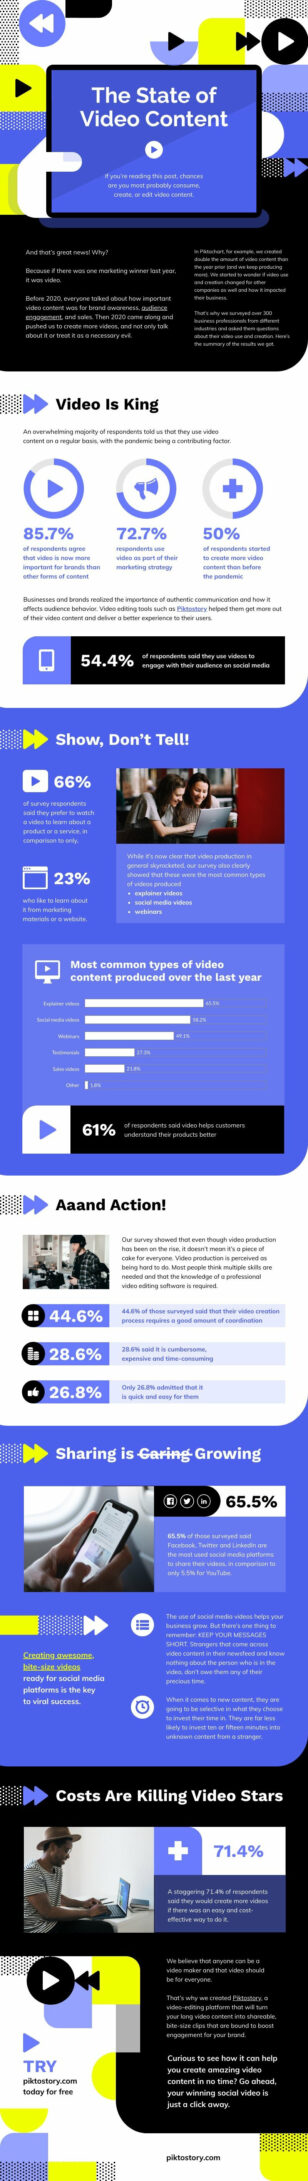 Statistical
Video Stats
Statistical
Video Stats
 Statistical
Employee Engagement Survey
Statistical
Employee Engagement Survey
 Statistical
Medical Stats
Statistical
Medical Stats
 Statistical
Modern Medical Stats
Statistical
Modern Medical Stats
 Statistical
Artificial Intelligence Statistics
Statistical
Artificial Intelligence Statistics
Turn Complex Data into Clear Visual Stories with Statistical Infographics
Numbers tell a story, but only if people can understand them. Statistical infographics transform dense datasets into visual narratives that make trends, comparisons, and insights immediately clear. Whether you’re presenting survey results, annual performance metrics, research findings, or market data, a well-designed statistical infographic helps your audience grasp the key takeaways at a glance.
Piktochart’s statistical infographic templates include layouts for bar charts, pie charts, line graphs, comparison tables, and data dashboards. Customize every data point, adjust color coding to match your brand, and add annotations that guide readers through the story your numbers are telling. No design or data visualization experience required.
Data analysts, researchers, marketers, educators, and business leaders use statistical infographics to make reports more engaging and presentations more persuasive. From annual reports and academic research posters to social media data stories and client dashboards, the right template turns your spreadsheet into something people actually want to look at.
Build your statistical infographic with Piktochart’s AI infographic maker — input your data and get a polished visualization you can customize and share right away.