Piktochart Templates Diagrams / Venn
Venn Diagram Templates
Create stunning Venn diagrams in minutes. Our user-friendly interface and customizable templates help you transform complex data into clear, impactful visuals. Apply your brand colors, download in various formats, and share your insights effortlessly.
Venn Diagram Templates
 Venn
Content Strategy Hexagon Venn Diagram
Venn
Content Strategy Hexagon Venn Diagram
 Venn
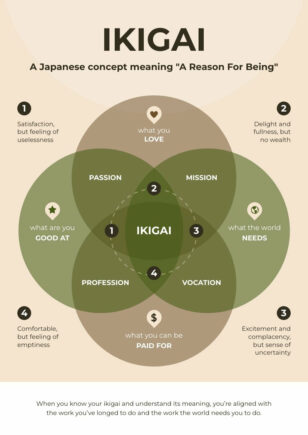
Ikigai 4-Way Venn Diagram
Venn
Ikigai 4-Way Venn Diagram
 Venn
Growth Zone Venn Diagram
Venn
Growth Zone Venn Diagram
 Venn
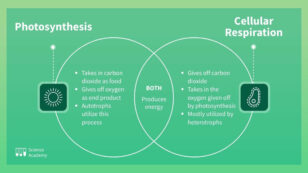
Photosynthesis vs. Cellular Respiration
Venn
Photosynthesis vs. Cellular Respiration
 Venn
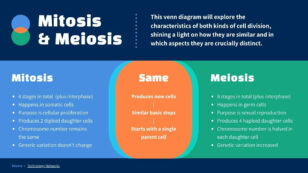
Mitosis and Meiosis Venn Diagram
Venn
Mitosis and Meiosis Venn Diagram
 Venn
Content Plan Venn Diagram
Venn
Content Plan Venn Diagram
Venn diagram templates for overlaps and comparisons
Venn diagrams simplify complex relationships, making them an indispensable tool for students, professionals, and educators alike. Our online platform puts the power of visual communication at your fingertips, allowing you to create professional-looking Venn diagrams without the need for design expertise or expensive software.
Choose from our wide selection of customizable templates to jumpstart your project. Whether you’re comparing market segments, analyzing data sets, or illustrating overlapping concepts, our intuitive drag-and-drop interface lets you bring your ideas to life in minutes. Adjust colors, fonts, and sizes with ease to match your brand or personal style.
Time saved on design means more time for what counts. Present your findings with confidence, knowing your Venn diagram clearly communicates your message. From business presentations to classroom assignments, our templates help you make a lasting impression. Why struggle with complicated design tools when you can create eye-catching Venn diagrams in a few clicks?
Remember, great ideas deserve great visuals. Don’t let your insights get lost in translation – let our Venn diagram templates do the heavy lifting. After all, why explain when you can show?
Want a Venn diagram in seconds? Try our AI diagram generator — describe your concepts and the tool produces a Venn diagram you can refine in our editor.
Venn Diagram FAQs
How many circles can a Venn diagram have?
Two- and three-circle Venn diagrams are most common; four- and five-circle versions are possible but harder to read — Piktochart includes templates for 2, 3, and 4 circles.
What’s the difference between a Venn diagram and an Euler diagram?
A Venn diagram shows all possible overlaps even when some are empty; an Euler diagram only draws the overlaps that actually exist — Piktochart supports both styles.
Can I add labels and data inside each Venn diagram region?
Yes — every Piktochart Venn template has editable text fields in each circle and overlap region so you can label them with concepts, examples, or percentages.
How do I customise the colours and transparency of Venn circles?
Click any circle to change its fill colour and adjust transparency — Piktochart’s editor lets you tune both so overlapping regions stay readable.
Can I export a Venn diagram for use in a slide deck or document?
Yes — export to PNG (with optional transparent background), PDF, or PPTX to drop straight into your presentation or report.