Piktochart Templates Diagrams / Quadrant
Quadrant Chart Templates
Struggling to present complex data? Our quadrant chart templates simplify visualization. Choose from various designs, customize with a click, and download in multiple formats. Apply your brand style for consistency across all visuals. No design skills? No problem.
Quadrant Chart Templates
 Quadrant
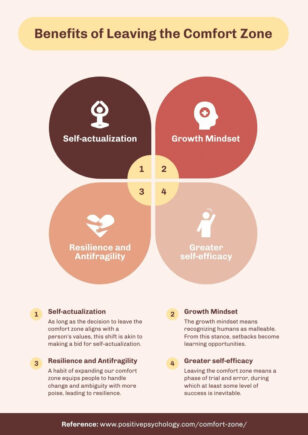
Getting Out of the Comfort Zone
Quadrant
Getting Out of the Comfort Zone
 Quadrant
s Graph
Quadrant
Quadrants Graph
 Quadrant
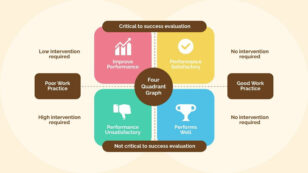
Four Quadrant Graph
Quadrant
Four Quadrant Graph
 Quadrant
4 Quadrant Graph
Quadrant
4 Quadrant Graph
 Quadrant
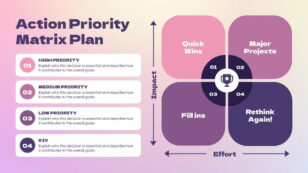
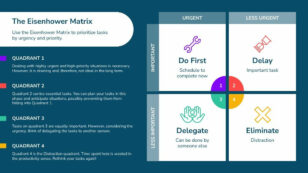
Action Priority Matrix Plan
Quadrant
Action Priority Matrix Plan
 Quadrant
4 Quadrants
Quadrant
4 Quadrants
 Quadrant
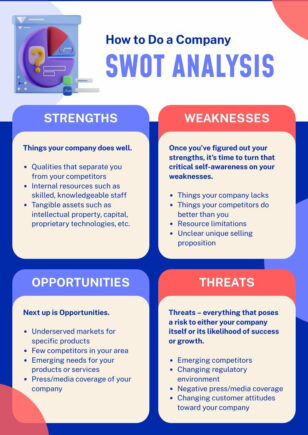
SWOT Analysis of a Company
Quadrant
SWOT Analysis of a Company
 Quadrant
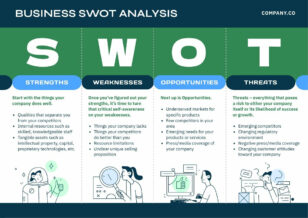
SWOT Analysis of a Business
Quadrant
SWOT Analysis of a Business
 Quadrant
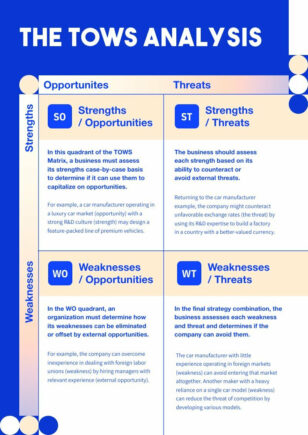
TOWS Analysis
Quadrant
TOWS Analysis
 Quadrant
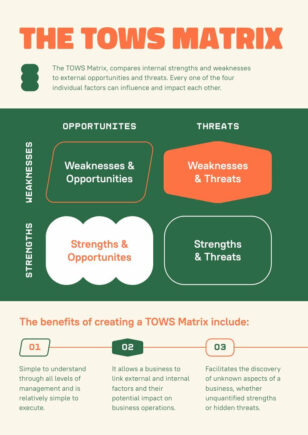
TOWS Matrix
Quadrant
TOWS Matrix
 Quadrant
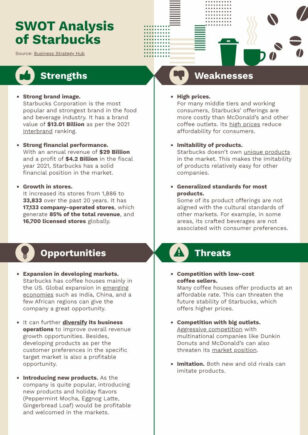
Starbucks’ SWOT Analysis
Quadrant
Starbucks’ SWOT Analysis
 Quadrant
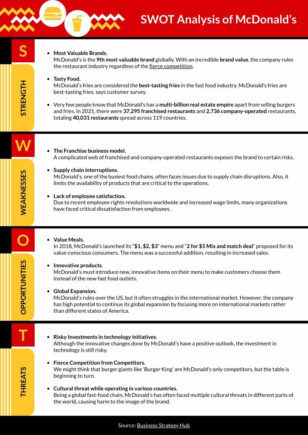
McDonald’s SWOT Analysis
Quadrant
McDonald’s SWOT Analysis
 Quadrant
Personal SWOT
Quadrant
Personal SWOT
 Quadrant
SWOT Matrix
Quadrant
SWOT Matrix
 Quadrant
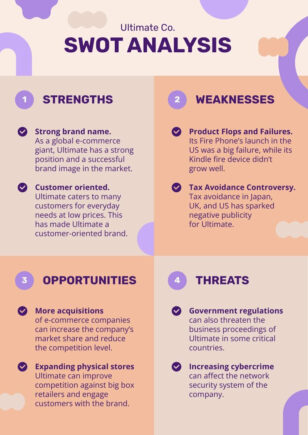
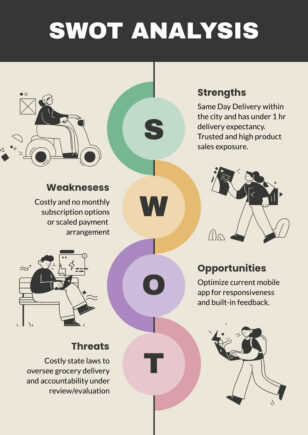
Modern SWOT Analysis
Quadrant
Modern SWOT Analysis
 Quadrant
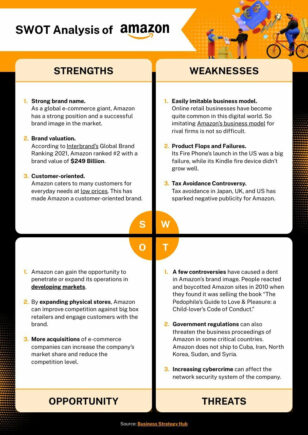
Amazon’s SWOT Analysis
Quadrant
Amazon’s SWOT Analysis
 Quadrant
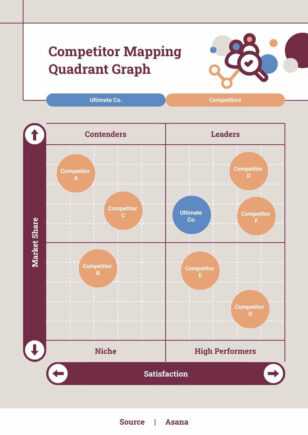
Competitor Mapping
Quadrant
Competitor Mapping
 Quadrant
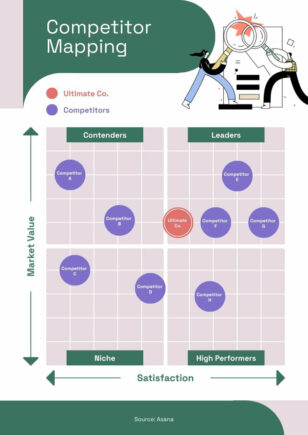
Modern Competitor Mapping
Quadrant
Modern Competitor Mapping
 Quadrant
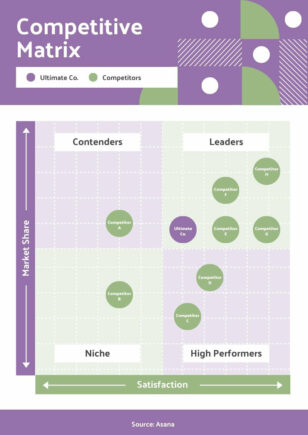
Competitive Matrix
Quadrant
Competitive Matrix
 Quadrant
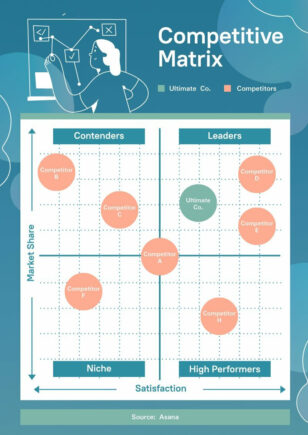
Modern Competitive Matrix
Quadrant
Modern Competitive Matrix
 Quadrant
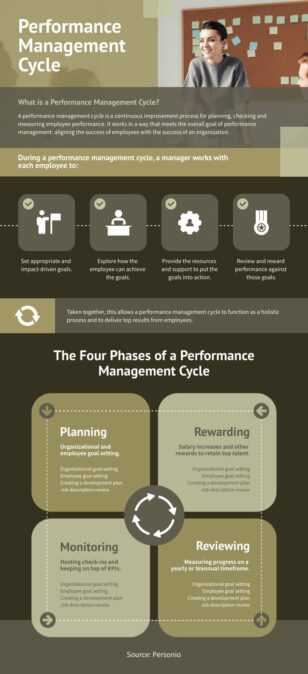
Performance Management Cycle
Quadrant
Performance Management Cycle
Quadrant chart templates for decision frameworks
Quadrant charts offer a powerful way to visualize complex relationships and data. Whether you’re crafting a SWOT analysis, BCG matrix, or prioritization framework, our templates provide the perfect foundation for your visual storytelling.
Gone are the days of struggling with complicated design software or settling for bland, uninspiring charts. Our intuitive editor empowers you to create professional-quality quadrant charts in minutes. Simply select a template, input your data, and watch as your information springs to life in vibrant, engaging visuals.
From business strategists to students, anyone can harness the clarity of quadrant charts. No more drowning in spreadsheets or losing your audience with text-heavy presentations. With our templates, you’ll transform confusing concepts into crystal-clear visuals faster than you can say “four-quadrant analysis.”
Want a quadrant chart in seconds? Try our AI diagram generator — describe your framework and the tool produces a quadrant chart you can refine in our editor.
Quadrant Chart FAQs
What is a quadrant chart used for?
Quadrant charts (also called 2×2 matrices) help compare items across two dimensions — common examples are SWOT analysis, the Eisenhower urgency-importance matrix, and the BCG growth-share matrix.
Can I create a SWOT analysis with a Piktochart quadrant template?
Yes — Piktochart includes ready-made SWOT analysis templates with placeholders for Strengths, Weaknesses, Opportunities, and Threats.
How do I label the axes on a quadrant chart?
Click each axis label and type your dimension names (e.g. Impact vs Effort, Cost vs Value) — every Piktochart quadrant template has editable axis labels.
Can I add icons or images inside each quadrant cell?
Yes — drag icons from Piktochart’s library or upload your own images to make each quadrant scannable at a glance.
How do I export a quadrant chart for a presentation or report?
Export to PNG to embed in slides, PDF for handouts, or share a live link to keep collaborators in sync.