Infographic examples for students turn dense research, complicated processes, and multi-step concepts into visuals people actually remember. Studies confirm it: students retain 80% of what they see, compared to 20% of what they read.
This collection brings together 15 infographic examples built for classroom use, group projects, and individual assignments. Each one comes with an editable template you can customize in minutes using Piktochart’s Infographic maker. No Photoshop or Illustrator required.
Below, you will find examples for science, history, language arts, and more, along with step-by-step guidance on building your own. Whether you are a teacher preparing lesson materials or a student working on a presentation, these infographic examples give you a head start.
Table of contents
Want to jump right into creating infographics? Sign up for free and get access to our constantly updated library of infographic templates.
What is an infographic?
An infographic is a visual representation of information, data, or knowledge designed with an infographic software to make complex topics easy to understand at a glance. Think of it as a blend of graphics, charts, icons, and text working together to tell a story or explain a concept.
For example, instead of writing three paragraphs about the water cycle, you could create an infographic with arrows, illustrations, and labels showing evaporation, condensation, and precipitation in seconds.
Infographics work because our brains process visuals 60,000 times faster than text. When you combine data with design, you create something memorable, shareable, and far more engaging than a wall of words.
How infographics promote student learning
Text-based learning is no match for visual aids such as infographics in the classroom. Many studies have shown that visuals improve learning.
Here are the core benefits of infographics in education:
1. Better retention
Students, like most people, can retain about 10% of what they hear, and just 20% percent of what they read. Do you know how much they retain of what they can see? A whopping 80%.
This makes visuals a great way to ensure students can focus on — and remember more of — what they are learning.
2. High engagement
Infographics don’t just ensure a deeper level of learning, but also keep students engaged. And this is vital in today’s day and age, where attention spans are at an all-time low.
In fact, visual aids can increase the motivation to learn and help prevent dullness during classroom sessions. In short, visuals make learning fun!
3. Easy comprehension
Since infographics use imagery to emphasize and explain text-based content, students can grasp the information much faster than reading plain text.
4. Improved analytical thinking
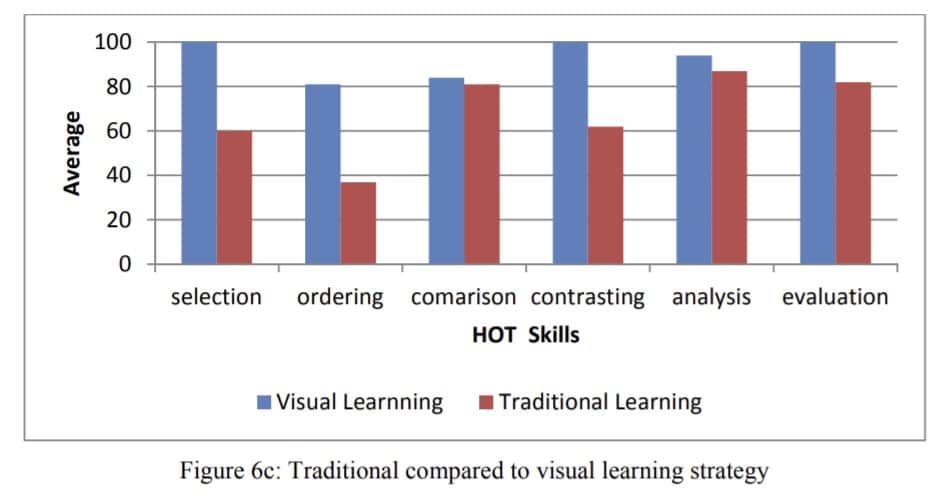
One of the most essential skills for any student is identifying patterns, deducing logic, and connecting the dots. And visuals help in all these areas because they improve critical thinking, according to research by IISTE.
As the following graph illustrates, students display a higher level of selection, ordering, comparison, and other characteristics when paired with visual learning as compared to traditional learning methods.
For these reasons, it’s evident why more and more educators are looking for ways to integrate visual elements into their curriculums.
How to Use Infographics in Your Classroom
Knowing why infographics work is one thing. Putting them into practice is another. Below are seven ways teachers and students can bring visual communication into everyday classwork, from five-minute warm-ups to semester-long projects.
Spark debates with a single visual
Post an infographic on a controversial or multi-sided topic at the start of class. Ask students to identify the argument, evaluate the data sources, and challenge any claims they find weak. A single infographic about screen time habits, for example, can fuel a 20-minute discussion in a health class without any extra prep from the teacher.
Assign infographic creation as a student project
Replace a traditional written report with an infographic assignment. Students still need to research, organize, and cite sources; the difference is they communicate their findings visually. Michelle Haiken, a teacher at Rye Middle School in New York, uses infographic projects to help students visualize complex literary themes and character relationships. Piktochart’s infographic maker gives students a drag-and-drop editor so they can focus on content rather than fighting design software.
Turn lecture slides into infographic handouts
Long slide decks lose students after the first few minutes. Condense key takeaways from a lecture into a one-page infographic handout students can reference later. One biology teacher at a Dallas high school reported a 30% improvement in quiz scores after switching from text-heavy slides to visual summaries.
Create visual essays for cross-curricular work
A visual essay combines written analysis with supporting graphics, charts, and images in a single document. History students can map the causes of a revolution. Science students can illustrate the stages of cell division. English students can chart a novel’s narrative arc. The format works across subjects and pushes students to think about hierarchy: what deserves the biggest visual space?
Run infographic challenges between teams
Split the class into small groups and give each team the same dataset. Each group creates an infographic telling a different story with the same numbers. At the end, the class votes on the most compelling version. This exercise builds data literacy, teamwork, and presentation skills in a single session.
Use infographics for student-led presentations
Rather than reading from note cards, students present their infographic to the class and walk through each section. The visual serves as both their speaking guide and their audience’s reference point. Teachers can share presentation templates so students start with a polished layout and spend their time on research.
Build classroom posters as reporting tools
End-of-unit posters summarize what the class learned over a multi-week topic. Small groups each own one section of the poster, creating visuals for their assigned sub-topic. Print the finished product with Piktochart’s poster maker and display it in the hallway or classroom. Students retain more when they teach the material to others, and a poster project makes every student a teacher.
Use these infographic examples to inspire your next learning session
Now that you know the benefits of infographics for students, we bet you’re pumped up and ready to create your own infographic.
But where do you start? What type of visuals can you create?
Use the following infographic examples for students as your inspiration.
1. Infographic about sentence fragments and run-ons
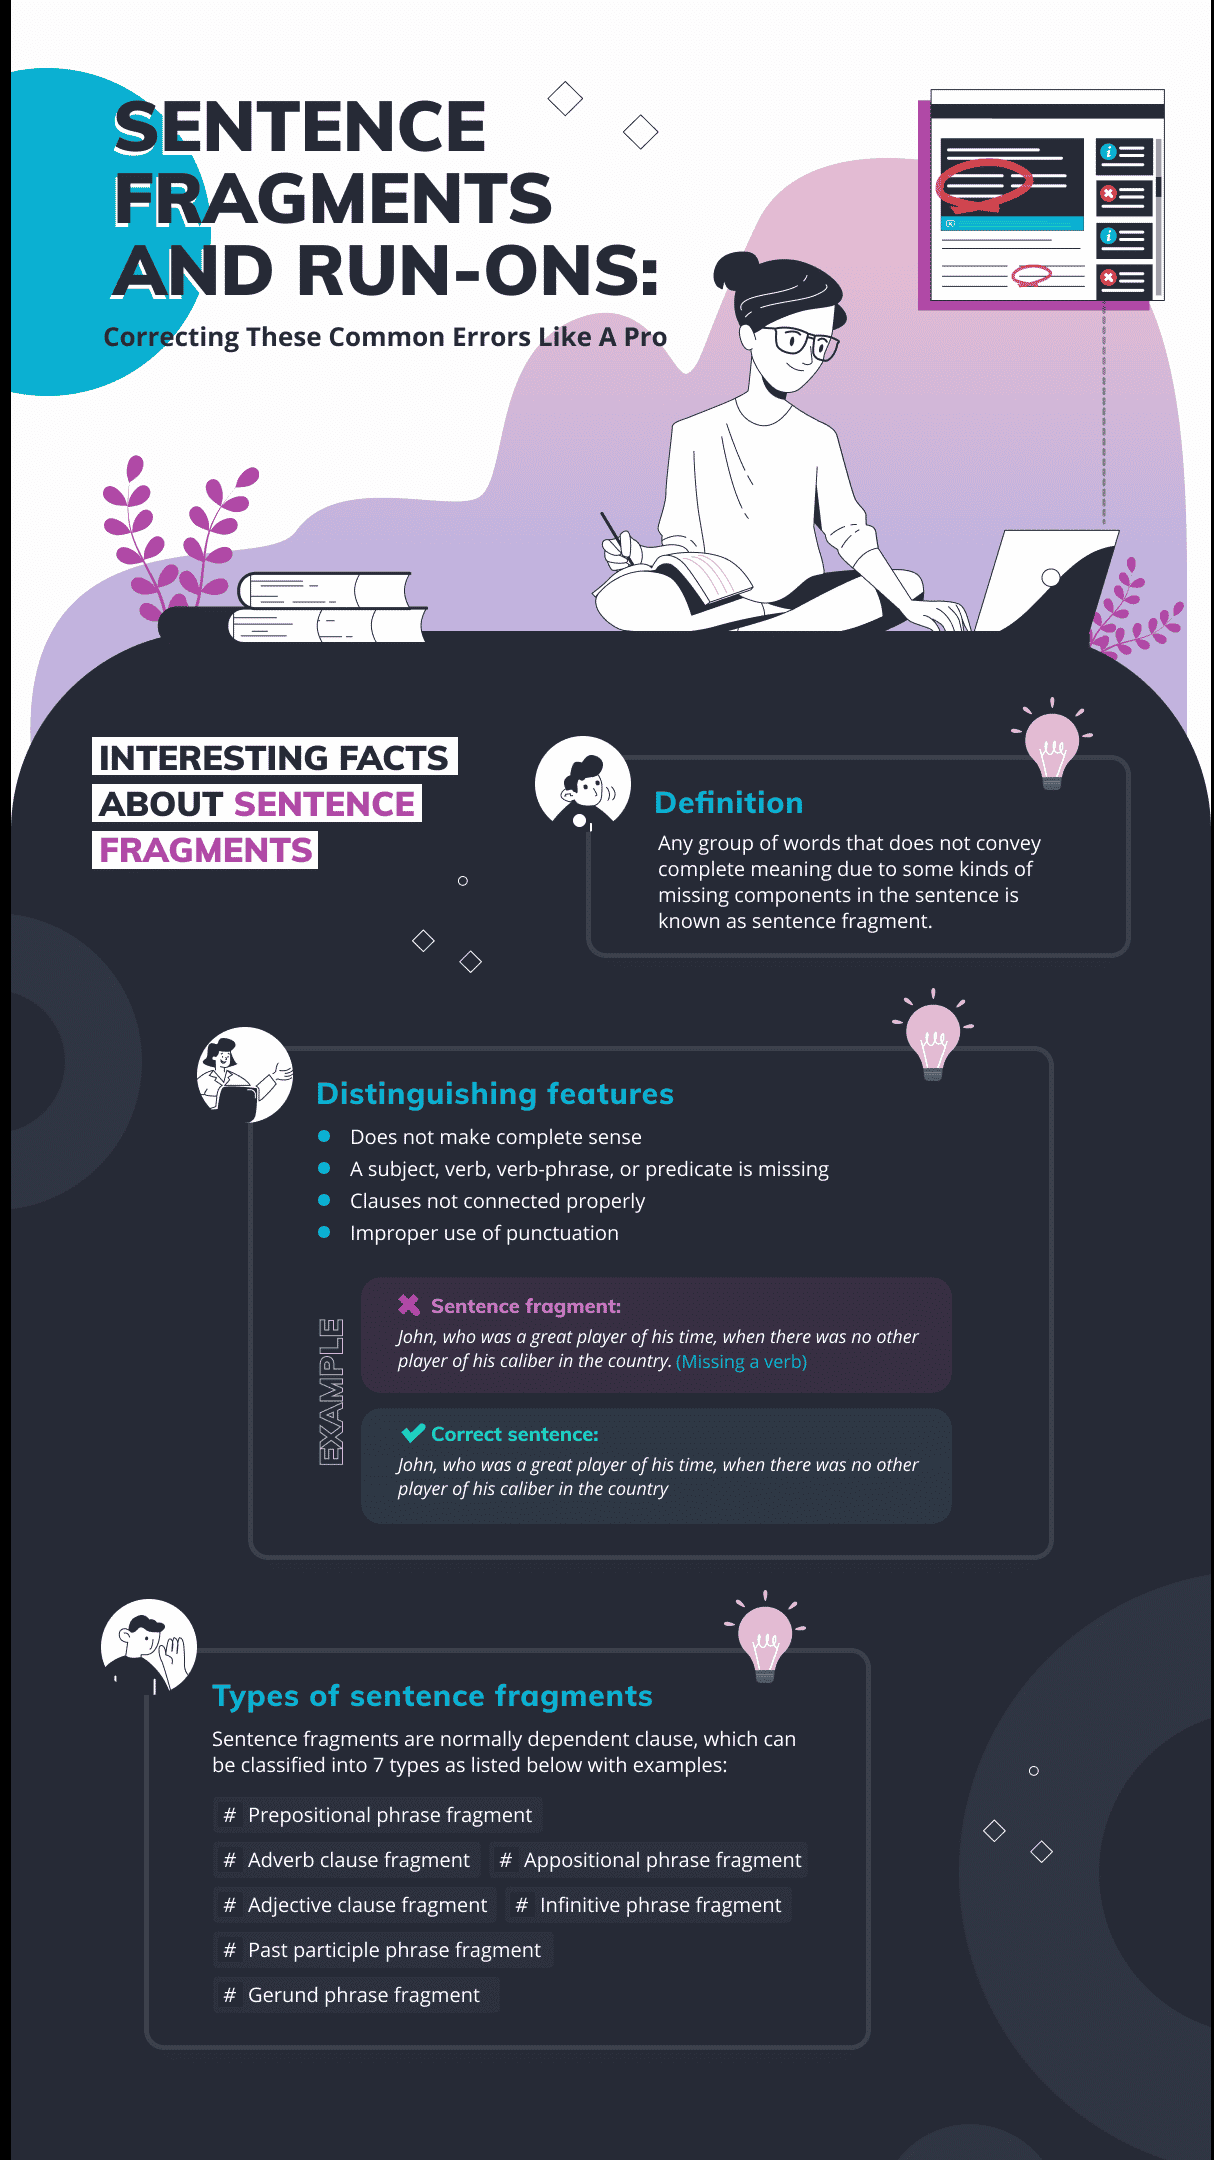
This education infographic example shows students how to correct common English errors like sentence fragments and run-ons.
Using white text, for the most part, on a black background makes it highly legible. And the sparingly used blue, green, and purple colors add a nice touch to the whole design. Plus, the light borders and small icons separate and organize each section neatly and beautifully for easy navigation.
2. Let’s explore the ocean infographic
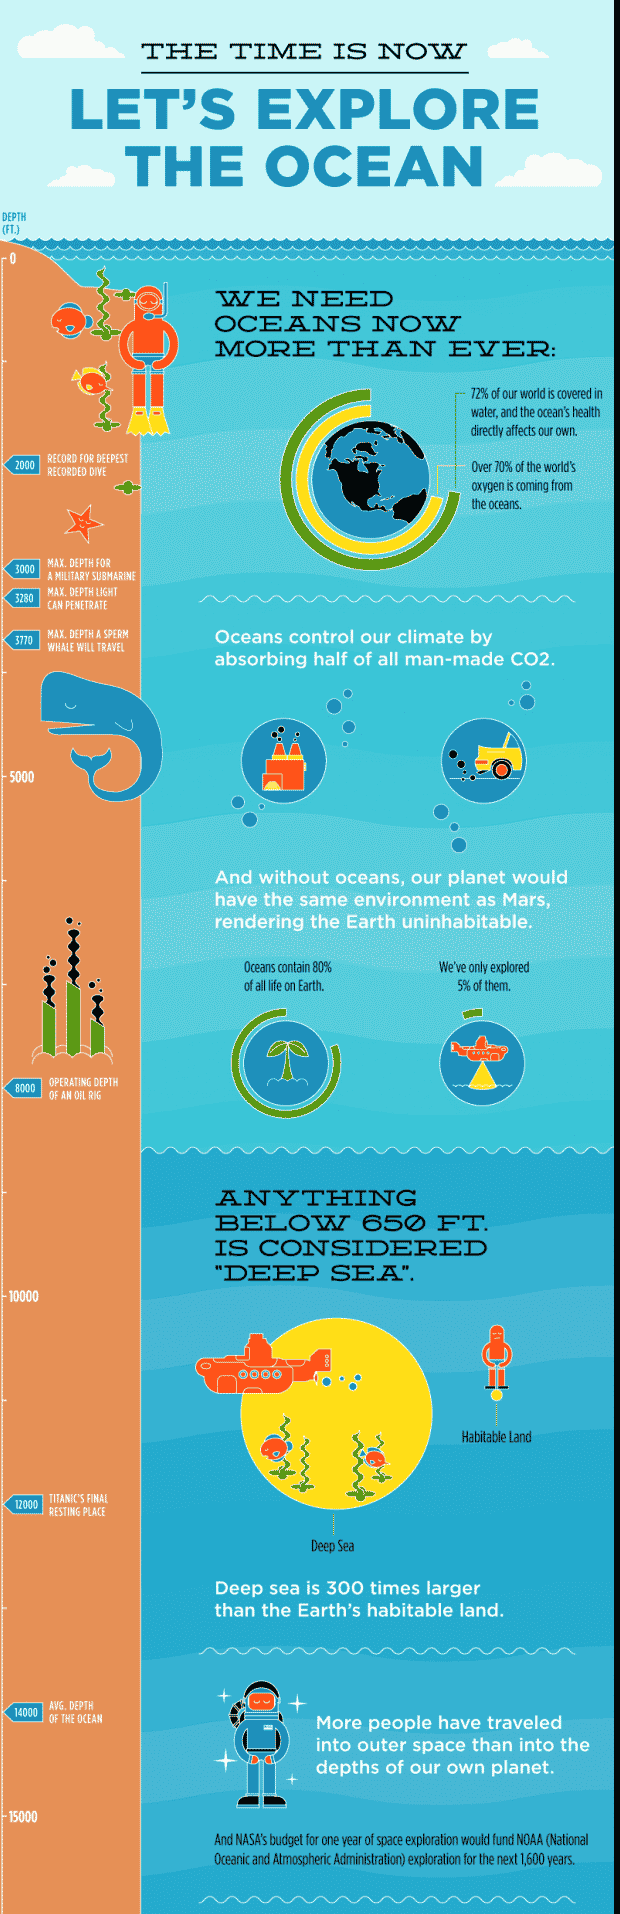
This infographic is great for your next science or geography class. As the information gets dense in the infographic, accenting colors have been used in the background to depict the concept of going deeper into the ocean. As a result, the infographic keeps viewers engaged from start to finish, and the content is easy to follow.
3. Comprehensive guide to mathematics infographic

This infographic example is great for situations when you want to cover a glossary of terms or a list of related items. It covers exactly what’s essential. Nothing more; nothing less.
Each element of the list captures attention instantly, and the icons provide a strong association for students to retain the meanings in the memory.
As a bonus, check out our free math worksheet templates!
4. How to study, get smarter, and succeed in school infographic
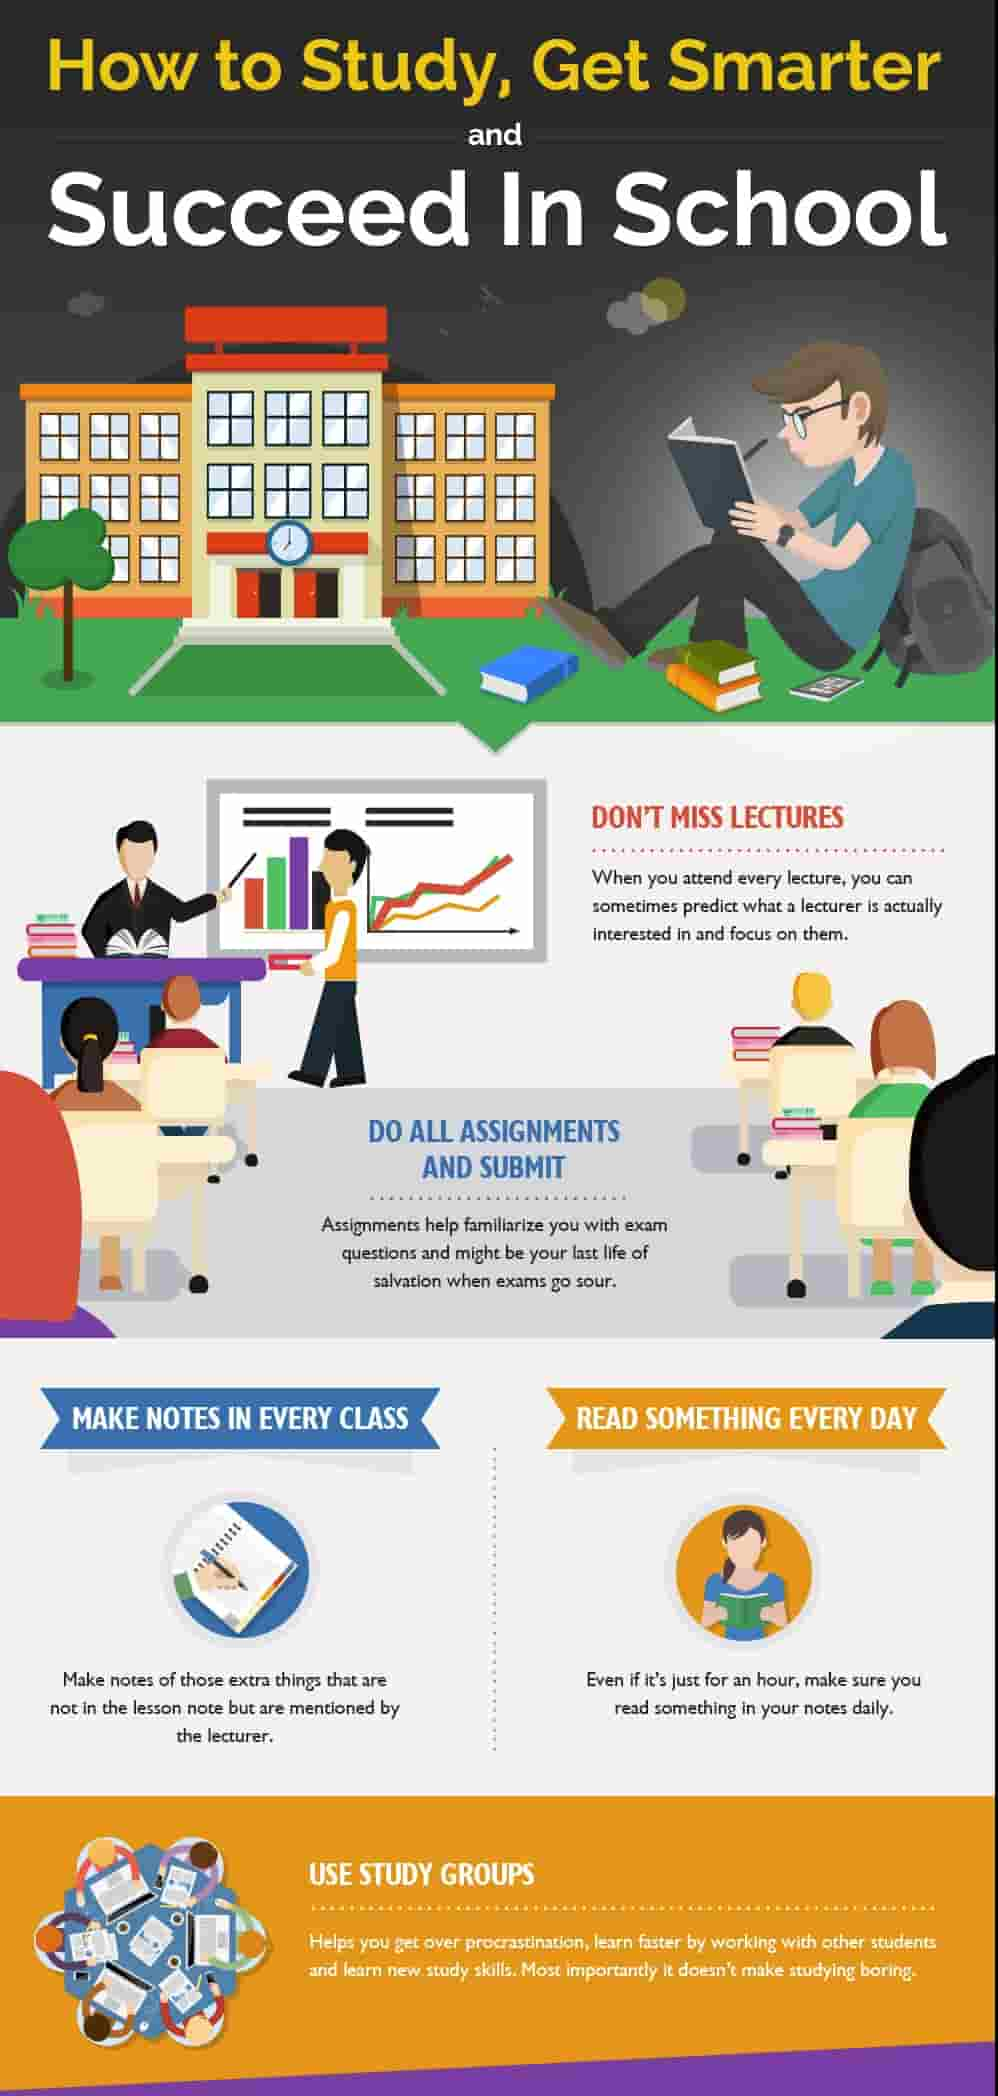
While learning different subjects is important, knowing how to learn and succeed is just as vital. This infographic example has an excellent pairing of visual aids with text, making it perfect for creating tips, lessons, and tutorials.
The use of engaging illustrations, excellent typography, and varying backgrounds ensures that students never get bored and scroll through the whole infographic.
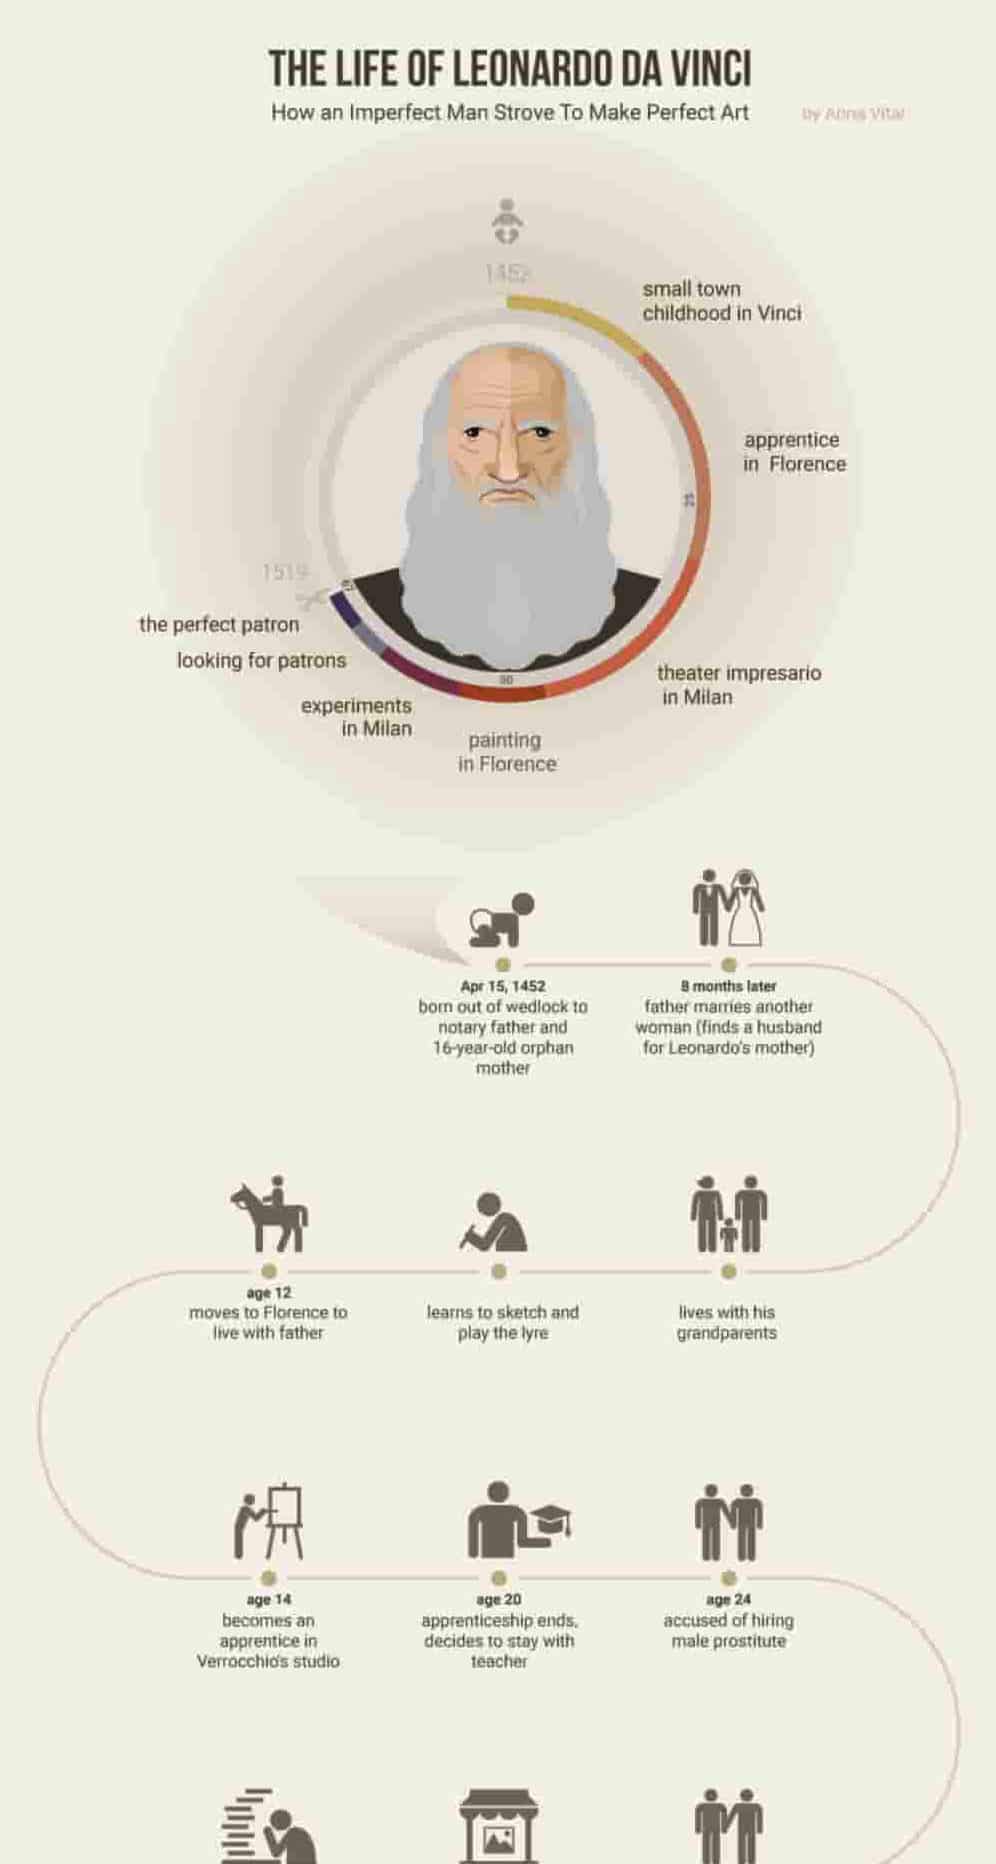
5. The life of Leonardo Da Vinci infographic
10 infographic examples and templates for students that are easy to edit and customize
Did the above examples help get your creative juices flowing?
The good news is you don’t need to start creating infographics for education from scratch.
Piktochart has hundreds of pre-made infographic templates you can use to create infographics for students within minutes. On top of that, you don’t need to download or install anything on your computer. Piktochart works right in your web browser.
Watch the short video tutorial below to learn more about making infographics in Piktochart’s free infographic maker.
On that note, here’s a sampling of some of our best infographic examples you can use in the classroom, and how they can be used for educational purposes.
1. Infographic example showing pros and cons
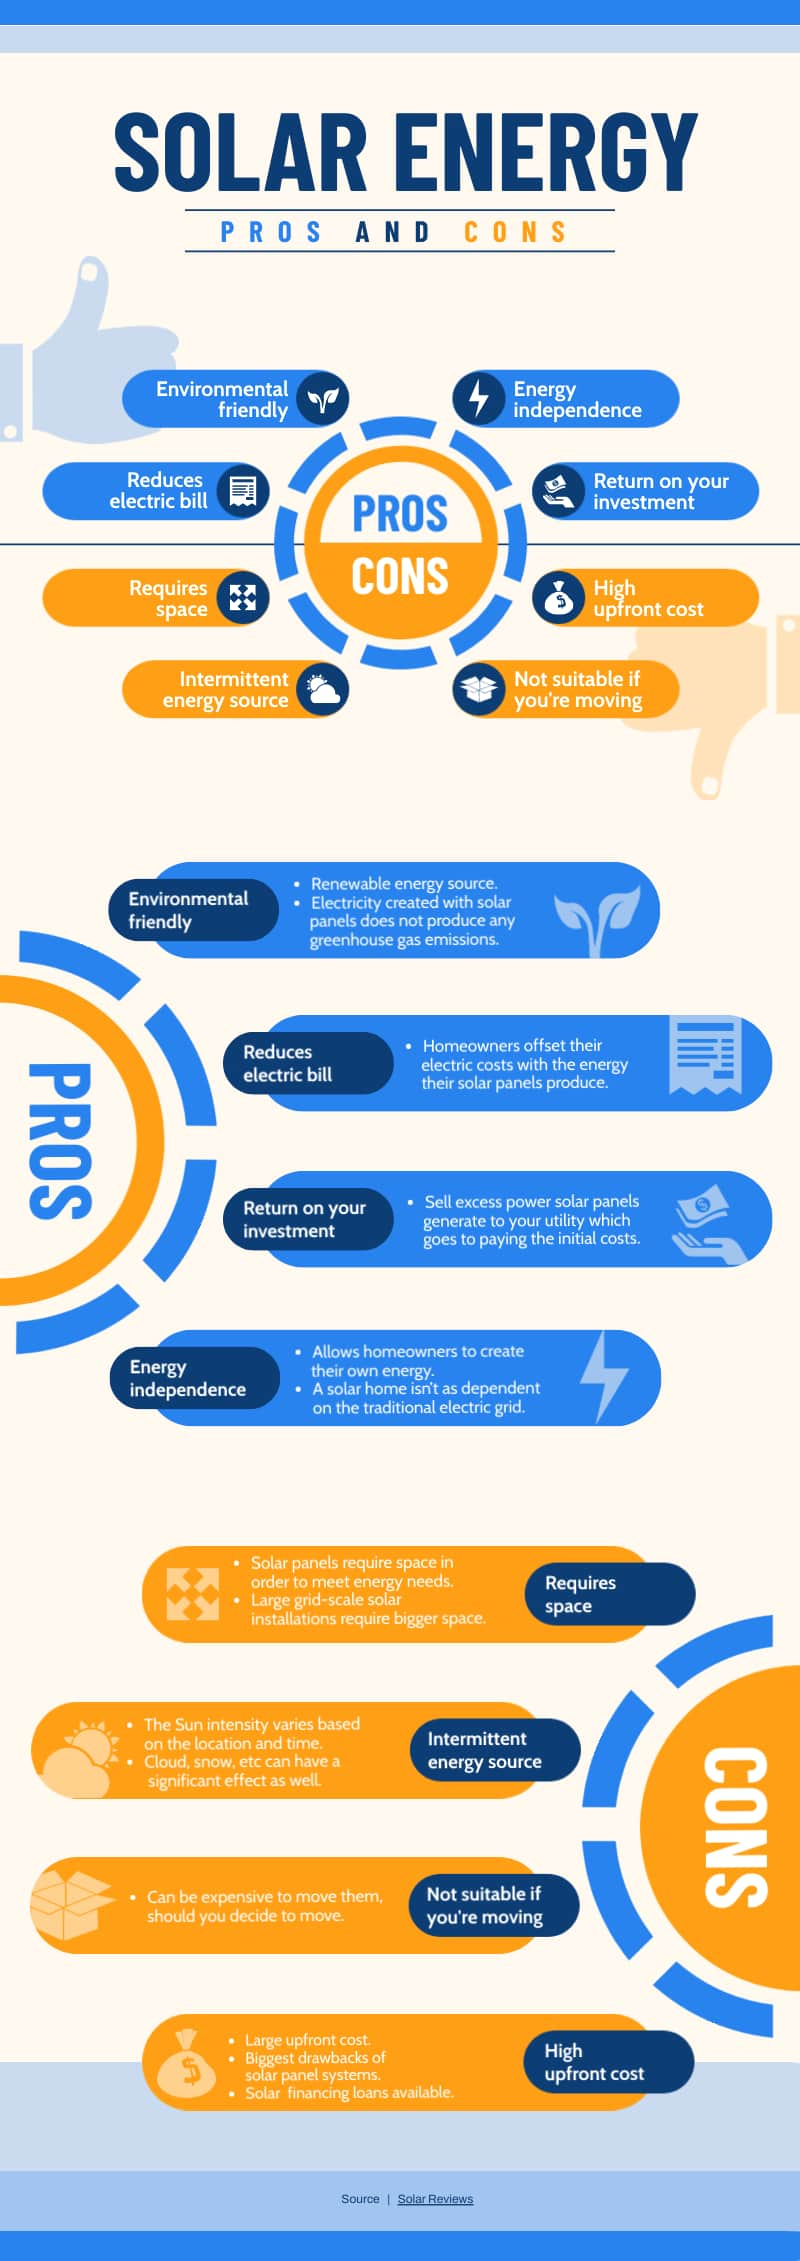
This comparison infographic template is great for teaching students how to compare two concepts, objects, or ideas.
Since you can easily add contrasting information side by side, it is excellent for emphasizing differences and similarities. Not just that, you can later go into details with separate sections for pros and cons.
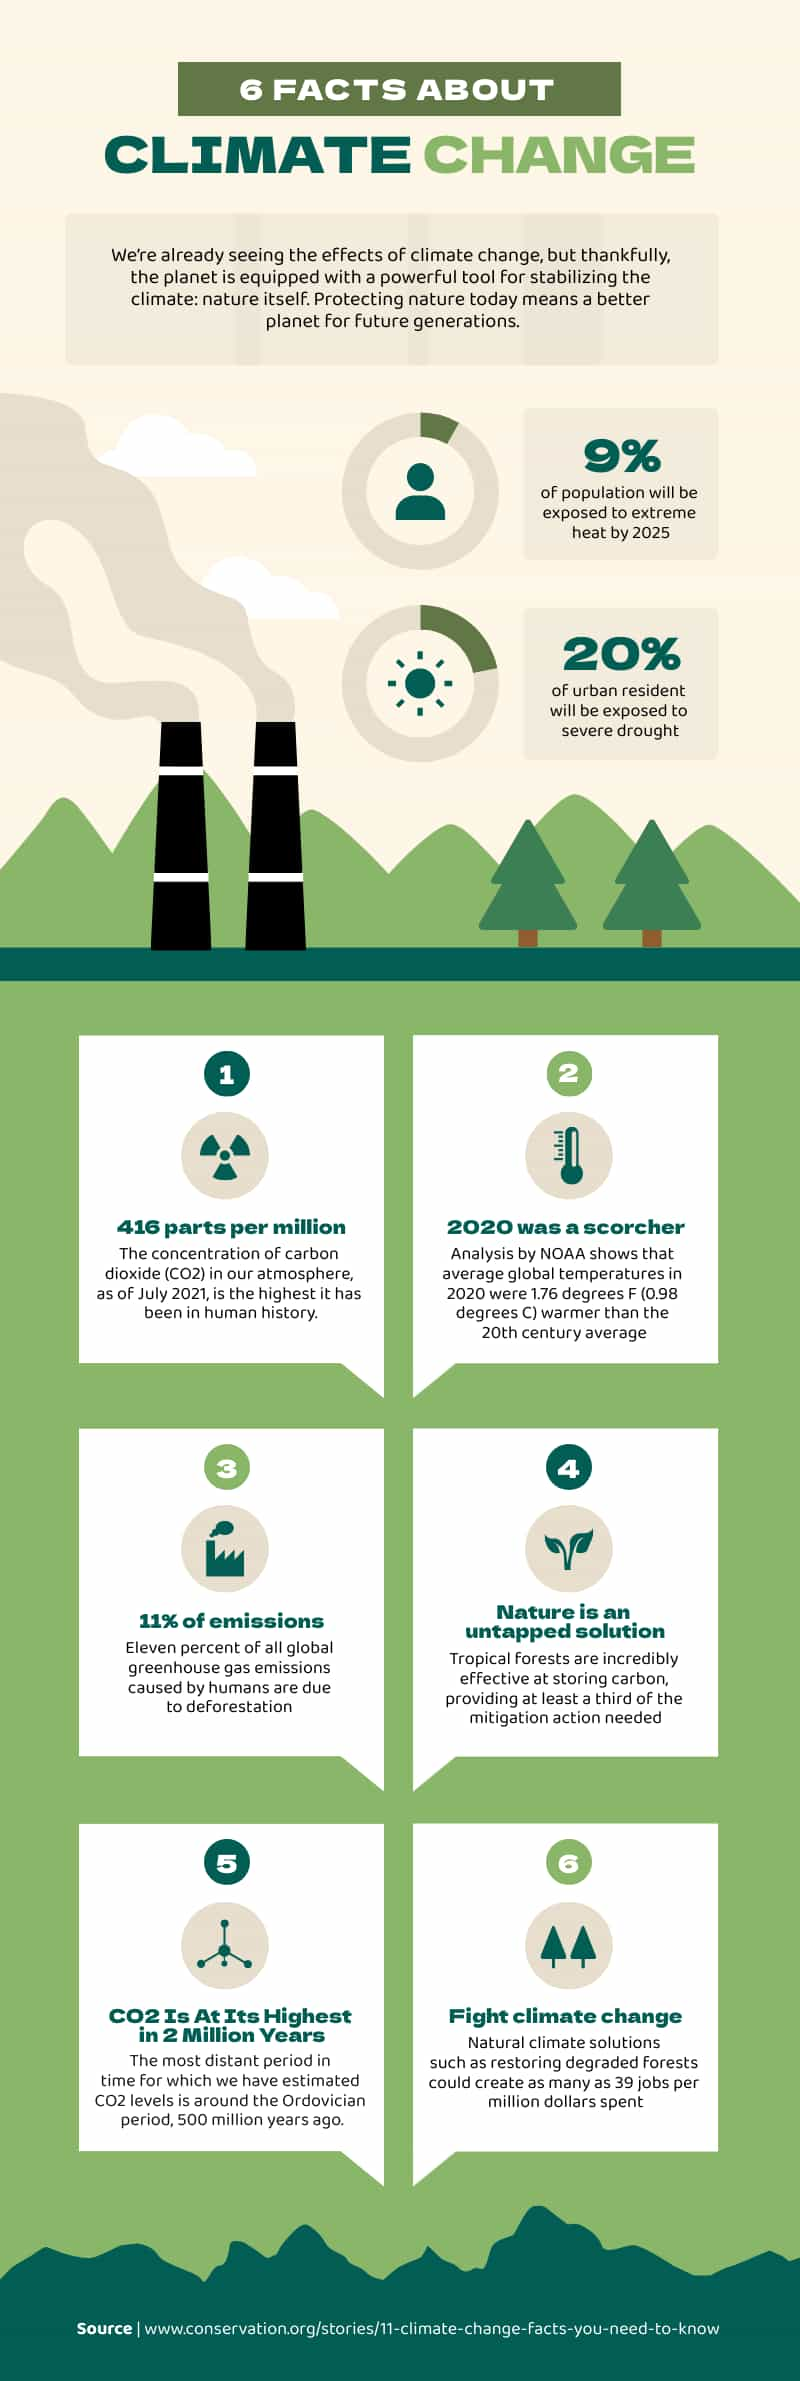
2. Infographic example visualizing statistics and research findings

Understanding academic research and statistics are one of the crucial skills for students in the 21st century. And it’s a great way to help them quantify the magnitude of abstract ideas. That’s where this infographic template shines.
It says a lot about the link between social media and children’s self-esteem without relying too much on text alone, making statistics and figures easy to understand.
3. Infographic example to help students understand complex information
Informational infographics help students grasp complex topics and technical content with ease. This infographic template is ideal for simplifying complex ideas with visuals like icons and illustrations.
4. Infographic example to help explain timelines
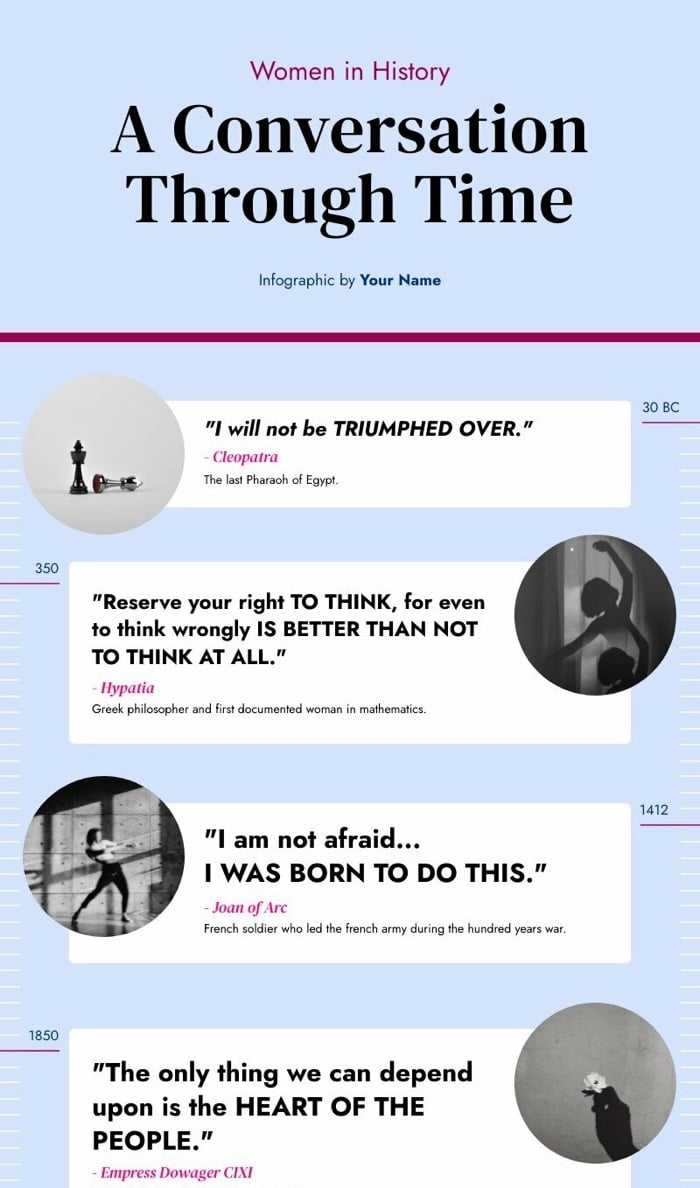
Timeline infographics are great for going over key events in the history of a person, place, or subject.
This template can help students connect events to each other and understand how they shaped the present era. It keeps each event neatly organized and separated from others through rectangle shapes, and also gives you space to add any text, data, or icons.
You can also use a timeline maker, a one-stop shop for inspiration, designing, and sharing in multiple formats!
5. Infographic example inviting students to attend an event or enroll in a course

Looking to generate interest in a course, event, or program? Then this infographic template can get the job done.
With this template, you can make students aware of important events, along with the benefits of attending the program. Plus, it ends with a call to action to further encourage students to enroll in advance.
6. Infographic example about virtual learning
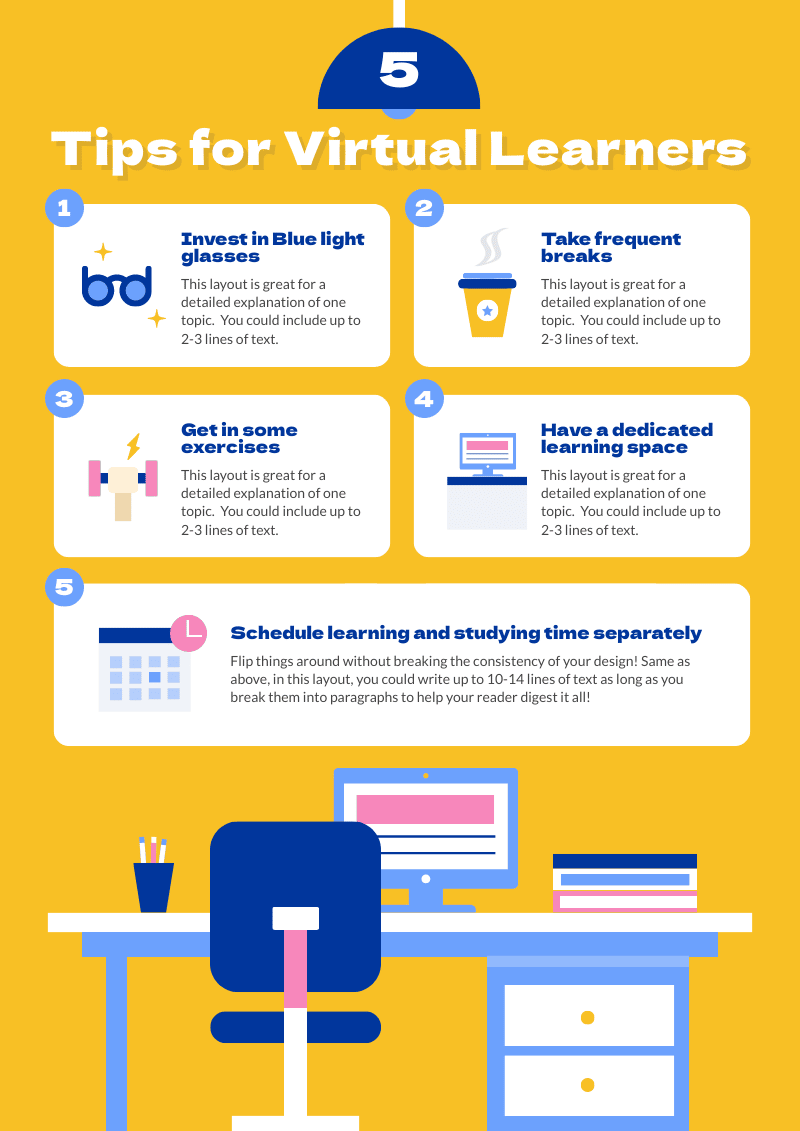
This simple infographic example for virtual learners is packed with tips to make virtual learning fun and comfortable for students and teachers alike. You can edit this infographic with more tips by adding more text boxes.
7. Infographic example explaining the steps of a process

Process infographics work well in the classroom if you want to go into detail about a process or workflow. Use this infographic example to choose a research paper topic idea as your guide. You can customize the texts, color schemes, and illustrations using Piktochart’s powerful yet easy-to-use visual editor.
8. Infographic example about classroom quiz games
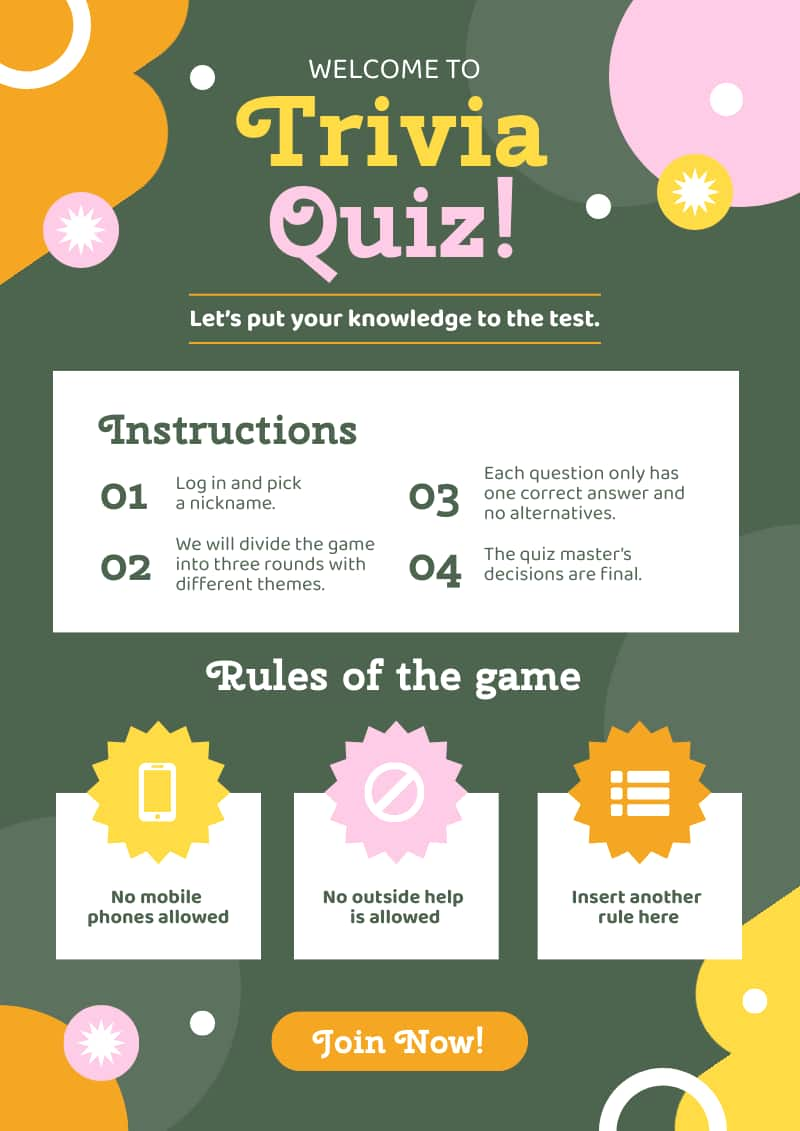
Get your students excited about learning by introducing games and quizzes to your class!
The infographic example below also doubles as a classroom poster that you can use to explain how your quiz or game works.
9. Infographic example about class schedules
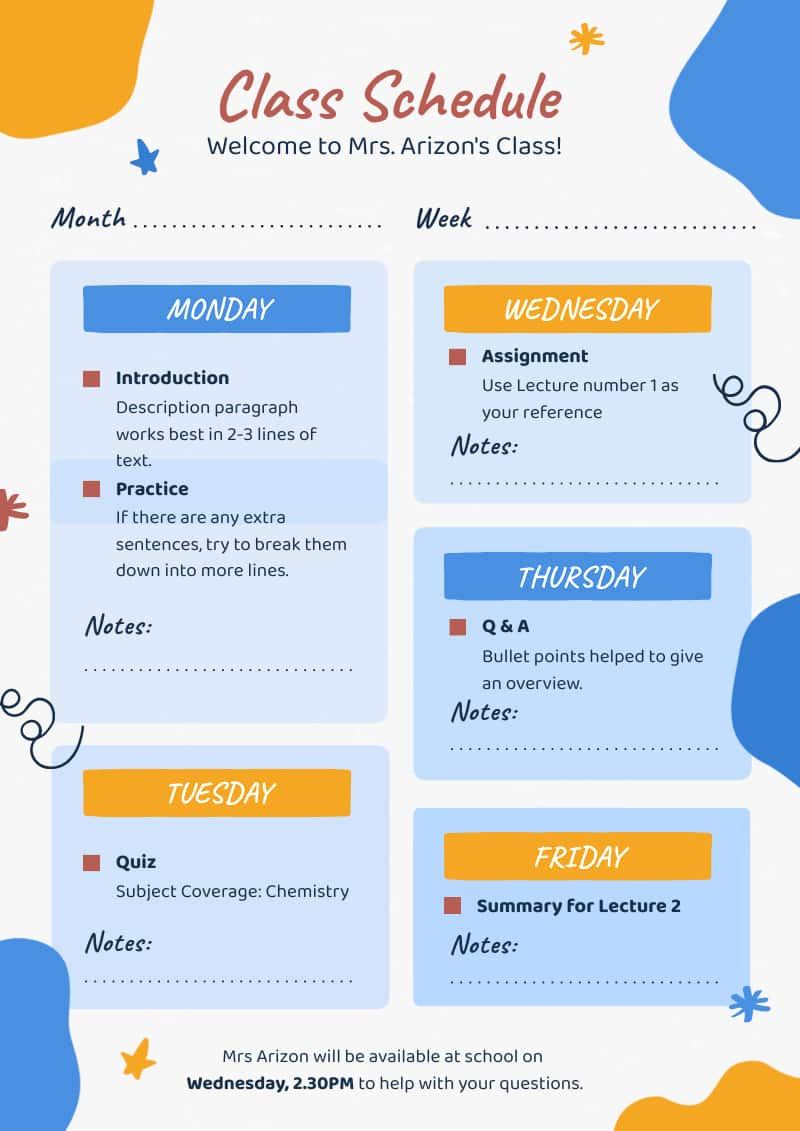
This fully customizable class schedule infographic template makes classroom schedule documents more fun and engaging for students. Whether you’re scheduling a week or the entire semester, this versatile infographic template has everything you need.
Bonus tip: You can also use infographics for your school syllabus.
Give our class schedule maker a try to access more templates for free! Sign up to access presentations, posters, and more.
10. Infographic example explaining the stages of a lesson
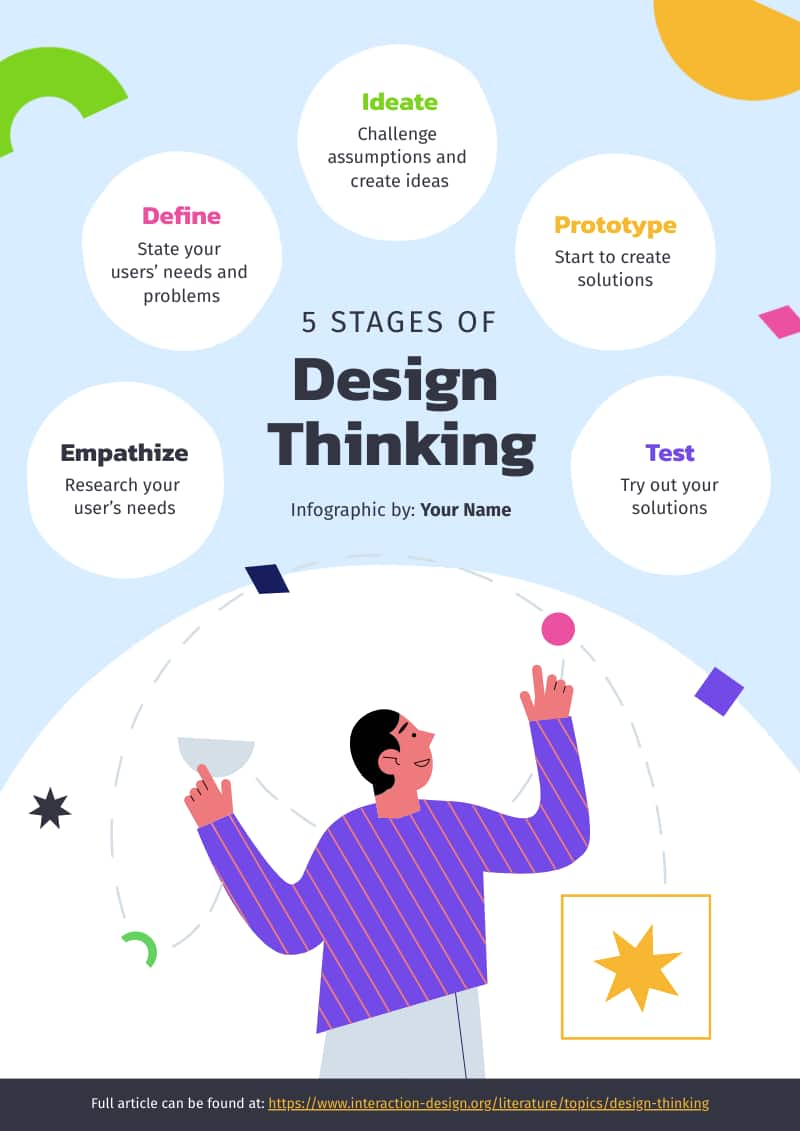
Introduce the stages of a lesson using this simple infographic about the stages of design thinking. The infographic’s layout makes it easy to follow for its audience.
Want to add more stages? All you need to do is duplicate the circles and add your text or content.
How to make an infographic in 4 steps
Creating an infographic doesn’t require design experience. Here’s how to get started:
1. Choose your topic and data. Pick a subject relevant to your assignment or presentation. Gather statistics, facts, or key points you want to communicate.
2. Select a template. Browse Piktochart’s library of pre-designed templates for timelines, comparisons, or statistical infographics. Pick one matching your content type.
3. Customize your design. Add your text, swap colors to match your theme, and insert icons or charts. Piktochart’s AI tools can generate visuals from your data in seconds.
4. Download and share. Export as PNG for digital use or PDF for printing. Share directly to Google Classroom or social media.
Wrapping up: Make infographics for students in minutes with Piktochart
As you can see, infographics are one of the best ways to encourage and enhance learning among students.
Whether you create them for teaching or have your students make them for a project, they always bring more excitement and energy to the classroom.
Recommended reading: A Student’s Guide to Getting Started With Piktochart
No matter the budget or design skill level, Piktochart’s infographic maker can help you design compelling infographics fast.
The templates we covered above don’t just help you create infographics quickly and easily, but can also be used to repurpose other projects to save time in the future.
Give Piktochart a go, and see the difference it can make in your classroom.
Editor’s Note: This blog post is a collaboration between guest post author Hitesh Sahni and Piktochart’s content team.