Your syllabus is often the first thing students read about your course. It sets the tone before you’ve said a word. Yet most syllabi — dense paragraphs, small print, page after page — get skimmed at best and ignored at worst.
Research from the University of North Carolina at Asheville confirms what many instructors already suspect: students who received a visual syllabus read it more completely, reported less anxiety about the course, and found it easier to reference throughout the semester. This guide shows you how to design one, with templates and tips from educators who’ve done it with Piktochart.
Create a free Piktochart account so you can easily follow along and get access to the high-quality version of the templates we’re featuring below.
Table of contents
- What is the purpose of an infographic syllabus?
- Do students prefer an infographic syllabus?
- Designing a visual syllabus with teacher Heather Anderson (tips)
- Out with the old, in with the new by teacher Katherine Maloney(tips)
- Andrea Zapor’s 5 tips on making an infographic syllabus
- Visual classroom syllabus examples and templates you can edit and customize
What is the purpose of an infographic syllabus?
- It’s a document that clarifies rules, sets expectations, lays out the responsibilities for students and instructors, and summarizes the plan for late coursework, attendance, grading, and other procedures.
- It’s also a permanent record in writing – it describes the course’s name, discipline, instructor, number of credits given, the level, and what’s covered in a semester.
- Finally, it’s a tool that gives students all the information they need to take part, have a keen understanding of the material, and ultimately encourage them to become successful academic learners and succeed in the classroom.
What to include in an infographic syllabus
Before opening any template, get clear on your content. A well-built syllabus covers the same core territory regardless of format — visual or text-based.
Here’s what students need to find in yours:
Course basics: Course name, code, credit hours, meeting times, location, and delivery mode (in-person, online, or hybrid).
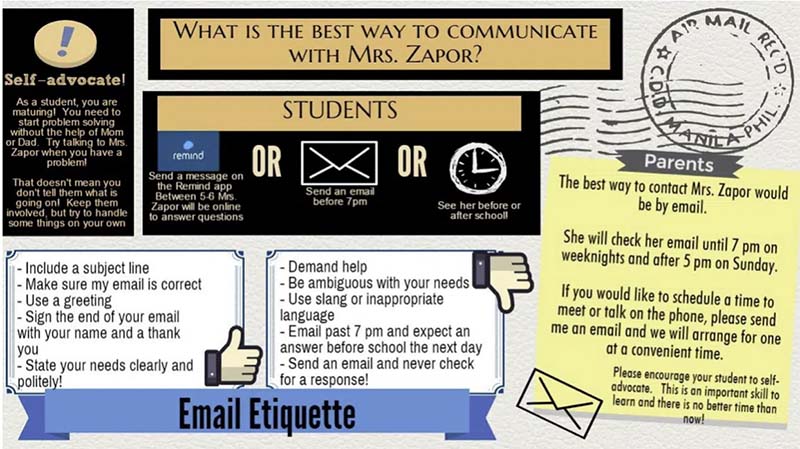
Your contact details: Email address, office hours, and your preferred response time. Students read this more than you’d expect.
Course description and prerequisites: A plain-language summary of what the course covers and what students should already know coming in.
Learning objectives: What students will be able to do by the end. Keep these specific — “analyze primary sources” lands better than “understand history.”
Required materials: Texts, tools, software, or subscriptions students need to purchase or access before day one.
Grading breakdown: Each assignment category, its weight toward the final grade, and the grading scale.
Course schedule: A week-by-week or unit-by-unit outline of topics, readings, and key due dates.
Policies: Late work, attendance, academic integrity, and make-up procedures.
The infographic format works best when this content is already decided. Design comes after clarity.
Do students prefer an infographic syllabus?
The results of a mixed-methods study on student impressions of infographic syllabus by Angel W. Kaur of the University of North Carolina at Asheville concluded with the following findings:
“Across class standing, students strongly preferred an infographic syllabus and described it as easy to use, memorable, organized, and engaging.
Students reported reading the infographic syllabus more completely, feeling less anxious about the course and more comfortable with its requirements due to the syllabus style. Recommendations for creating an engaging infographic-style visual syllabus are shared.”
We’ve enjoyed talking with three wonderful teachers–—Heather Anderson, Andrea Zapor, and Katherine Maloney. They use Piktochart for Education to create beautiful infographic syllabuses that impact and engage their students.
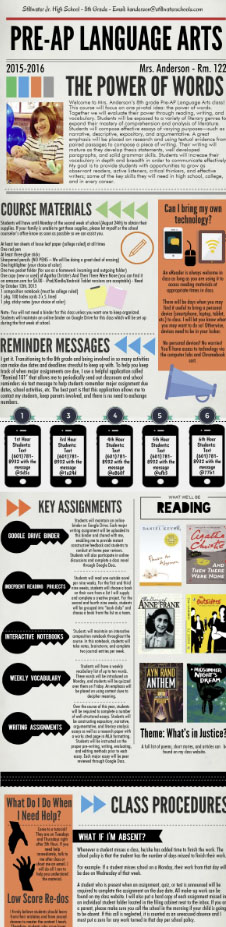
Designing a visual syllabus with teacher Heather Anderson
Heather Anderson, an 8th-grade English veteran teacher from Oklahoma, uses technology in the classroom on a daily basis. Besides creating infographics, she built a fantastic academic website so her students could access her course content online.
We asked Heather for her top tips on creating an engaging visual syllabus for faculty and students alike. Here’s her advice:
Tip #1: Break up your syllabus into digestible bites
In the past, my school students have always received my four-page-long Word document syllabus with wide eyes.
Words, words, words, as far as the eye could see. What did they end up doing with it? Inevitably, it ended up unread.

With Piktochart, you can create a visual representation of course and classroom information your students will actually want to read.
Start by breaking up your syllabus into digestible bites. Think about what the students absolutely have to know about your class.
Think about the language used and resources provided, as well as what reference images would help students better understand the key elements of your classroom and set them up for success.
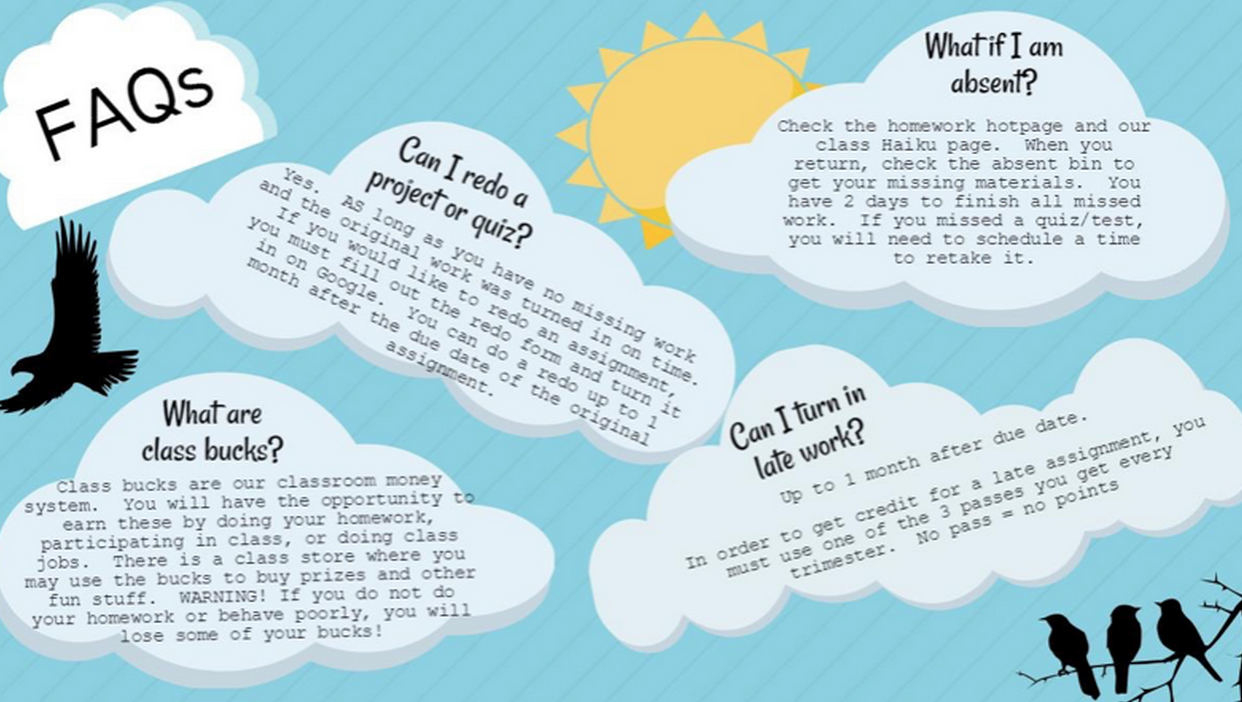
Tip #2: Focus on the questions students will ask
On the first day of school, students are full of questions. What do I do if I have to go to the bathroom? Is a pen okay? Are cell phones allowed?
Try to anticipate these questions with answers in your visual syllabus document. Students can revisit your syllabus if they forget a procedure in weeks to come.
Tip #3: Use a unified color scheme/theme. Keep it classy (pun intended)
Your wording should be easy to see and visually pleasing. Stick to a few colors that complement each other, and use similar shapes throughout your visual syllabus.
Tip #4: It should be easy to follow
Your visual syllabus should be like your classroom rules & procedures: easy to follow and easy to understand. For example, combine information about assessment and grading.
Tip #5: Utilize QR codes
If you have a website, create a QR code and paste it into your infographic syllabus to include links and additional communication resources rather than making the format too text-heavy.
I utilize QR codes frequently in my class, so including one in my visual syllabus helps students access them independently without taking up class time.
Tip #6: Keep your words short and to the point
As teachers, it’s easy to be long-winded about how amazing your class is or to go in-depth about your class procedures and grading policy.
Try to keep the wording short and to the point. The ultimate goal of your syllabus is to provide parents and students with a snapshot of how your classroom runs.
Out with the old, in with the new by teacher Katherine Maloney
Katherine Maloney has taught International Baccalaureate English and Theory of Knowledge for the past 15 years.
She describes herself as a ‘mother, international educator, doctoral candidate, thinker, reader, blogger, art lover, traveler’ – and she blogs at Katscan, her personal blog on teaching, classroom tactics, and using technology to enhance learning.
At Piktochart, we’re always interested in enhancing learning through technology, so we asked her why she chose to use an infographic syllabus.
Katherine said there was no doubt about it:
”My syllabus was in dire need of a makeover. That’s why I was so excited when my colleague Mat Fron said that he was going to try to create an infographic syllabus for the IB Language and Literature course we teach together, sharing the following example with me.
Inspired – and not to be outdone – I quickly decided to try to make one, too. I created a free Piktochart account for myself and began to take a look around. I knew I wanted a school syllabus that would:
- Help generate excitement about the course with a statement
- Inform students of what they can expect (like assignments and grades)
- Be easy to modify and update the format with materials and resources
- Not take me a lot of time and effort to outline and finalize
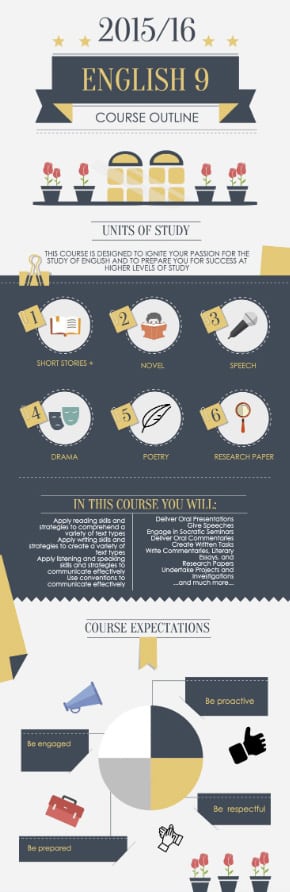
I ended up going with the “2015 Resolution” template because it fit perfectly with the number of units that we had planned, and also because the imagery of the window and the flowers seemed apropos to the learning journey we had in mind for our Grade 9 English students this year.
Using the fully editable design template format, I was able to quickly and easily plug in:
- The title of the course
- A brief course description statement and learning objectives
- The titles of our various units with images to match
- Our intended learning outcomes
- The activities we had planned for the year
- Our expectations of learners and student objectives
- Teacher contact details
Now that I know how it all works, I can’t wait to start exploring Piktochart’s more advanced features and especially to use it with my grade school students.
21st-century literacy includes the ability to interpret and communicate using both words and images, and I can’t imagine a better way to introduce young learners to this skill than through the creation of their own beautiful infographics in response to the various texts, themes, and ideas that they will encounter in English 9 this year.
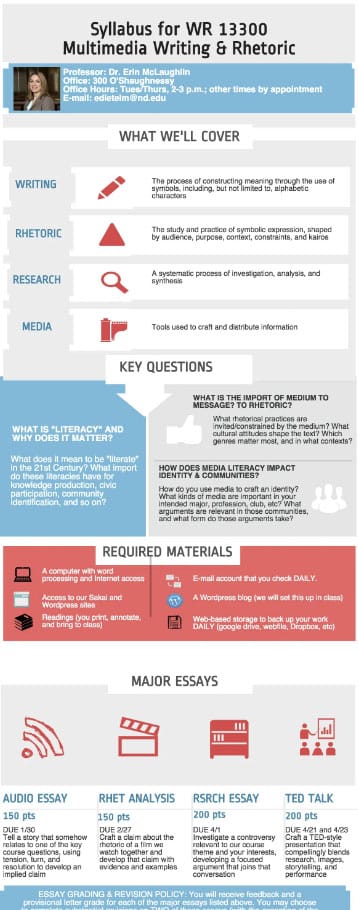
Andrea Zapor’s 5 tips on making an infographic syllabus
After making her first French 1 infographic using someone else’s as a guide, Andrea Zapor (an English and French teacher “with a love for technology and learning”) decided she had to design an infographic of her own.
“I set out to use Piktochart because it’s super easy to use and makes it look awesome!
With mouse in hand and inspired by others, I was ready to start creating my own infograph. Or was I?
Looking at the blank canvas in front of me, I could see that the possibilities were endless, but the space was limited. So here are my top 5 tricks to creating a kick-butt infographic syllabus!”
Tip #1: Browse templates, illustrations, and graphics in advance
Piktochart has so many different options for templates, illustration shapes, banners, and so on that, it’s a good idea to browse the options to get an idea of what suits you!
Tip #2: Stick with an idea
Piktochart separates a template into several boxes. Decide whether you want a theme or background for each box or if you want a common theme/background for the entire visual syllabus.
I chose to do a different theme/background for each box as I enjoy mixing it up a little.
Tip #3: Set aside some time to outline & make a masterpiece
I’m pretty sure Picasso didn’t paint the Mona Lisa in an hour, so don’t expect to have a perfect visual syllabus in an hour, either.
You can make a simple syllabus with some graphics in about an hour using Piktochart, but if you want to add links, course resources, graphics, unique fonts, and other cool stuff, you should set aside at least 2 hours.
Tip #4: Know your audience
Think about this question: who are you truly trying to reach with your infographic?
Personally, I am doing this for my grade school students. With this in mind, I designed my visual infographic to be mostly grade-school student-friendly. Instead of just making text boxes and charts with pretty backdrops, I included clipart and shorter chunks of sample text.
I also made sure to put the terminology in grade-level student-friendly terms. Of course, there are still parts that are directed toward parents, but for the most part, I designed my syllabus for my course students.
Tip #5: Prepare and simplify
My best advice is to review your old syllabus and pick the top five sections of importance.
Don’t try to put too much into the infographic. Replace words with graphics when possible, or use graphics to accompany your writing to clarify meaning.
The top 5 sections I chose were: necessary materials, grading, policies (late work, absences, redos, class money system), my contact details, and an overview of the course.
From those categories, I picked 3–4 key points and made sure to include them.
Ask yourself: what do I want the parents and students to get out of my syllabus? What do I want them to remember?
The point of using an infographic is not just to make it look cool (which it definitely does) but also to simplify your class and expectations into small, understandable chunks.
If you need to go further into detail on something (like assignments and grades), talk about it with the students in class, and if you must, make a brief handout or use Google slides to elaborate.
I look forward to using Piktochart throughout the year. I hope this will stick with students and parents, and I will have to explain my course procedures less. Fingers crossed!
Visual syllabi examples & templates you can customize
If you want to turn your syllabus into an infographic, you don’t need to make one from scratch with the following creative and fully editable visual syllabus templates from Piktochart’s infographic maker.
If you’re new to infographic syllabus creation, watch the short video tutorial below to help you get started.
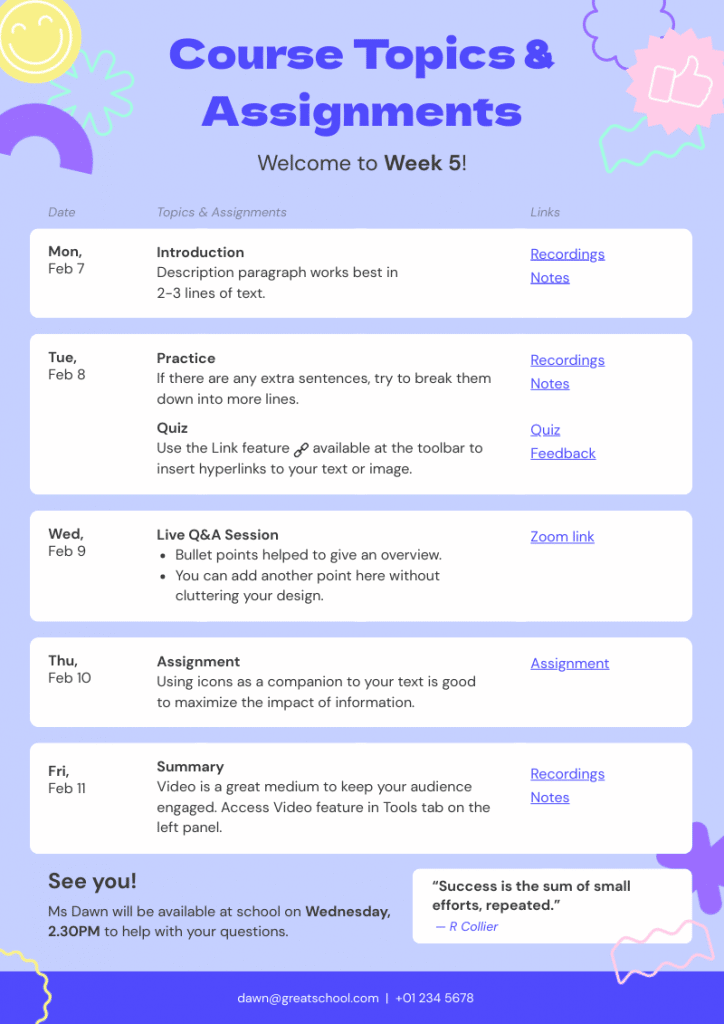
1. Creative course infographic syllabus template
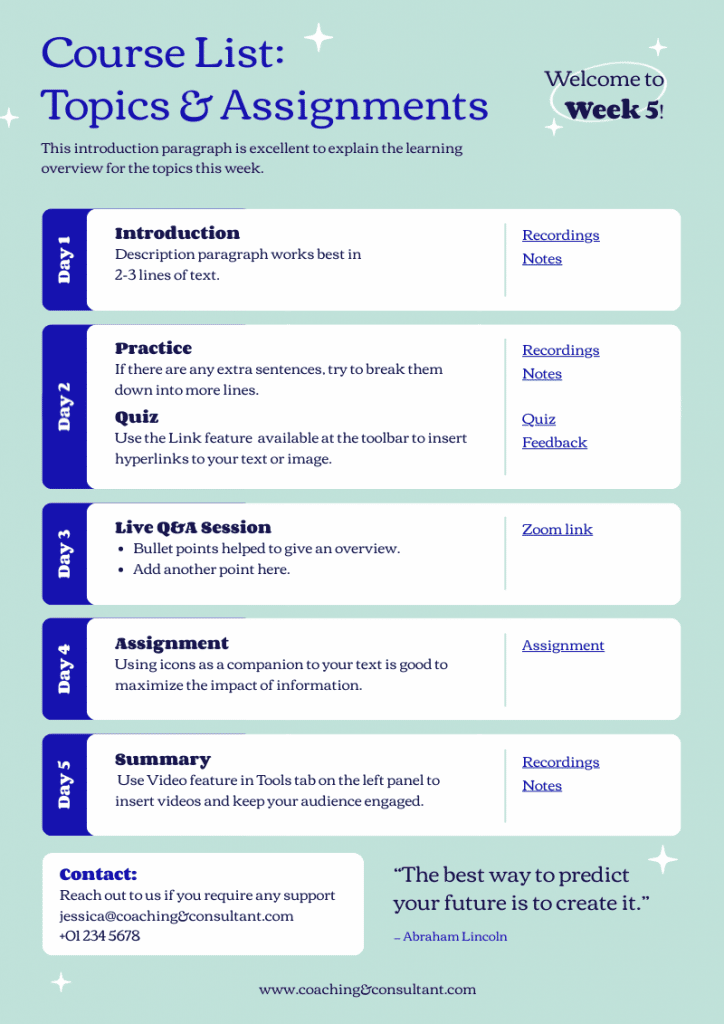
2. Free simple infographic syllabus template
Course syllabus template (Google Slides presentation)
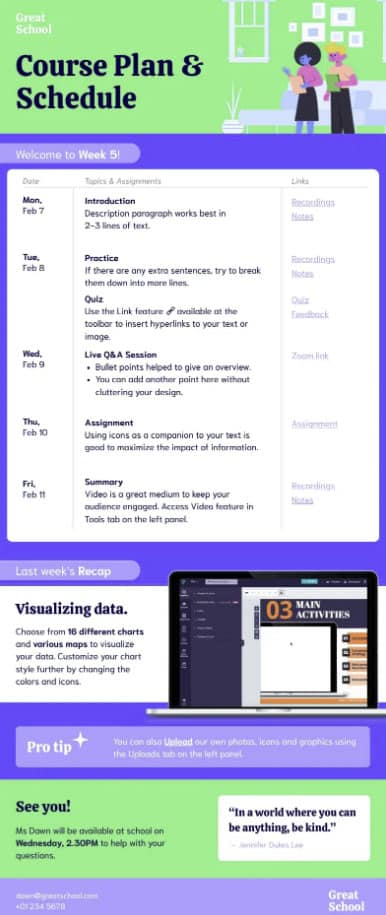
4. Modern syllabus with schedule template
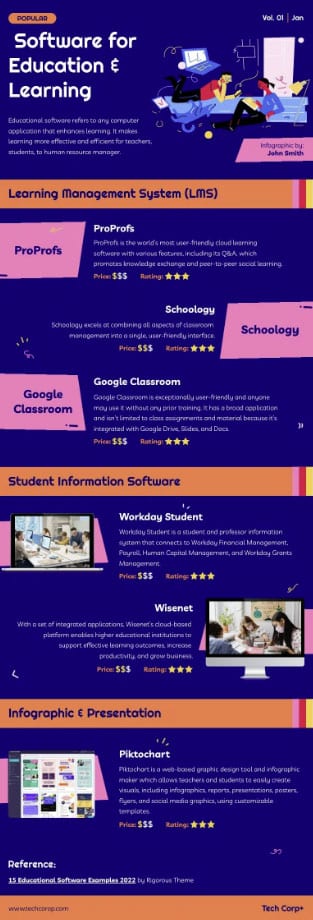
5. Free educational software list template
If you are a teacher who has created an infographic syllabus for your class, please share it with us on Twitter. We’d love to feature them in this guide too!
Check out these resources to help improve your visual creation skills in the classroom:
The future of learning is interactivity and collaboration.
Foster interactive and collaborative learning using Piktochart for Education. Share your work, get feedback, and brainstorm on the fly.
Get Piktochart for Education