Visual psychology explains how people notice, sort, and make sense of what they see. For marketers, educators, designers, and presenters, this matters fast: the brain does not read a visual in a neutral way. It groups shapes, reacts to color, follows hierarchy, and fills in missing context before conscious analysis begins.
This guide breaks visual psychology into five studies you can use in real design work. You will learn how visual perception shapes attention, memory, typography, scene recognition, and color relationships. You will see where design choices help viewers process a message with less effort, plus where poor choices create friction.
If you want a wider view of emotion and color in visual communication, read our guide to color psychology. For more science on why visuals work so well, see why people love great visuals.
What is visual perception?
Visual perception is the process the brain uses to organize raw visual input into meaning. Your eyes collect light, shape, contrast, color, and motion. Your brain turns those signals into objects, depth, patterns, and relationships you can act on. In visual psychology, perception is not passive viewing. It is active interpretation.
This matters in design work. People do not approach a chart, poster, slide, or landing page as blank slates. They group nearby elements, follow contrast, notice unusual shapes, and rely on past experience to decode what appears on the screen. Good visual communication works with those habits. Weak visual communication fights them.
Visual perception includes several moving parts. One part is biological: the retina receives visual input, the optic nerve carries signals forward, and the visual cortex in the occipital lobe helps process what arrives. Another part is cognitive: the brain uses memory, context, and expectation to interpret incomplete or complex scenes. This is one reason visual illusions matter so much in psychology. They reveal the gap between what enters the eye and what the brain concludes.
For designers, the practical takeaway is clear. Layout, hierarchy, color, spacing, and image choice change meaning before a viewer reads a single sentence. A crowded visual asks the brain to work harder. A clear structure lowers effort and speeds comprehension. If you already use color intentionally, our guide to color psychology pairs well with this section. If you want to turn perception principles into applied visuals, Piktochart?s infographic maker gives you a fast place to test them.
Why is visual perception important?
How our brain processes visual information helps us from learning as children to how we see the world and interact with our environments throughout our lives.
Because of the ease with which we rely on these perceptual processes, we tend to overlook the complexity behind visual information processing.
Visual perception refers to the way our brain processes visual information.
This is different from visual acuity, which is our eyes’ ability to distinguish objects at a given distance.
The examples of visual processing and application of visual perceptual skills in everyday life are endless, from taking in information through reading text, our computer screens, sporting games, facial cues, and social interactions.
And of course, as we humans are all different when it comes to our brain function, vision, and auditory processing or hearing, we must consider that information processing lives on a spectrum.
For example, good visual information processing means being able to quickly and accurately process and analyze what is being seen and store it in visual memory for later recall. Some examples of visual perception skills we use during learning include:
- Visual memory: It lets us recall what we learned. An example is if we try to match an image to one that we just saw.
- Visual form constancy: Allows us to understand if a shape or object stays the same after its position has changed.
- Visual figure ground: The ability to filter out irrelevant details in an image so we can focus on one object.
- Visual spatial orientation: Knowing your position in space relative to other objectives. Important for handwriting, standing in line without knocking into other people, and sports.
- Visual closure: Being able to recognize an item or object when it is partially hidden.
On the other hand, people with visual perception problems may be diagnosed with reading and learning disabilities, dyslexia, and ADD/ADHD, such is the severity of these issues in impacting our daily lives.
Regardless of where someone lies on the spectrum of visual processing, all humans rely on their visual cortex to decipher what they see.
Visual Processing Through The Visual System: Sense Organs and the Visual Cortex
The visual system is the piece of the central nervous system required for visual perception to create some meaning from the visual environment. Humans are equipped with sense organs (e.g., eye, ear, nose) for processing environmental stimuli.
Each sense organ works as one component of our larger sensory system or visual system to receive sensory information and send this sensory information to the brain, or more specifically, the visual cortex. The visual pathway starts with receiving information through the retina and ends in the occipital lobe.
You might also find our article on visual communication storytelling courses useful.
As part of the visual system, the visual cortex is the primary cortical area of the brain that receives, incorporates, and performs visual information processing from the eye’s retinas.
To get technical, the primary visual cortex is in the occipital lobe of the primary cerebral cortex, which is in the most posterior region of the brain.
This means visual processing of visual stimulus detected from your eyes travels through the lateral geniculate nucleus in the thalamus and then reaches the visual cortex.
The human visual system for visual processing sounds complex, yet it happens instantly!
Understanding how we interpret what we see can help us design and organize visual information.
Let’s take a look at five psychological studies that reveal some remarkable insights into visual perceptions and how visual information processing occurs in different ways.
Table of contents
- 1. Gregory’s Visual Assumption Theory
- 2. Color relations experiment by Thomas Sanocki and Noah Sulman
- 3. Binocular rivalry phenomenon
- 4. Influence of typography and aesthetics on reading
- 5. Recognizing the gist of a scene
- How do these findings affect your design?
- Create your own stunning visuals with these Piktochart templates
Want to jump right into creating visuals that pop? Try Piktochart for free and get access to our constantly updated library of beautiful templates.
1. Visual Perception Theory by Richard Gregory
Psychologist Richard Gregory believed that visual perceptions rely on top-down processing.
Top-down processing, also known as conceptual-driven processing, happens when visual information processing involves taking in the whole picture to try to make sense of what we see.
We make our best guesses of what we see with the human eye based on existing perception. Our perceptions of the world are hypotheses based on our expectations, past experiences, beliefs, processed learning, previously gathered data, etc.
In other words, we make a calculated visual analysis and assumptions from our combined working memory.
According to Gregory, we are typically correct in those initial visual analysis assumptions.
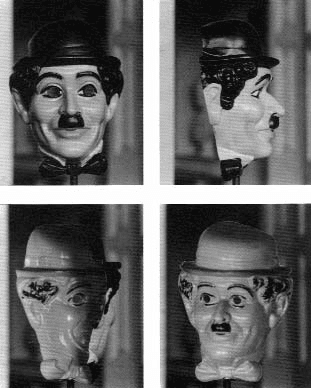
The hollow mask experiment:
One of the trials Gregory ran in order to test his theory of visual information processing was called the hollow mask experiment, testing the top-down perception and face recognition ability of his subjects.
He used the rotation of a Charlie Chaplin mask to explain how we perceive the visual input of the hollow surface of the mask as protruding, based on our individually formed expectations and experiences of the world.
Our prior, processed knowledge of a normal face is that the nose shape protrudes. So, we subconsciously reconstruct the hollow face into a normal face shape.
Looking for more? Check out why people love great visuals science.
Based on Gregory’s visual assumption theory, we can say that:
- Nearly 90% of what we see (the visual data) is lost by the time it reaches our brains. Because of this, the brain has to make its best guess based on our past experience and previously processed knowledge.
- The visual information we see is combined with previously stored information about the world, which we have built up as a result of our unique learning experiences and personal development.
- Our location or surroundings help to shape and provide context to the visual information processing that occurs.
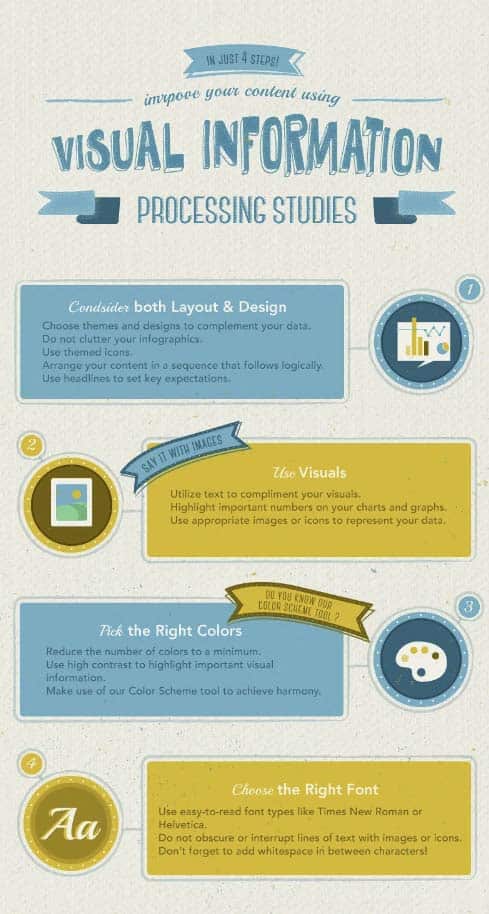
Visual design tips based on Gregory’s theory:
- Pair your data with relevant themes and visuals.
- Use meaningful headlines to set key expectations.
- Support visuals with relevant text.

2. Color Relations Experiment by Thomas Sanocki and Noah Sulman
Visual analysis studies have shown that a group of similar colors will be perceived as harmonious and pleasant, while the visual processing of contrasting colors is associated with chaos or different degrees of boldness.
In 2011, Thomas Sanocki and Noah Sulman conducted an experiment on color relations in order to gauge the impact of color, and visual discrimination, on visual short-term memory (VSTM).
Space and color directly affect our short-term visual memory capacity. When we arrange images or familiar objects in vertical and horizontal formats and only use a few similar colors, we create a simpler visual to be processed.
This particular study was concerned with studying VSTM, or visual short-term memory. Four sets of trials were carried out using both harmonious and disharmonious color palettes.
In each visual analysis trial, observers were presented with two sets of color patterns and asked to compare them as visual tasks.
Participants were asked to rate whether the patterns shown were ‘same’ or ‘different.’ Observers were also expected to rate whether the pattern was harmonious in these visual tasks.
The following examples are the four types of color patterns used:

Based on the results of the study, Sanocki and Sulman concluded that:
- People remember color patterns better when the color palette is harmonious.
- People remember patterns with fewer colors (two-color palettes) better than patterns with more colors (four-color palettes).
- The contrast of surrounding colors impacted how well we remember the color pattern. In other words, color differences between the content and the background may enhance our ability to focus our attention on the content itself.
Visual design tips based on Sanocki and Sulman’s color relations experiment:
- Reduce color complexity and stick to one color scheme with presenting complex data for faster information processing.
- Use high contrast between the text, illustration icon, and background color.
- Be mindful when using color palettes of more than three.

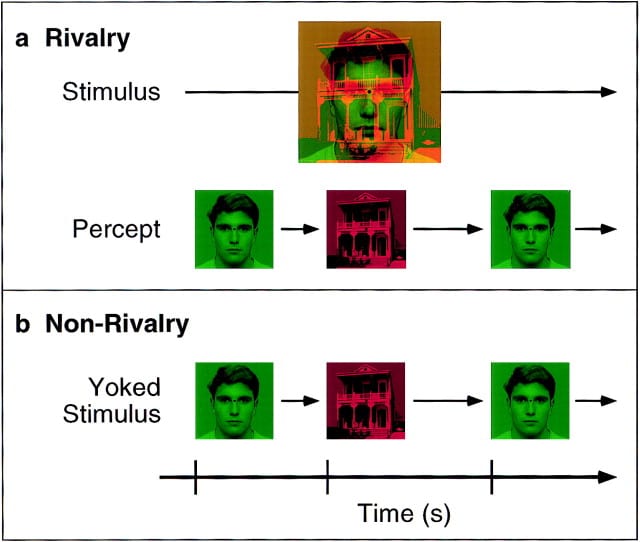
3. Binocular rivalry phenomenon
Binocular rivalry occurs when our eyes see two different images in the same location.
One image dominates our visual memory while the other is suppressed.
The dominance alternates periodically, so rather than seeing a single combination of both visuals at all times, we experience the alternation of the visual imagery over time as the two visuals compete for visual dominance.
In 1998, Frank Tong, Ken Nakayama, J. Thomas Vaughan, and Nancy Kanwisher observed this visual processing phenomenon firsthand.
In their experiment, four participants were shown, through red-green filter glasses, an image of a face and a house in an organized set.
Each eye and respective eye movements were set to see one specific image at a time. The visual-selective responses of observers were monitored using functional magnetic resonance imaging (fMRI) for eye movements.
According to their visual memory experiment:
- The fMRI for all observers indicated strong binocular rivalry when dissimilar visual imagery was presented.
- Binocular rivalry happens during the visual processing stage within our primary visual cortex. In other words, during the short period of time when our eyes rest upon two dissimilar images that are close together, we will not be able to determine what we actually see and lack object recognition function.
Visual design tips based on the binocular rivalry phenomenon
- Avoid content clutter in your visuals; this will only create more difficulty for your audience’s visual processing.
- Highlight important points by increasing font size or changing its colors.
- Stick to consistency in your design theme to maintain visual attention.
4. Influence of Typography and Aesthetics on Reading
Did you know that typography can affect your mood as well as your ability to solve problems?
In an experiment conducted by Kevin Larson of Microsoft and Rosalind Picard at MIT, it turned out that typography can have an effect on a reader’s mood, learning ability, and cognitive performance.
In two different studies, participants were divided into separate groups and given 20 minutes to read a typeset issue of a magazine (The New Yorker) on a tablet device.
One of the groups was presented with a badly typeset version, while the other group was presented with a properly typeset version.

During the session, participants were interrupted and asked to estimate the amount of time they thought had passed since the experiment began.
The results of the study showed that:
- Participants from both groups underestimated their reading time. This implies that reading is an engaging task.
- Participants in the proper typography group greatly underestimated their reading time compared to participants that were reading items with poor typography. This implies that reading with good typography is even more engaging.
Visual design tips based on Larson and Picard’s visual attention experiment on typography influence:
- Use easy-to-read font types to ensure readers’ visual attention.
- Ensure there’s enough white space between your text and visuals for visual processing.
- Avoid placing images or icons (visual information) between texts.

5. Recognizing the Gist of a Scene
Have you ever wondered what “a picture’s worth a thousand words” really means?
Why are we able to understand visuals through instant visual processing more thoroughly than reading and absorbing text?
As humans, we have the ability to gather context based on what we see (visual processing through the primary visual cortex).
When we fix our eyes on something, we have the ability to form an understanding of the environment (visual information) and recognize the meaning of a scene.
What is it?
According to Ronald A. Rensink, a research scientist from Nissan Research & Development, Inc., visual processing of scene gist or scene perception is the visual perception of an environment as viewed by an observer at any given time.
It includes not only the perception of individual objects but also things like their past experience, relative locations, and expectations about what other kinds of objects might be encountered.
On the influence of color on scene perception
In 2008, Monica S. Castelhano from the University of Massachusetts at Amherst and John M. Henderson from the University of Edinburgh conducted an experiment on the influence of color in activating scene gist.
The visual processing experiment was conducted in three different trials.
Undergraduates were exposed to a few hundred photographs of natural or man-made objects in various conditions to be later tested on their visual processing of these photos.
Participants were asked to determine whether or not a target object matched the scene they were seeing, and if they could recognize this despite a plethora of visual information.
Normal and blurred photographs with colors, and monochrome sample photographs were presented as different types of visual information.

To determine the role of colors in scene visual parallel processing, the following sample photographs were used:

They also studied the range of visual attention toward abnormalities with the following samples:

According to Castelhano and Henderson’s visual information findings:
- Observers were able to match the scenes and target objects within a second. This implies people have the ability to quickly get the meaning of a normal scene.
- Observers were able to match the scenes in less time if they were colored correctly (as compared to black and white). This means colors can help us understand scenes better.
- Overall, colors provide a function to help define the structure of objects and shapes. As long as the colors are not too different from what we normally perceive, we’ll be able to easily understand the meaning of an image through objects.
Visual information design tips based on Larson and Picard’s experiment:
- Use the (perceptually) correct icon or image to represent data. For example, a heart icon is universally associated with love, passion, or relationships.
- Be mindful of your layout and design hierarchy to share visual information.
- Use colors when possible, especially if you want to highlight important data or information with visual stimulus.

How Do These Visual Information Processing Findings Affect Your Design?
Understanding how the human brain and different people perceive visual information through visual perceptual processing reveals a great deal about the best practices for designing infographics, presentations, posters, brochures, and other types of visuals.
Based on these combined findings, here are some important information design tips:
- Consider your writing layout and visual hierarchy to achieve focus.
- Use images, illustrations, icons, and other graphic elements as much as possible.
- Be mindful of your color schemes and their respective function.
- Choose the right fonts.
Create Your Own Stunning Visuals With These Piktochart Templates
Keeping these newly learned visual information processing points in mind, you can now create beautiful and compelling visuals that create a lasting visual memory through conscious perception.
Here’s a collection of templates to create visually compelling assets that help transmit information to your focus audience.
Basic infographic template

Basic presentation template
Basic poster template
Basic trifold brochure template
Happy Piktochart-ing!
This blog post was originally published on October 31, 2014 and updated on June, 30, 2023, for relevance, new templates, and comprehensiveness.
Piktochart is your all-in-one visual storytelling solution.
Join 14 million users who design and make infographics, presentations, and videos with just a few clicks.
Try Piktochart for free