In July 2015, a few friends and I packed some bags and embarked on a motorhome tour of the United States’ West Coast. We traveled around for a month.
After visiting Las Vegas for a few days, we were in need of some quiet time, so we decided to drive from San Francisco to Los Angeles on the world-famous Highway 1 in California.
For a related read, see our guide on 5 psychology studies that tell us how people perceive visual information.
You might also find our article on free ebooks inspired useful.
Looking for more? Check out how to transform text into compelling images that tell a story.
We also cover this in our piece on visual communication storytelling courses.

A few miles away from Monterey, while Eddie Vedder’s album Into the Wild (arguably the best road trip music ever created), was sounding on a brand new speaker system, I cracked a Red Bull and sat down to wonder:
“Why didn’t we take the regular Interstate 5?”
You see, Interstate 5 is a fantastic highway that runs parallel to the Pacific Coast, and is the optimal route between San Francisco and Los Angeles – five hours and thirty minutes, or 383 miles. It’s the fastest, cheapest, and safest way.
On the other hand, Highway 1 is a one-way drive that hugs the mountains while precariously teetering cliffs overhanging the ocean’s rocky crags. It’s about 500 miles of tight curves, or a tiring 10-hour drive from start to finish.
After much thought, the answer was clear: Visuals.
We took a more dangerous and considerably longer ride because we wanted to experience Highway 1, and immerse ourselves in the beauty of that scenery.
It just goes to show that people love great visuals. Myself included. But why?
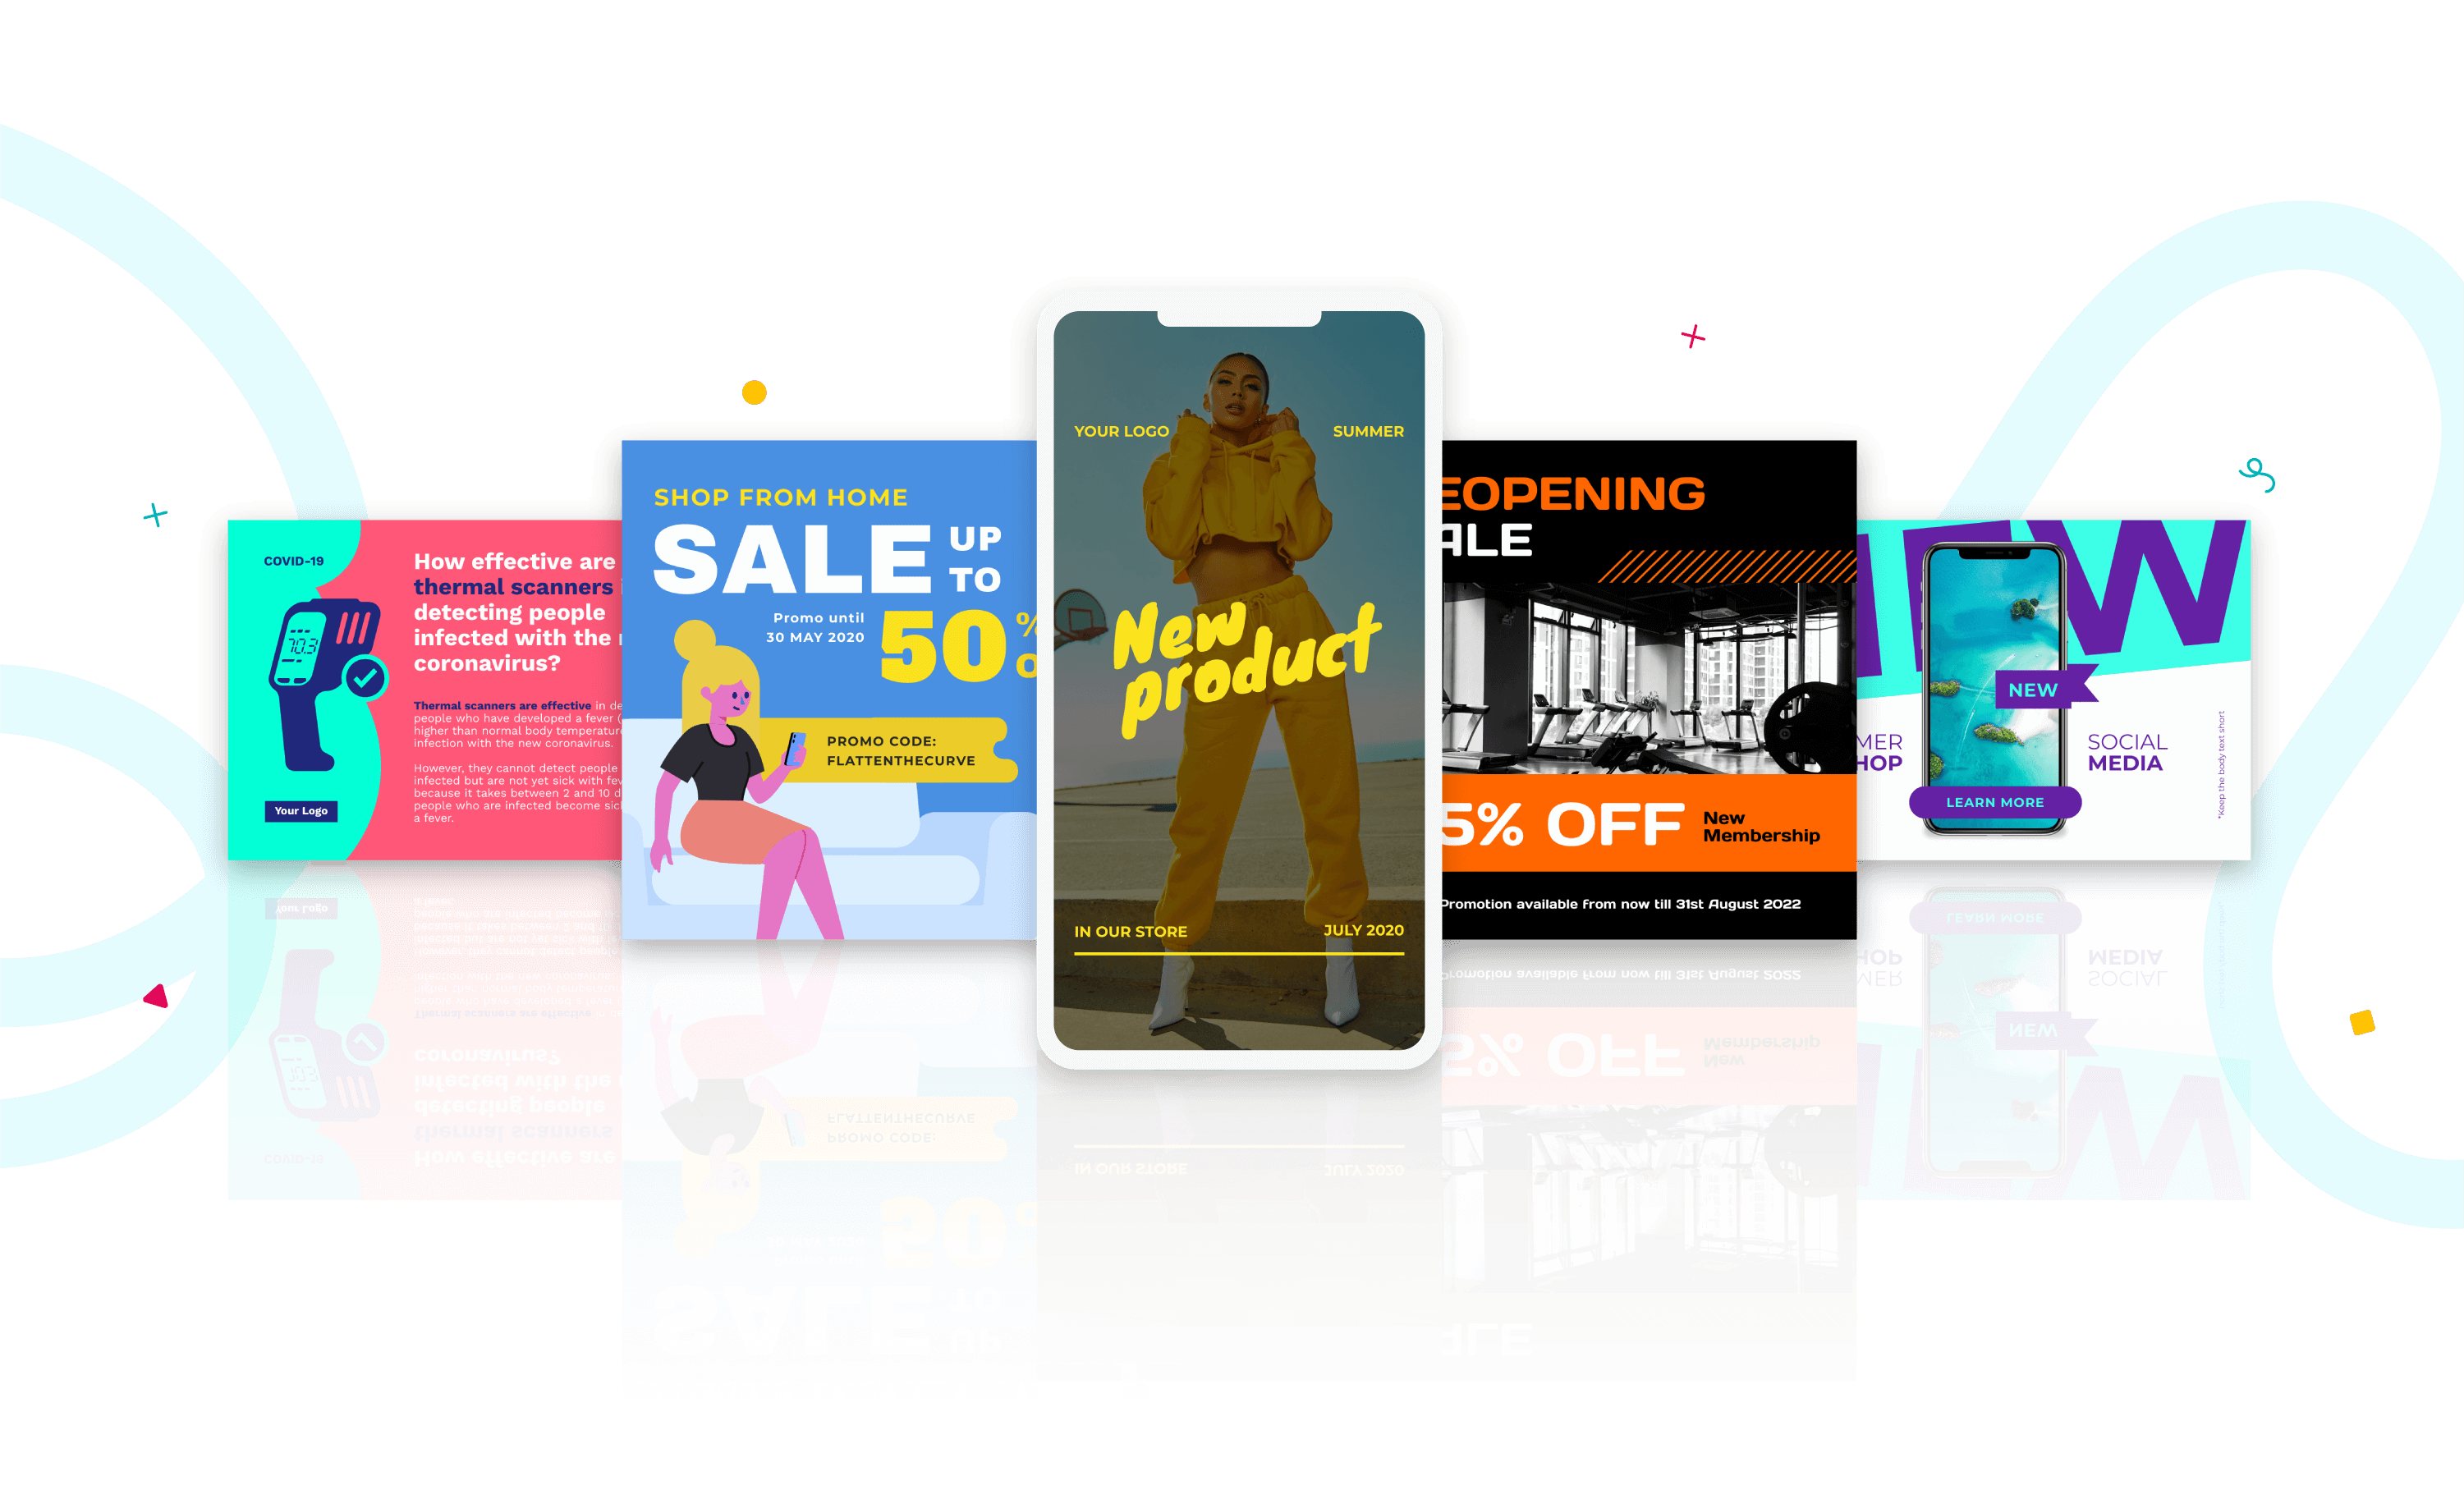
Piktochart offers professional templates to create great visuals including presentations, reports, infographics, posters, brochures, social media graphics, and more. You can jump right into designing eye-catching visuals by creating a free account.
Everything starts when we are born
At birth, visual structures are fully present but not fully developed. Newborns can detect changes in brightness, distinguish between stationary and kinetic objects, as well as follow moving objects in their visual fields.
Many of these areas start out poorly developed. But from the moment our eyes open for the first time, even before we learn to associate specific objects with behaviors, our brains start processing and understanding shapes and visuals.
Take, for instance, babies.

Even before their eye muscles are capable of focusing, they still turn and face their mothers. We are biologically hardwired to seek out a round object with two dark bands (one for the eyes, one for the mouth) even before we can see them clearly.
Our brains learn to associate visuals with something, even though we don’t fully understand the meaning of that something – like a mother.
In other words, from the moment we are born, visuals are our first connection to the outside world.
Our brains are hardwired to love images
Since early 2007, the internet has seen a 9900 percent increase in the use of visualized information. As technology and internet speed advances, businesses, startups, and giant corporations are becoming more and more visual.
Netflix is creating, producing, and directing their own shows (Orange Is The New Black, anyone?). Twitter is slowly moving towards a more visual feed by allowing images to auto-expand. And Instagram’s growth, even though it was bought by Facebook, refuses to slow down.
Why? Because we are visual creatures.

Almost 50 percent of our brain is involved in visual processing, and although we have five senses, 70 percent of all sensory reports are in the eyes. Our eyes are so good (and so much better than the rest of our senses) that we can grasp a visual scene in less than 1/10 of a second.
What’s even more impressive is that visuals are much more powerful and easier to understand than mere text. People recall 20 percent of what they read, 10 percent of what they see, but 80 percent of what they see and do. In fact, it takes 13 ms to process an image and 100 ms to attach meaning to it.
Visuals elicit emotions
Joy. Surprise. Contempt. Anger. Fear. Sadness. Disgust.
The seven universal expressions. We recognize them instantly in ourselves and others.

In the TV series Lie to Me, Tim Roth plays Dr. Cal Lightman, an expert in reading people’s facial expressions, body language, and tone of voice to discover emotions. He reads micro-expressions to solve otherwise unsolvable cases.
Why is he able to do it? Because external visual inputs generate expressions, which he uses to deduce the truth.
But this is just a TV series, you might say…
Well, the show was inspired by Paul Ekman, author of dozens of other books about emotions and their relation to facial expressions. The effect of visuals on our emotions is very real.
In 1980, psychologist and educator Robert Plutchik designed the wheel of emotions, which illustrates the emotion a person feels when interacting with visuals and colors.
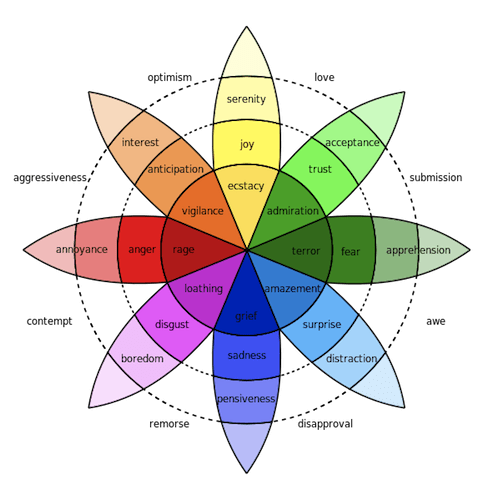
Visual inputs generate emotions in us. And if there is something our brains love more than images, it’s emotion. Emotions and how the brain processes them make us feel, react and survive.
We are always on the lookout for visuals because they generate emotions, and emotions create a deep connection. In fact, images can elicit a range of feelings, from awe to amusement to sadness, and that emotion doesn’t have to be positive to create a connection.
Emotions help us survive, thrive, make better decisions, and understand our surroundings.
These visceral reactions are some of the strongest connections we can make to visual content. When we feel, we are responding from the part of the brain responsible for survival instincts and fight-or-flight responses.
The response is subconscious. It originates from the central nervous system whenever we’re stimulated by vital factors.
How to design visuals people love
As such, visual content is extremely important. 60 percent of consumers are more likely to click on a business whose images appear in search results, and 67 percent of consumers consider clear, detailed images to carry more weight than product information or customer ratings.
I can keep throwing numbers at you… But the fact is that people engage more with visual content than any other type of external input.
But how can we leverage this crucial aspect of human nature to design beautiful, engaging images in a consistent manner? By applying the visual trifecta: Appeal, comprehension, and retention.
If crafted with intent and an understanding of who you are talking to, visual content can effectively generate a connection between you and your audience.
Ready to jump into creating visuals? Get started for free by creating an account and selecting a template from our infographic gallery.
Appeal
Visually engaging content is more attractive, and well-designed information generates initial interest even before the information is actually processed.
According to a University of Saskatchewan study, participants who viewed a visually embellished chart found it more attractive and memorable than a plain chart.
You might also find our article 15 Marketing Design Tips for Non-Designers helpful for more design tips and tricks!
Comprehension
Visuals should be designed for easy interpretation. Our brains are pre-wired to automatically interpret relationships between objects, allowing for instant comprehension with minimal effort.
Why do you think road signs are world-known icons instead of a full body of text?

Retention
Our visual system is able to make rapid connections to already-stored information in our memories. Visuals and videos are recalled much more promptly than text or other sensory inputs – 65 percent for visual content versus a mere 10 percent for pure text.
If you pick the right design elements you can create an emotionally appealing visual that generates a memorable connection with your audience, making retention more likely.

The conclusion is you should create beautiful, easy-to-understand, unique visual content that generates a memorable connection with the consumer. With Piktochart, you can customize every element of the template and use your brand assets to personalize every visual. Get started by signing up for free.
Try it yourself and let us know! How do you leverage visual content as a marketer, educator, or non-profit organization?
Images via Unsplash, Unsplash, Deadline
Create appealing, comprehensive, and retainable visual content for your consumers with Piktochart.
Customize every element of the template and personalize every visual with your own brand assets. Collaborate with your team to create infographics, posters, social media graphics, and more. Sign up for free.
Create a visual