People remember 80% of what they see and only 20% of what they read (Jerome Bruner, cognitive research, cited in Brain Rules by John Medina). Infographics tap directly into this visual advantage, which is why they get shared 3x more than any other content format.
If you have ever wanted to learn how to make an infographic but assumed you needed a graphic designer or expensive software, this guide will change your mind. In seven straightforward steps, you will go from raw data to a polished infographic, even if you have zero design experience.
You might find our guide on 7 steps of transforming information helpful, or our article on how to easily adjust a template.
Below, you will find a step-by-step walkthrough using Piktochart’s free infographic maker, real template examples, and tips for sharing your finished visual so it reaches the right audience.

How to Make an Infographic With an Infographic Template
In this post, I’ll show you how to make an infographic using Piktochart’s infographic maker. I’ll be going through the process myself, using a pre-made infographic template.
I’m not a designer, so if I can make a professional infographic, so can you.
I invite you to follow along by creating a free Piktochart account.
Here are the 7 steps we will follow for the infographic template:
And if you prefer to watch instructions instead of reading them, below you can find a video summary of this blog post including all information about creating an infographic template.
Ok. Ready?
Before we get started, let’s clear something up:
A Great Infographic Is About Communication, Not Design
People often overemphasize design in infographics. They add a ton of different fonts & colors, cram in all the latest design trends, and use a bunch of icons. Then they wonder why no one gets the message. Don’t get me wrong, design is important, but not in the way you think it is.
At its core, an infographic is just a combination of visuals and text to convey specific information.
Infographic design gives your content an extra dimension. It conveys the emotional aspect behind a message that is otherwise hard to put into words. For example:
Let’s say your company has a secret Santa event coming up and you want to make sure everyone knows it’s not about buying expensive gifts. You can do two things:
- Send out an email outlining the do’s and dont’s of gift-giving
- Create an infographic that goes through the same information but in a visual way

Sending a plain email is boring and makes it less likely that people will read the message. A well-crafted infographic, on the other hand, not only sends the message but also communicates that it’s supposed to be fun.
Don’t believe me? Have a look at some of this list of infographic examples made by others just like you. Simple techniques like choosing complimentary colors, use of juxtaposition for easier comparisons, and use of white space may be all you need to create a stand-out infographic – but you need to get the basics right, as we’ll discuss below.
Visual storytelling researcher Dr. Lynell Burmark notes that “unless our words, concepts, and ideas are hooked onto an image, they will go in one ear, out the other ear.” Effective infographics use three storytelling techniques: a clear narrative arc (setup, tension, resolution), strategic color psychology (warm tones for urgency, cool tones for trust), and the data-ink ratio principle popularized by Edward Tufte—maximize the ink devoted to data, minimize decorative clutter.
Now that we’ve got that out of the way. Let’s start creating an infographic.
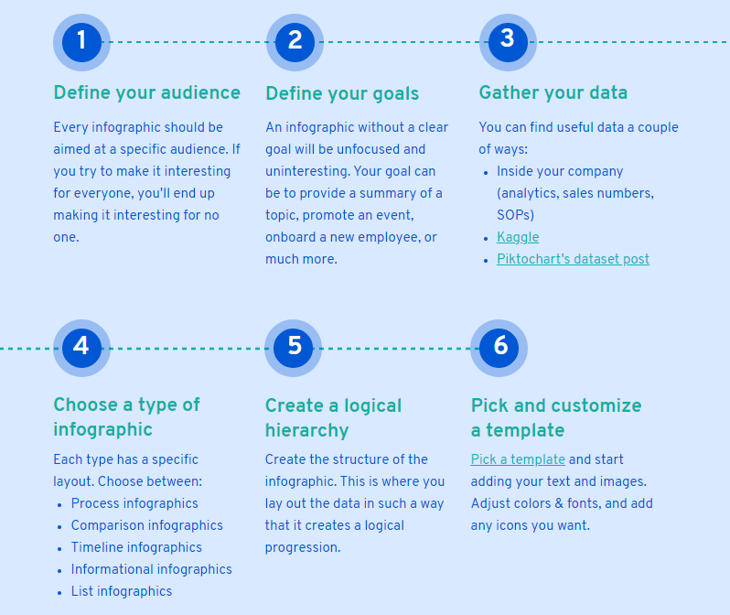
Step 1: Define Your Audience
When you try to please everyone, you end up pleasing no one.
Similarly, if you try to create an infographic that’s interesting for everyone, it will end up not being interesting for anyone.
Part of making a good infographic is deciding who it is for and—equally as important—who it is not for. Who your target audience is will determine what data you use, how much lingo and jargon you can get away with, what the overall style of the infographic will be, and in what detail you need to explain everything.
Ask yourself the following questions:
Is your target audience internal or external?
When you create an infographic for internal audiences, you can skip over basic information. You don’t have to explain the basics to your colleagues who have been working on the same thing for months. When your audience is external, however, you have to set the stage before you explain the details.
What’s your target audience’s position?
An infographic aimed at executives will differ from an infographic aimed at interns. The higher up you go in an organization, the more strategic things become, and your infographic will have to reflect that.
What level of knowledge do they have?
When your audience consists of experts, you can safely assume they understand the lingo associated with your field. You can skip over basic information and go more in-depth. This is important to consider also if you’re using it as a native ad on an article.
The audience for the infographic we’re creating is external. They have a working knowledge of what an infographic is and what you can do with it, and they need to communicate either with customers or with the general public.
Ready to create an eye-popping infographic?
Join more than 14 million people who already use Piktochart to easily create effective infographics.
Step 2: Define Your Goals
Just like your visual will be vague if you have no audience in mind, your visual will look unfocused if you don’t have a clear goal. An infographic can have several goals. It can:
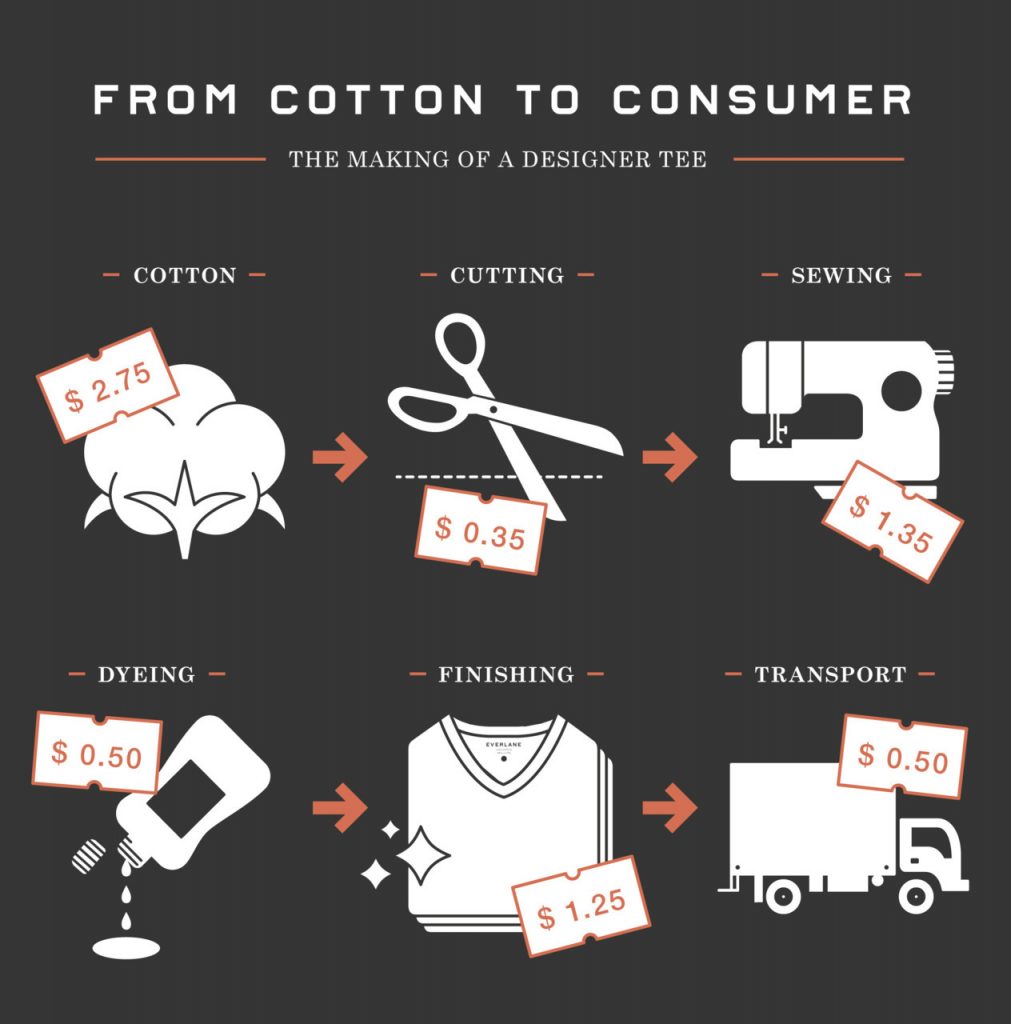
Visualize a process
In 2011, Everlane created an infographic explaining why clothes cost more than they should. They walk you through the process of what it takes to create a basic t-shirt and how much each step costs. Then, in the second half of the infographic, they explain how companies mark up the price and how it’s sold to you at a much higher price than it needs to.
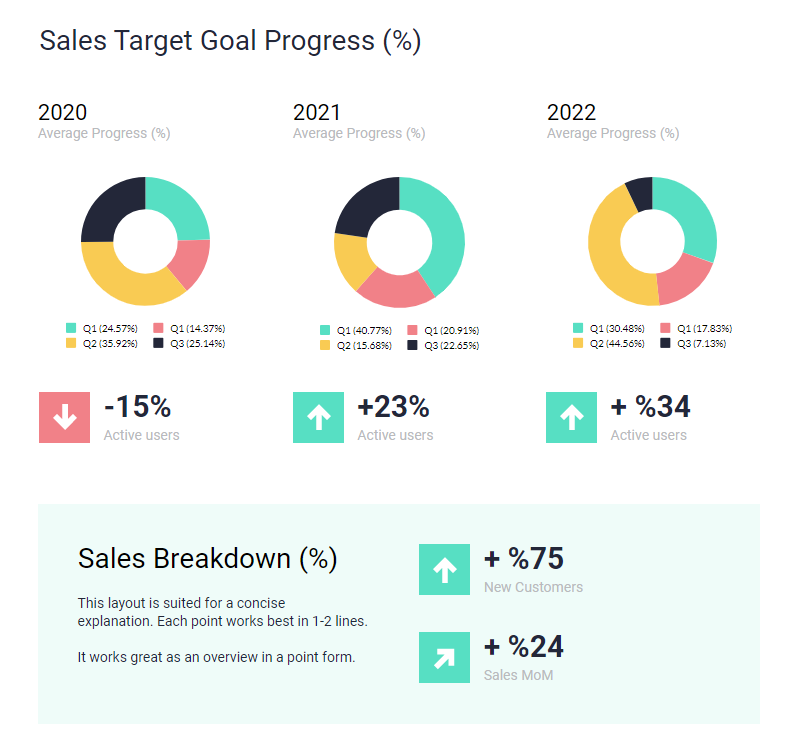
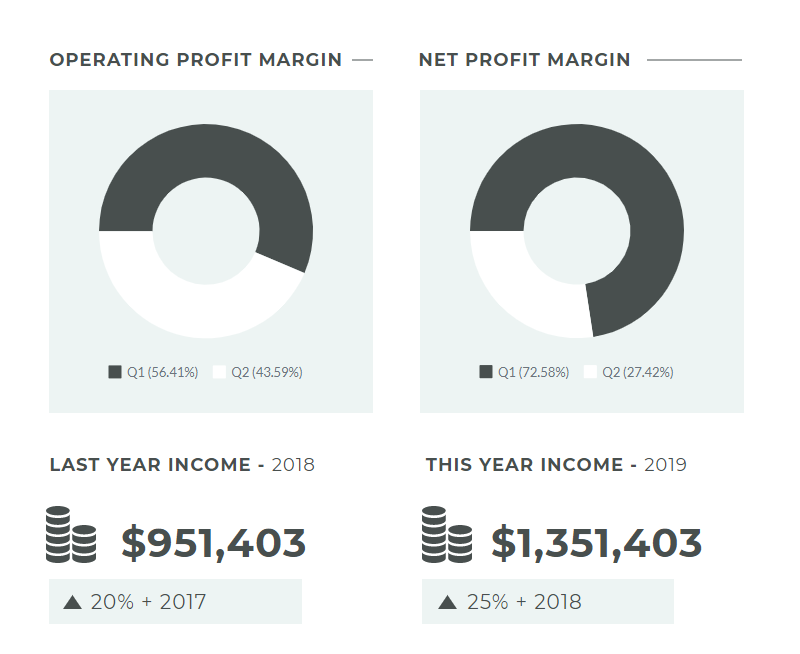
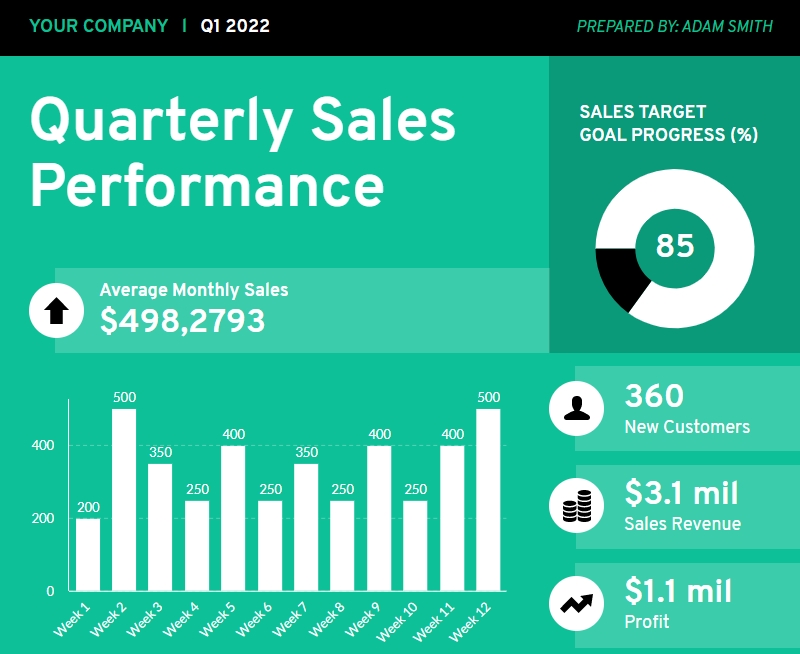
Report on data
Spreadsheets are boring. An infographic can take the same data and turn it into a meaningful story. Whether you need to report on progress, inform your boss, or do regular data visualization, infographics can be used to give a nice overview of where you are and what needs to get done. If you are still studying, take a look at these infographic examples for students.
Onboard an employee
Starting a new position is stressful and confusing. If someone is new in your organization and you want to give them a cheat sheet of how your company/different departments work, create infographics for them to reference.

And much more. Whatever your goal is, it’s going to determine how you’re going to lay out the information in your infographic.
For our infographic, our goal is to educate people on how to best create an infographic. We’re doing that by creating a summary of this post that you can reference or send to other people.
Step 3: Gather Your Information
The next step is ensuring the information you gather supports your goal. This is the step where a lot of people get stuck. If the core of an infographic is meaningful information, where do you get the information from? If the goal is to show data visualization in a digestible format, where do you get the data from?
The first and the most convenient place is your own company. Analytics, sales data, and SOPs can all give you plenty of data to turn into an infographic. Just make sure you have permission to use the data.
Sometimes you don’t have access to (or you don’t want to) use your company’s data. In that case, a good place to look for interesting data is Kaggle. Originally meant to provide data sets to machine learning and data science enthusiasts, you can find a whole range of data, from the top games on Google Play to basketball datasets or global warming.
Make sure you save the sources, though, because you’ll need them in your infographic.
One thing to take note of when gathering data is that less is more. It’s tempting to wow viewers with a truckload of data for data visualization, but often this has the opposite effect. Instead of thinking it looks cool, people get confused and leave. We recommend two options:
- Give enough data points to get an overview of a topic.
- Take one data point and explain it in depth.
If you try to do both you end up with a giant, unfocused infographic slide that confuses people.
For our infographic, since we’re making a graphic that summarizes this post, we’re using its outline for data visualization.
Step 4: Choose a Type of Infographic
The type of infographic you pick determines the overall layout of your data.
There are a couple of infographic types:
Each has its own specific way of displaying information. Comparison infographics will use a two-column layout whereas a list will have one column. Start thinking about how you’ll lay out the information so that when you pick a template, you know what to look for.
For our infographic, since we’re talking about a process, we’ll use—you guessed it—a process infographic. We know we’ll have to look for a template that either shows processes or something we can use to show progression. A two-column layout like in a comparison won’t work.
Step 5: Create a Logical Hierarchy in Your Data
It’s time to bring some structure to the information you gathered in step 3. The reason you do it first is that it becomes hard to adapt once you’re working on the design.
I suggest creating the structure either in Word or in a Google Doc so you can have an overview and switch data around without much of a hassle. Trying to do that after you designed the graphic is a pain.
One thing that helps you create a more logical structure is to talk through your outline. Going through the structure you created and explaining it as you go along will show you where the gaps are in your argument. And because you’re still doing it in Word or Google Docs, you can still adopt it easily.
Since we’re working with the outline for this article, the structure won’t look much different from our outline. Here’s what we’re going to use:
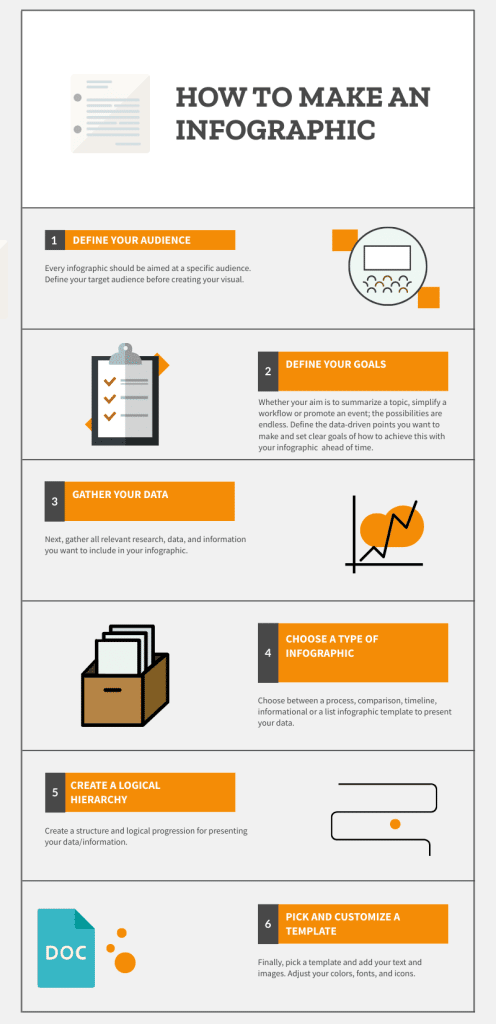
Step 6: Pick and Customize an Infographic Template That Fits Your Message
I’ll be honest with you: Unless you’re a designer, don’t design your own infographic from scratch. I know everyone likes to think they’re great at design, but unless you spend time developing an eye for it, you don’t know what looks good and what doesn’t.
A good design won’t make your infographic successful, but if your graphic has such a bad design that it starts to detract from the message, you’re in trouble. An infographic with a solid structure but an OK design will do better than a perfectly designed infographic that is all over the place.
That’s why I recommend picking a template and adjusting it to your needs. Our infographic templates are created by professional designers and are made to be customized. Besides, chances are you don’t have the time it takes to create it good infographic from scratch. You have a million other things to do.
Pick a template that roughly matches the structure you’re aiming for and adjust it to your need. At most, copy and paste parts, move them up or down, and change colors & fonts.
Let’s do that in our infographic template.
Since we want to create an infographic that shows the process of making one, I’m going to look for a template that has the elements that I want. Since it’s a process, I’m looking for templates that either have steps in them or elements that show progression.
I ended up using this employee onboarding template we showed earlier. Although the template is about a different topic, it has the elements we want to create our infographic.
Now let’s adjust it to our needs.
Adjusting an infographic template in Piktochart
Templates are a starting point for your graphic. They shouldn’t be used as a final image.
Adjust the colors, fonts, text, and images to make the template your own. It’s easy to do with our infographic maker.
Adjusting colors
Color impacts the tone of your infographic. Using bright, playful colors will give your infographic a… well, bright and playful look.
Keep in mind the goal and the message your want to communicate. You don’t want to use bright and playful colors when you’re talking about a serious problem.
First, we’ll adjust the color of the infographic. The pink is nice and all, but it doesn’t fit the message we’re going for. Instead, I’ll look at the different color schemes available in the template.
When you click on them, the template will automatically update the colors.
If your company or brand has a specific color scheme, you can manually pick the colors you want.
If you don’t like the color palettes included in the templates and you don’t want to use your own brand’s colors, you can still use a tool like Coolors to come up with a good palette for you. Again, unless you have a good grasp of color theory, I advise you not to create your own color palette.
For our infographic template, I’m using the Blue turquoise color scheme that’s part of the template’s built-on palettes.
Adjusting text & fonts
Just like colors, fonts have a big impact on how a message is perceived. Pick the wrong one, and your message gets a whole new meaning. For example:

Finding the best fonts and font combinations is an art in and of itself. I won’t go into detail here, but you can check out our other post about font pairing. Alternatively, you can use a tool like Fontjoy to help you out. Piktochart provides a large range of resources to make sure your chosen infographic template works with your desired texts and fonts.
For our infographic, I will keep the fonts as they are.
At this point, we’re adding our own text, and we start to move some text around. As you can see, I changed a couple of things:
- Modified the headline and the subheader.
- Switched the headline and subhead, so the subhead is at the top.
I also started adding my text to the infographic template. I’m trying not to mess with the design too much at this point, and instead, I’m just trying to get all the text on the infographic design so I can focus on images, icons, and alignment later on.
Adding images and icons
An infographic design with only text is boring, so you’ll need images and icons to spice things up. However, out of all the things you can change in a template, images, and icons are the easiest to screw up. With colors and fonts, you can use tools to compensate for the lack of experience.
With images and icons, however, you’re messing with the whitespace and composition of the design. You can use the helper lines in Piktochart to snap elements into place and keep things aligned, but ultimately you have to decide whether something looks good or not. This requires some knowledge of basic design principles.

What images and icons to add depends on your message and what emotional message you want to communicate. Think of what would symbolize your message. A picture of a beach can represent vacations, a picture of a conference can represent collaboration, and so on.
But please (please!) avoid the overused stock photos. You know the ones, a customer support employee smiling at the camera, two guys in a suit shaking hands, or the very politically correct group of people who seem weirdly happy to be in a meeting.
For our infographic, I’m not using images at all. I’m using the built-in illustrations Piktochart has.
First, I’ll put in our logo and delete some of the illustrations that are already there. As much as I like them, too many will drown out the headline. I’m also replacing the illustration on the right with one that represents the message a bit more.
For the body of the infographic, I don’t like the numbers too much, so I’ll replace them with icons to represent each step.
To finish it off, I also replaced the bottom illustration with the same one we had at the top. And that’s pretty much it.
Step 7: Download, Share, or Embed Your Infographic Design
Once your infographic is complete, you can either download it as a PNG or a PDF and send it via email or share it on social media. If you added links to your infographics that point to other resources, downloading it as an image doesn’t make sense.
You can embed your infographic on your website. To do this, go to “share”, tick the box to make your infographic public, and click “view embed code”. This allows you to paste the piece of code on your website. If you’re using WordPress and want to embed it in a blog post, you’ll have to put the piece of code in an HTML block.
To promote your new visual, you also have the option to submit it on infographic submission websites.
Data Visualization Tools and Free Resources for Infographics
Choosing the right chart type is half the battle when visualizing data in an infographic. As information designer Alberto Cairo explains in The Truthful Art: “A chart is not an illustration or a decoration. It is first and foremost an information tool.” Match your chart type to your data relationship:
- Comparison (bar charts) — comparing quantities across categories
- Trends over time (line charts) — showing change across a timeline
- Composition (pie or donut charts) — parts of a whole
- Relationship (scatter plots) — correlation between two variables
- Flow (Sankey diagrams) — movement between stages
Piktochart’s AI infographic generator handles chart creation automatically—describe your data and it selects the right visualization. For manual builds, the drag-and-drop chart widget supports 13 chart types including bar, line, pie, area, scatter, and donut.
Free icon and image resources for infographics
Strong infographics rely on consistent visual elements. Here are resources you can use for free, even commercially:
- Piktochart built-in library — thousands of icons, illustrations, and photos included free with your account
- Flaticon — over 16 million vector icons in consistent style packs (free with attribution)
- The Noun Project — curated icon sets organized by concept
- Unsplash — high-resolution photos, free for commercial use without attribution
- Pexels — free stock photos and videos with a commercial-friendly license
How to Share and Promote Your Infographic
Creating a great infographic is only half the job. The other half is getting it in front of the right people. A well-promoted infographic can drive traffic, earn backlinks, and position you as a credible source in your field.
Resize for Social Media
Each social platform has ideal infographic dimensions and formats:
- Instagram carousel (1080 x 1080 px per slide) — break your infographic into 5-10 swipeable cards. Carousels earn 3x more engagement than single posts.
- LinkedIn single image (1200 x 627 px) — crop to a key stat or headline visual. LinkedIn’s algorithm favors native images over links.
- Pinterest pin (1000 x 1500 px) — vertical format performs best. Include your brand logo and a clear title overlay.
- Twitter/X (1600 x 900 px) — crop to the most shareable data point. Tag sources for retweet potential.
Piktochart’s resize feature lets you reformat a single infographic for all these platforms in one click—no need to rebuild from scratch.
Each social platform has its own preferred image dimensions. A vertical infographic works well on Pinterest (1000 x 1500 px is the sweet spot), while LinkedIn and Facebook favor horizontal or square crops. With Piktochart, you can resize your design for each platform without starting from scratch. Post a teaser snippet on Instagram Stories, then link to the full version on your blog or landing page.
Embed on Your Website or Blog
Hosting the infographic on your own site gives you control over the SEO value it generates. Upload the image with a descriptive file name (e.g., “how-to-make-infographic-steps.png” rather than “image1.png”) and write alt text that includes your target keyword. Add a brief introduction above the embedded image, and include an embed code below it so other sites can share it while linking back to you.
Include in Email Newsletters
Infographics perform well in email because they break up text-heavy newsletters. Drop a cropped preview into your next send with a “view the full infographic” link pointing to your hosted page. This approach drives traffic and gives subscribers a reason to click through.
Submit to Infographic Directories
Sites like Visual.ly and Infographic Journal accept submissions and can expose your work to new audiences. Prepare a short description and relevant tags before submitting. These directory listings often include a backlink to your original post, which supports your search rankings over time.
Optimize for Search
Search engines cannot read text inside images, so the surrounding page content matters. Use your target keyword in the page title, the image alt attribute, and the first paragraph of supporting text. Compress the image file to keep page load times fast; tools like TinyPNG reduce file size without visible quality loss.
How to Make an Infographic With AI (In Under 10 Seconds)
The 7-step process above teaches you the fundamentals. Once you know them, you can skip most of the manual work entirely.
Piktochart’s AI infographic generator takes a single text prompt and produces a set of professionally designed, ready-to-edit infographic templates in under 10 seconds. No blank canvas. No layout decisions. No time spent searching for the right template.
Here’s how it works:
1. Enter your topic or paste your content.
Type a prompt, paste text from a report, or upload a document (PDF, DOCX, or TXT). The AI reads your content and structures it automatically.
2. Pick a template.
The generator produces a curated set of design options. Choose the one closest to your message.
3. Customize in the editor.
Swap colors, edit text, upload your logo, and adjust any element to match your brand. Every detail is editable.
4. Download or share.
Export as PNG or PDF, or share a live link directly from Piktochart.
The AI workflow is worth using when you’re working to a tight deadline, repurposing existing written content, or producing infographics at scale. The manual process is worth knowing so you understand what makes a strong infographic before you automate it.
5 infographics examples
Now that we’ve covered how to make an infographic, you might be wondering how to speed up the process while maintaining a high-quality output.
And here’s the secret: using pre-existing free templates.
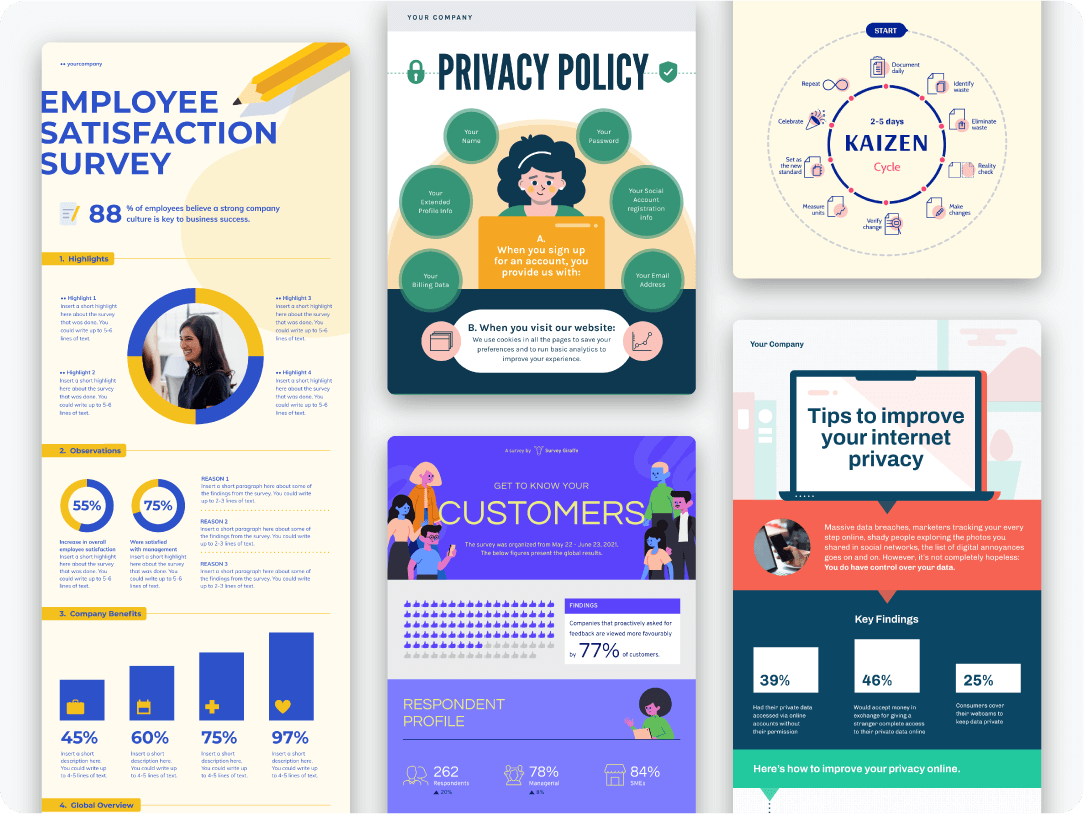
Templates are like shortcuts on your infographic journey, streamlining your creation process and freeing you to inject your unique content and personal flair. They not only save you time but also ensure visual coherence, giving your infographics a sleek, professional look. With Piktochart, you get access to an array of free templates, designed to make your infographic crafting smoother and more efficient.
Informational infographic template
Want to repurpose existing blog or video content?
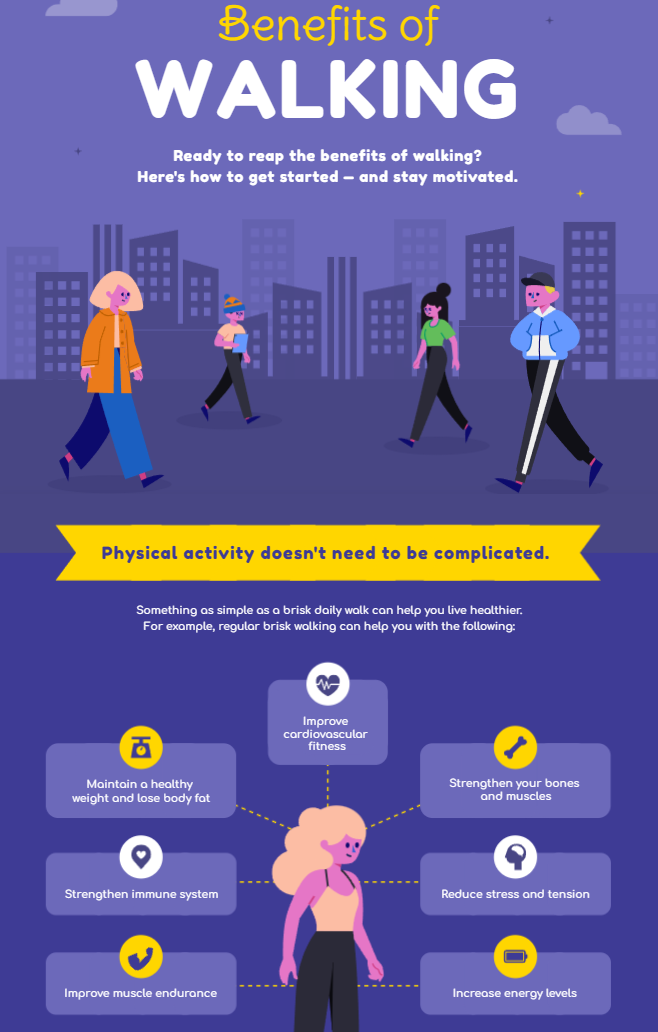
An informational infographic is an effective visual format to relay the key points of your original content to your audience.
For example, this infographic is about the benefits of walking. The template presents the health benefits in a concise, visually appealing way, followed by practical tips that are easy to follow. The way the template is laid out allows readers to easily understand and remember the content.
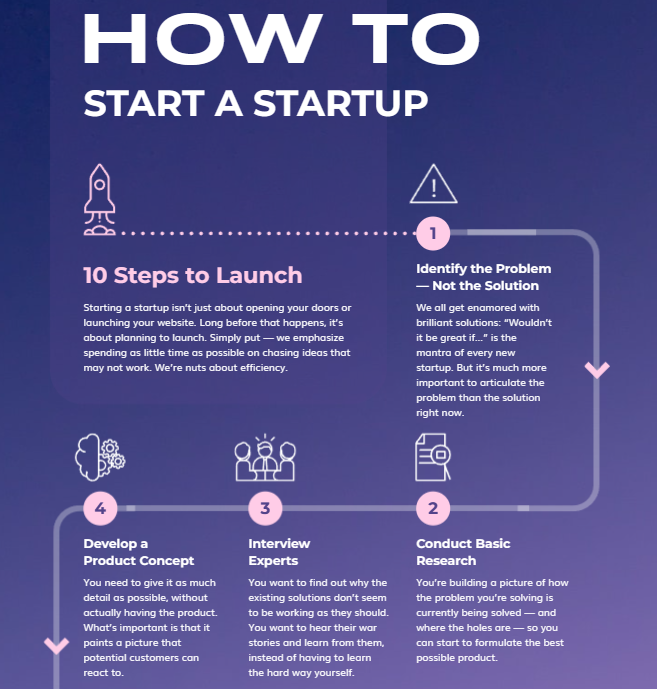
Timeline infographic template
A timeline infographic is perfect for visualizing a sequence of events or a process. It can help your audience understand the step-by-step process, from ideation to scaling, which can be complex and difficult to grasp when presented in a textual format.
This timeline infographic example outlining the startup journey is a powerful tool for visual storytelling.
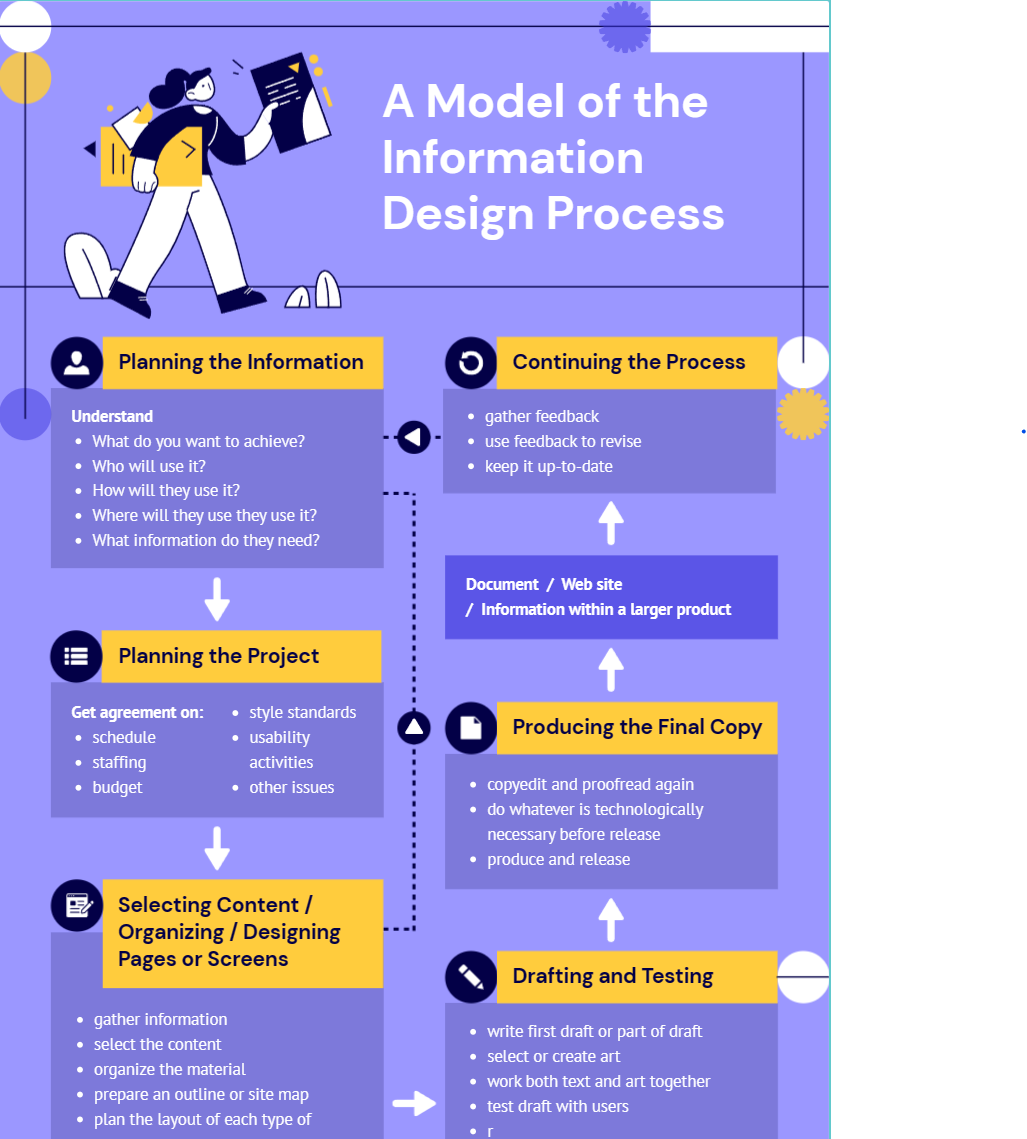
Flowchart infographic template
A flowchart infographic is an excellent tool for explaining decision-making processes or workflows.
The beauty of a flowchart infographic lies in its ability to simplify the complex. It takes those winding decision-making procedures or workflows, and unravels them into easy-to-follow visual narratives.
Each step, each decision point, even potential bottlenecks – they’re all broken down into digestible, interconnected pieces. With this, you not only improve transparency but also empower your audience to navigate the labyrinth of complex scenarios with ease.
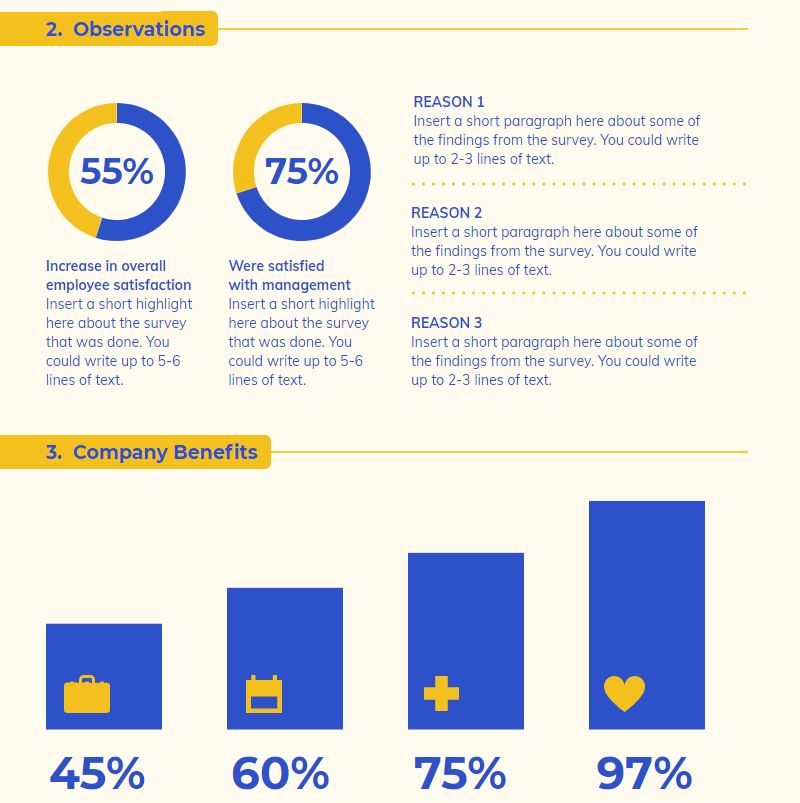
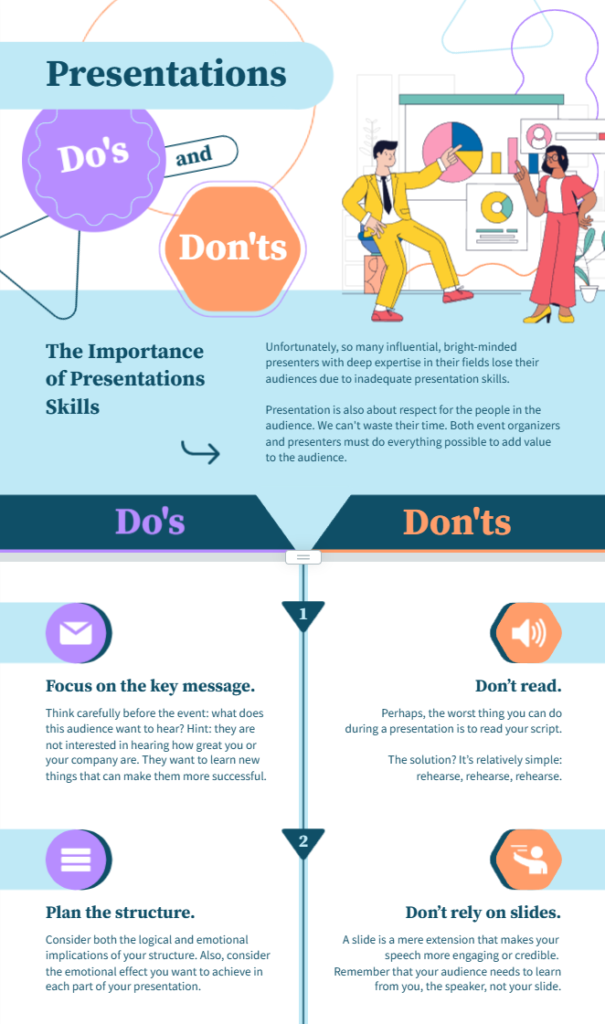
Comparison infographic template
Imagine having to illustrate two concepts or sets of data side by side. Sounds tricky, right? Not with a comparison infographic. Comparison infographics are incredibly effective for teaching good practices and common pitfalls, such as in the case of public speaking.
Just like putting two photos side by side, it helps your audience see what you’re talking about right away.
And guess what? It’s not just about data. You could be comparing dos and don’ts, pros and cons, or even two different products.
They’re like your visual coaches, clarifying everything from good practices to common errors, say, in public speaking. It’s like a visual cheat sheet that highlights differences and underscores similarities too, delivering a balanced view of a topic.
So, whether you’re a veteran speaker polishing your skills, or a beginner aiming to sidestep pitfalls, a well-designed comparison infographic can be a handy guide. It doesn’t just simplify learning—it makes it fun.
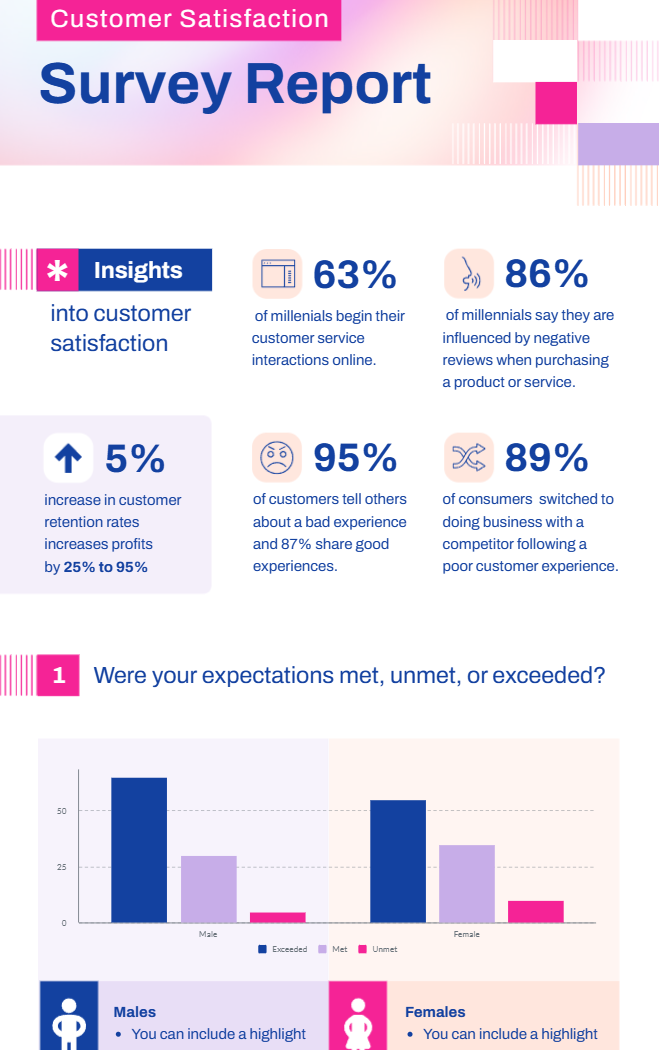
Survey results infographic template
Gathering survey responses is an efficient method to amass a substantial amount of data quickly. But what do you do when you’re left with a mountain of information to decode?
This is where the magic of infographics comes in.
They act as a visual espresso shot of your findings, condensing broad data into an easily digestible, engaging format.
Infographics can beautifully portray a vast array of demographics, from geographic data to age brackets and income levels. This visual approach makes patterns, trends, and insights pop, enabling your audience to grasp the bigger picture swiftly.
Instead of drowning in raw data and convoluted spreadsheets, you’ll be swimming in clarity and insights through smart data visualizations.
Creating Infographics: Rinse & Repeat Your Infographic Templates
The beauty of using infographic templates to create these data visualizations and graphics is that once you create an asset, you can reuse the infographic and the design elements involved repeatedly.
While the written content and specific graphics or visual content will change, you can reuse your original design ideas, color palette, layout options, and more, cutting task time in half! This is useful when you create reports or graphics that must be updated regularly.
If you want to give it a go yourself, create a free Piktochart account and play around with some of the infographic templates.
Learn how to get started with Piktochart
Watch this short tutorial for a complete overview.