
The good ole’ saying “Build it and they will come” might have been true before, but now it’s far from reality.
There is so much noise on the internet, it’s ridiculous. Every day, two million blog posts are written and published – that’s enough content to fill the Times magazine for the next 770 years. 864,000 hours of video are uploaded every single day to Youtube.
That’s like watching The Lord of The Rings: The Fellowship of the Ring 227,368 times in a row.
This means that designing and publishing an infographic won’t get you much traction in and by itself. You need a way to promote and maximize the reach of your piece. There are numerous ways to do it – including paid ads – but the most organic, efficient, and cost-effective way is to leverage your own audience and get them to share it.
To launch a successful infographic, you need a strong audience or community that gives you permission to market to them. People who are familiar with your work, and which you engage on a consistent basis are more likely to share your content with their own audience.
When you are launching something, this audience becomes a platform. A launchpad of sorts from where you could launch your rocket.
Don’t know how to begin making your infographic or want a time and effort efficient mechanism to create them? Look no further. Piktochart offers professional visuals to create infographics, presentations, posters, brochures, and more. Get started by signing up for free.

A perfect example is Tim Ferriss and his blog. He spent years providing value and building an audience, and now, everything he puts out to the world is a raging success. This includes The 4-Hour Body, The 4-Hour Chef, his new podcast, or the TV Show, both of which ranked #1 in iTunes for weeks.
It’s important to note that it all starts with your infographic. If you design and publish high quality content, your audience will do the hard part of the job for you, which is sharing and syndicating your piece. But if your content is dull and unoriginal, no one will share it as they wouldn’t identify themselves to their friends with sub-par content.
Going back to Tim Ferriss, his audience syndicates his blog posts and projects because he consistently delivers extremely high-quality and unique pieces of content.
For further reading on how to build the right piece of content, we covered how to design beautiful infographics here, and how to increase their chances of growing viral here.
In this December Series, we’ve been working on how to market your infographic. Today, we are going to learn how to leverage your own audience to give your piece of content some initial traction. Let’s start!
Email your list of subscribers
We’ve mentioned countless times that email is not dead. But in addition to being alive and kicking, email is a fantastic way to build an audience and communicate directly with it.
According to a 2012 study, email is still an important part of many people’s work lives, with the average person spending up to 50 percent of their time in the inbox. 50 percent. That’s about half their time.
In addition to that, if someone gave you their email, it’s a huge sign of trust towards you. They gave you the permission to reach out to and market them.
Neil Patel, from KISSmetrics, sustains that out of all the channels he tested as a marketer, “email continually outperforms most of them”. Corey Dilley, the Marketing Manager at Unbounce, says that their email list is “the biggest asset they have for driving new acquisitions”.
If you have a list of subscribers or a newsletter, the first action you should take is share your infographic with them. They are some of your most loyal fans, and they are eager to consume and share your content with their friends.
That’s because they know you and trust you, and if they are still on your list, it’s because you proved over and over again that your content is valuable.
And your infographic is no exception.
The easiest way to share it with your email list is to use your email service provider. There are dozens of them out there, and each one if slightly different. While not directly integrated to our tool, my personal favorite is Mailchimp – not only their product and support is amazing, but they have a cute monkey as a mascot!
You have two ways of sharing your Piktochart infographic with your list – you could email them a link, or upload the image to your email. You can try them out right away by creating a free account.
To get the link, once you finish designing your infographic, click on Share, on the top right corner. That will open a modal window, where you could grab the link.

Simply share that link in one of your emails or weekly newsletters, and you are golden (Tip: You can use Piktochart to design engaging newsletters).
The second option is a bit more complex, but your readers might appreciate it. It consists of downloading your infographic as a .png, and uploading the full image (or a section of it) into your email.
Downloading an infographic in Piktochart is super easy. Click on the Download button on the top right corner (next to Share), and a modal window will appear.

Make sure these 2 options are marked:
- File Format: .PNG.
- Download As Blocks: OFF
Share it on Facebook and Twitter
Even though social media isn’t as direct as email, it’s still a valuable marketing tool and communication asset to engage with your existing fans.
Unfortunately, both Facebook and Twitter aren’t ideal mediums for an infographics. Although images get 53 percent more engagement than any other type of posts, the landscape nature of the images make it difficult for infographics to shine.
However, don’t sweat it – there are a few ways around that!
Take a look at this Facebook post by the team at Lemonly:

They worked really hard on an infographic illustrating Brett Favre’s football career, and they wanted to share it with their Facebook fans. What they did is take a screenshot of the most compelling part of their design, and upload it to Facebook.
To support their graphic, they added a fun and interesting description where they tagged the people and companies involved (in this case, Brett Favre and the Green Bay Packers), and at the end, they offered a short link to the full infographic to drive traffic to their website.
Twitter has a similar problem, that’s even more accentuated by the fact that they cut down images to fit into their timeline at 1024x512px.
Let’s take a stab at this Inc’s Magazine update.

As with Facebook, you should repurpose or screenshot your infographic into a smaller, more compelling graphic, and place a link to the full piece so you can track clicks and cut down on characters.
With that said, it’s also important to signal that the post is an infographic by adding #infographic or [infographic] at the end of the update. It’s also a good idea to mention all the parties involved – in this case, @justinjbariso.
Pro tip: although taking a screenshot of your infographic might work, at Piktochart we prefer to repurpose the design into a micro-sized bite you could use on any Social Network to link to your piece. Learn more Piktochart hacks.
Pin it on Pinterest
Pinterest? Yes. Pinterest. According to Shareaholic’s Q3 2014 Social Media Traffic Report, the social network predominantly dominated by women is one of the largest traffic referrers – in 2014, it brought 3x the referral traffic than Twitter, Youtube, StumbleUpon, Google+, reddit and Linkedin combined.
What’s really interesting is that a Pinterest infographic can be a long term asset for you or your business. Contrary to Facebook, in which updates are ephemeral, it takes a pin 3.5 months to get 50 percent of its engagement. In comparison, the half-life of a Pinterest pin is 1680 times longer than a Facebook post.
Also, due to its visual nature it’s the perfect place to share an infographic with your followers.
Uploading an infographic to your Pinterest account is easy. After you download your image as a PNG, login to your account, and create a new pin from your device.
Pinterest’s main benefit is that images are primarily in portrait mode, so you can simply upload the infographic as it is – no further editing needed. This will allow your audience to appreciate the content in full, without having to click elsewhere.
Remember, that although it’s a visual medium, and there is no need to take a screenshot of a section of your infographic, a fun and attractive description with some character will get you more repins and clicks.

Pin descriptions that get repinned the most are between 100 and 200 characters. Also, adding a few hashtags will make it easier for new fans to discover your pins.
If you are interested in the best time to post, then you should schedule your pins to go out between 2pm to 4pm, or 8pm to 1am, and ideally on Saturday, which is the best day to post.
A good idea is to have targeted boards in Pinterest, each featuring a collection of infographics about different topics.
Engaging with your audience
We just learned the mechanics of how to share your infographic with your audience. However, your work shouldn’t end there. Not at all.
In fact, most respectable marketers consider that the start. The fact is that social media isn’t a broadcasting tool, it’s a conversation between your brand and your audience.
Your relationship with your customers is a two-way channel you need to encourage, nurture and facilitate if you want to succeed.
Before starting, it’s important to put yourself on your audience’s shoes and ask these three enlightening questions:
- Why am I following this brand on social media?
- What do I want to gain by following them on social media?
- When is the point that I will decide to stop following this brand?
With that in mind, let’s go over three quick tips.
Respond to comments
Customers have questions about your product or service. They might have complaints about poor support, or important feedback for your team. Customers want to know that you appreciate that they chose your brand over its competitors.
As we mentioned, social media is a two-way channel, not a broadcast show for your brand. Part of that two-way communication is actively engaging with your audience, and responding to their comments, feedback and complaints.
This will show you are an active brand that cares about their customers. In fact, 71 percent of people who have positive customer service through social media recommend the brand to their friends. What’s even more impressive is that it might turn around negative situations in your favor.
According to Mediapost, 18 percent of those who posted a negative review of the merchant and got a reply ended up becoming loyal customers and buying more.
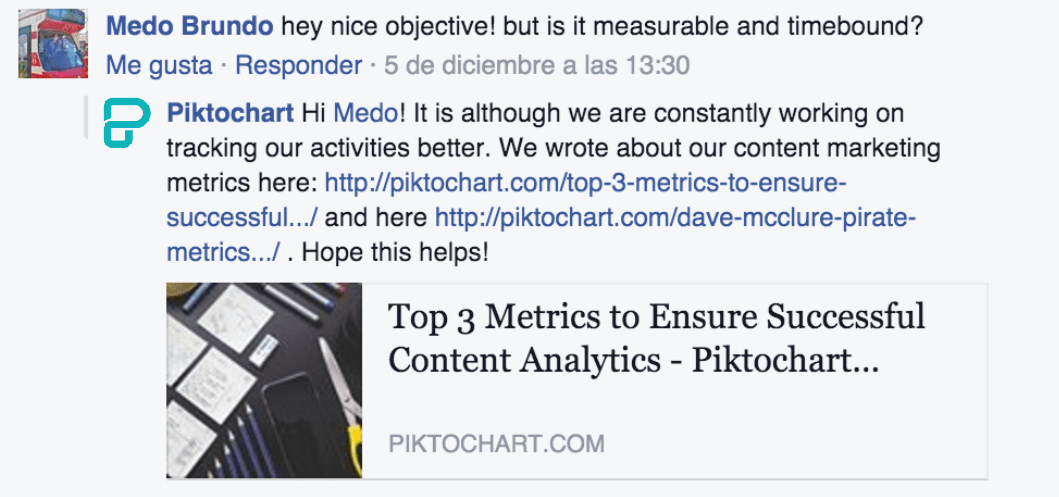
Below you’ll find an example of how we do it at Piktochart. A user had some concerns regarding our company’s mission, and voiced them out via Facebook Ads. Moments later, one of our Customer Delight team members responded with a helpful answer, pointing him to further information.
Go out of your way to be helpful
The way you interact with your customers can truly make or break your business. When people reach out to you with a complain, it’s an opportunity for you to turn things around, show you care about them, and win over a loyal fan.
Let’s take a look at a conversation the Buffer team had with a customer who was experiencing some issues.
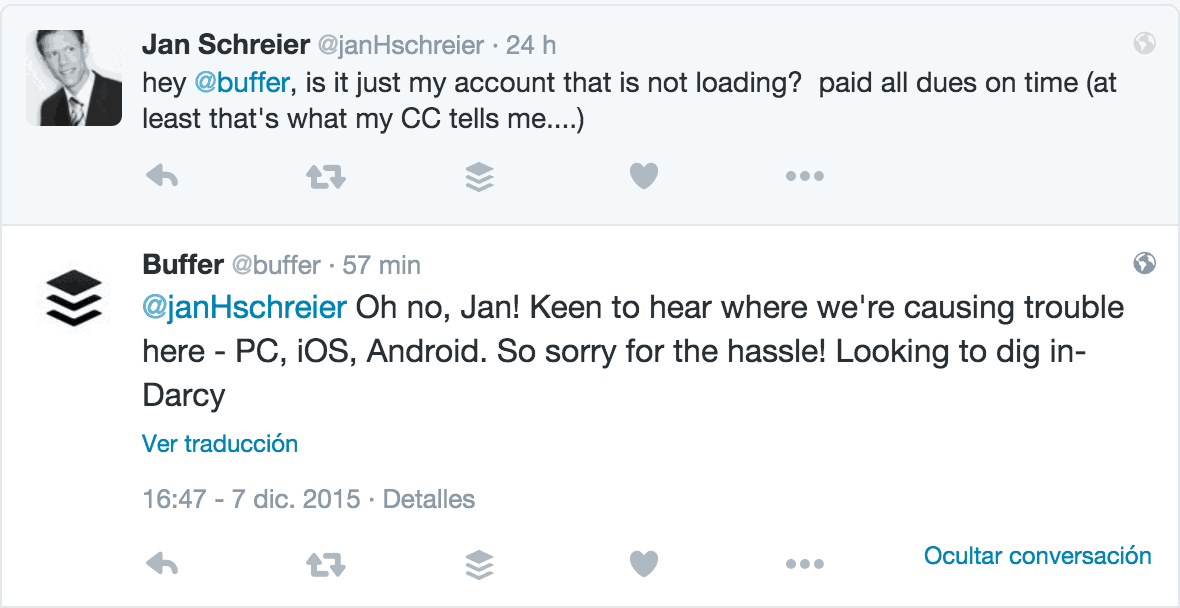
In this quick conversation, there are 3 important things to highlight and learn from:
- The customer is always right. When dealing with an issue, it’s important to acknowledge that you are on fault and not the user, and let them know that you’ll try to fix things right away.
- Show empathy. People want to be heard, and feel like the person at the other side of the conversation understands them.
- Be quick! According to Social Media Today, “users of Facebook pages expect to be responded to within 24 hours and Twitter users within two hours.”
Use a friendly tone of voice
Every brand has it’s own voice – a way of communicating with the world. This brand can be many things. If you haven’t defined your brand voice, this post by the Buffer team is the perfect place to start; but Wilson, our social media expert, says that people want a genuine voice, and not a generic voice trying to sell your brand.
Simply put, people want to engage and have a conversation with people, not a brand. Let’s pause this for a moment, and take a look at these two tweets:
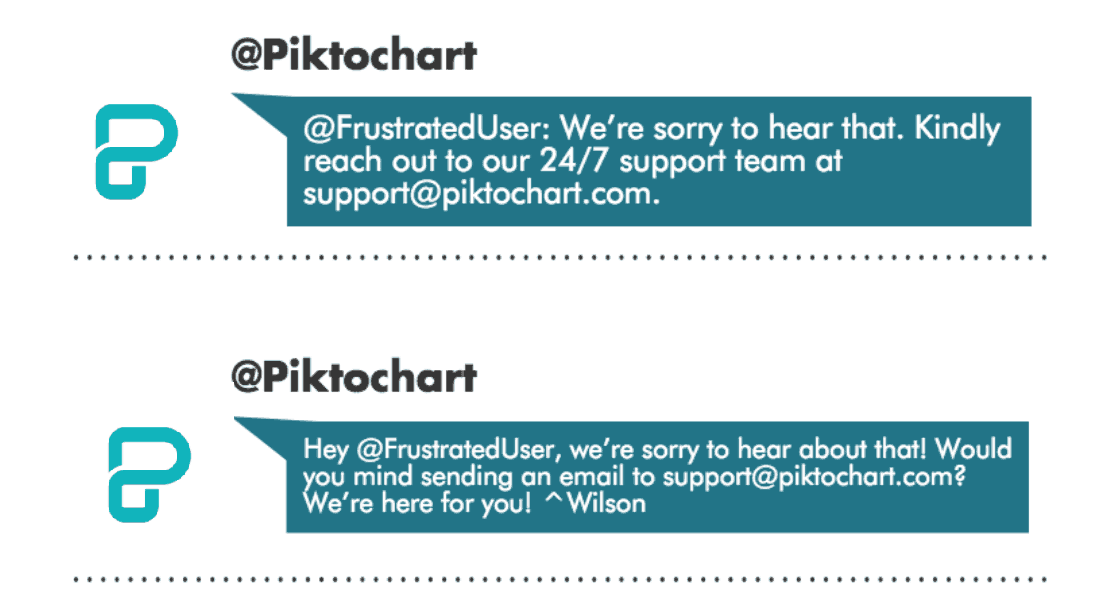
There is a big difference between these two tweets. The first one looks like American Airlines responding to their customers. The second is how we do it at Piktochart. There are a few things to note:
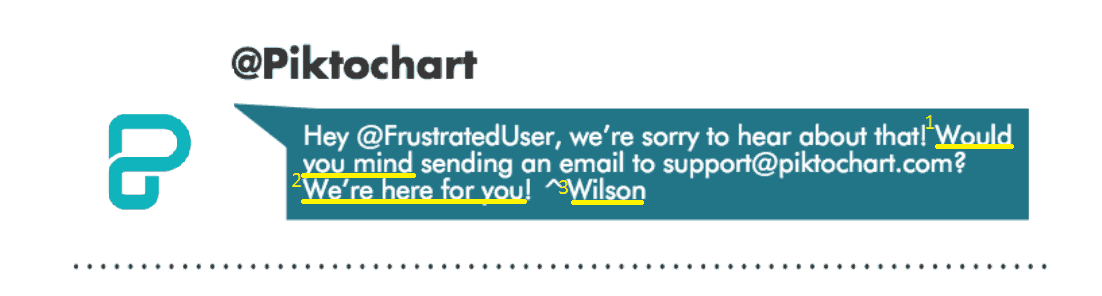
First, we kindly ask @frustrateduser if he would mind to contact support. That’s a whole different world than the over-used: “Please contact support from 9a to 5p EST.” Second, we show empathy by stating that we are here for them – in other words, we feel their pain, and want to help him fix it as soon as possible. Finally, we sign the tweet – as I mentioned above, people want to engage and have a conversation with people, not a brand.
Thanks for reading! If you have another way to share content with your audience, we’d love to hear about it. Simply post a comment below, and let’s get the conversation going!
Create viral content for your brand with Piktochart.
Select a template and customize every element to fit your requirements. Add or edit the icons, images, and charts. Use brand assets and fonts to personalize the template. Collaborate with your team to work on the visual project together. Export in PDF or PNG.


