
Your boss asks for a report by Friday. You nod, open a blank document, and realize you have no idea how to write a report for work in a way anyone will read past the first paragraph.
You are not alone. Workplace reports are one of the most common professional deliverables, and one of the least taught. From weekly progress updates to end-of-year performance summaries, every organization runs on written reports. The difference between a report people skim and one people act on comes down to structure, clarity, and knowing your audience.
For a related read, see our guide on how to generate reports your clients will actually read.
This guide gives you a step-by-step process for writing any type of work report. It includes real-world examples of three common report formats, plus free report templates you can edit in Piktochart right away.
A report is a fact-based document that presents information, findings, and analysis on a specific topic or issue, often to inform or recommend actions.
In fact, reports come in all shapes and sizes, and the type of report you write will depend on your specific goals and audience. Each type of report has its unique purpose, format, and style.
Before you start prep work for your report, identify the purpose of your report.
The most common types of reports are:
- Academic report – These include school reports, book reports, thesis reports, or analytical reports between two opposing ideas.
- Business report – Business reports range from annual reports to SWOT analyses. The goal of business reports is to communicate ideas, information, or insights in a business setting.
- Research report – Research reports are often more scientific or methodological in nature. They can take the form of case studies or research papers.
You can also jump right into creating a report using the template below. Customize each element to suit your purpose for a professionally-designed report in minutes.

3 Work Report Examples With Ready-to-Use Outlines
A good work report answers three questions: What happened? Why does it matter? What should we do next? The format changes depending on the report type, but the logic stays the same.
Here are three examples you can adapt for your own workplace.
Example 1: Weekly Progress Report
Who writes it: Individual contributors, new hires, remote team members.
Typical length: 1 page (300-500 words or bullet-point format).
Frequency: Sent every Friday or Monday.
Outline:
- Header: Your name, department, date range (e.g., “March 17-21, 2026”)
- Summary line: One sentence on overall progress. (“On track to finish onboarding documentation by March 28.”)
- Completed work: Bullet-point list of finished tasks. Lead each bullet with a strong verb: “Drafted,” “Shipped,” “Reviewed.”
- Work in progress: Active items with estimated completion dates.
- Roadblocks: Anything slowing you down, with a proposed solution or request for help.
- Upcoming focus: Your top two priorities for next week.
Tip: Keep each bullet to one line. If a manager can read your progress report in under two minutes, you have written it well.
Example 2: Project Status Report
Who writes it: Project managers, team leads, consultants.
Typical length: 2-4 pages, often with charts or visual status indicators.
Frequency: Biweekly or monthly.
Outline:
- Project name, date, and status indicator (Green / Amber / Red)
- Executive summary: 2-3 sentences on project health and key developments.
- Key milestones: A table listing each milestone, its target date, actual completion date, and status.
- Budget snapshot: Planned vs. actual spend, with a brief note on any variance above 10%.
- Risk register: Top 3 risks ranked by likelihood and impact, with mitigation steps.
- Decisions needed: Any approvals or direction the reader needs to provide.
- Next reporting period goals: What the team aims to deliver before the next report.
Adding a visual timeline or status chart makes this report easier to scan at a glance. You can build one quickly with an infographic report tool.
Example 3: Incident Report
Who writes it: Safety officers, HR staff, IT administrators, operations teams.
Typical length: 1-3 pages plus attachments.
Frequency: As needed (within 24-48 hours of the incident).
Outline:
- Incident ID and classification (safety, security, operational, customer-facing)
- Date, time, location: Be precise. “March 12, 2026, 2:15 PM, Warehouse B, Aisle 7” is better than “Last Tuesday in the warehouse.”
- People involved: Names and roles of those affected, witnesses, and first responders.
- Factual narrative: Describe what happened in chronological order, using third person. (“At 2:15 PM, a forklift operator reported a hydraulic fluid leak.”)
- Immediate response: What the team did right away.
- Contributing factors: Preliminary analysis of what caused or contributed to the incident.
- Corrective actions: Specific steps with owners and deadlines. (“Maintenance team to inspect hydraulic lines on units #4-8 by March 15.”)
- Supporting evidence: Attach photos, log files, or witness statements.
Keep opinion out of incident reports. Stick to facts, times, and actions. The document may be reviewed by legal or regulatory teams, so accuracy matters more than narrative flair.
No matter which report type you write, the structure stays consistent: context up front, evidence in the middle, actions at the end. For pre-built layouts, explore Piktochart’s report templates and customize them with your own data.
You might also find our article on report design ideas tips useful.
How to write a report without feeling overwhelmed
Breaking down the report writing process into three stages can make it much more manageable for you, especially if it’s your first time creating one.
These three stages are:
- Pre-writing stage
- Writing stage
- Post-writing stage
Effective report writing involves making your report easy to follow and digest. Let’s look at the steps for each stage and how to write a good report in 2025 that you can be proud of.
Stage 1: Pre-writing
The pre-writing stage is all about preparation. Allow your stream of consciousness a free-flowing ideating session. Take some time to gather your thoughts and organize your main idea.
Understand the purpose of your report
Knowing your purpose will help you focus and stay on track throughout the process. Dig into the why of your report through these questions:
- Who is your intended reader? Are you familiar with your audience’s language and how they think?
- What are you trying to achieve with your report? Are you trying to inform, persuade, or recommend a course of action to the reader?
Research your topic
It’s time to gather as much information as you can about your topic. This might involve reading books, articles, and other reports. You might also need to conduct interviews with subject matter experts.
Pro tip on how to write a report: Pick reputable sources like research papers, recently published books, and case studies by trustworthy authors.
Make a report outline
An outline is a roadmap for your report. It covers your title, introduction, thesis statement, main points, and conclusion. The main points of your report can include a summary, arguments and counter-arguments, statistical analysis and data visualizations, data interpretation, limitations, and implications.
Organizing your thoughts this way will help you keep focus and ensure you cover all the necessary information.
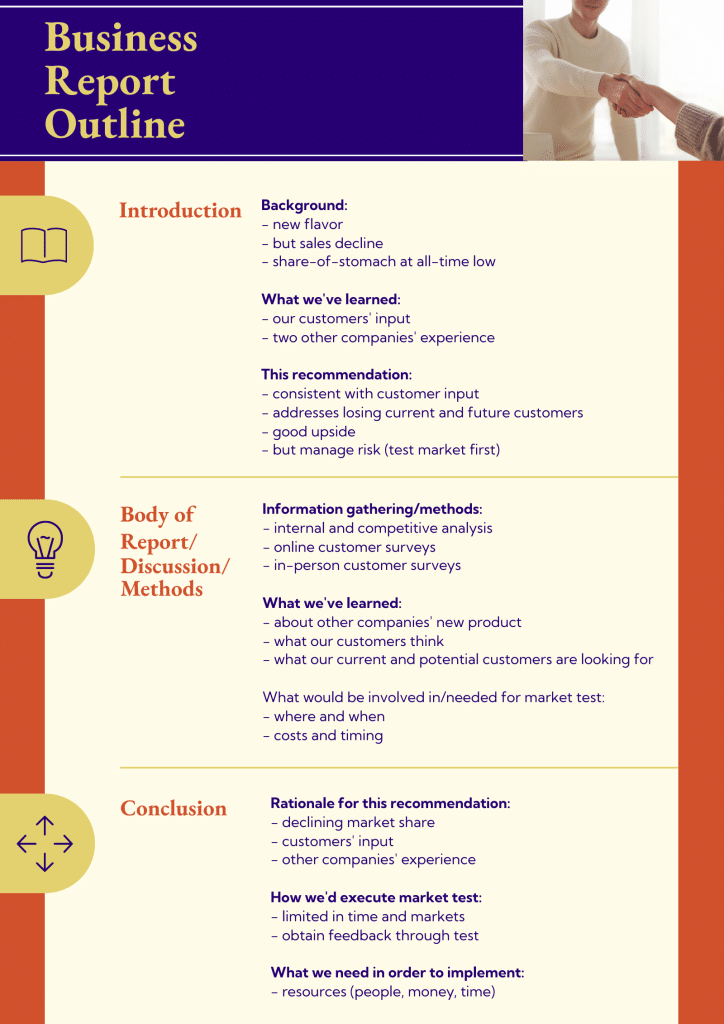
While you can create a report without creating an outline, you could write a better report with an outline. An outline helps you write a comprehensive and thorough report, ensuring you will not miss any important detail!
Stage 2: Writing
Once you have completed the pre-writing stage, it’s time to assemble your report in the correct format.
Follow the right report structure
You will feel a lot of resistance at this point because this is where most of the tedious work of report writing happens. However, the process can be a breeze if you follow a proper structure and report writing format.
Your report structure and format can vary depending on the type of report you’re creating, but the structure of a report typically includes:
What to include in your report
- Title page. The first page of your report should include the report’s title, the author’s name, the date of presentation or submission, and any other relevant information, such as your name or the organization’s name.
- Table of Contents (TOC). This section contains subsections of your report and their corresponding page numbering. A well-written TOC will help readers navigate your report easily and find the information they need.
- Brief summary. An overview of the report’s particular purpose, subject, methodology, key findings, and recommendations. This section is often called the executive summary in corporate reports.
- Introduction. The introduction should provide background information about the topic and explain why the report was written. It should also state the aims and objectives of your report and give an overview of the methodology used to gather and analyze the data. Make sure you include a powerful topic sentence. If you’re presenting some research, this is where you would write a thesis statement.
- Main body. The main body of the report should be divided into subsections, each dealing with a specific aspect of the topic. These sections should be clearly labeled and organized in a logical order. In most reports, this is also the part where you explain and present your findings, analysis, and recommendations.
- Conclusion. Summarize the main points of your report and provide a final summary, thought, or suggestions. Review your thesis statement and include recommendations for future research or what actions should be taken. The conclusion also includes any limitations of the study and areas for further research or future action.
- References. Also known as a bibliography, this is a list of all the sources cited in the report, like books, journal articles, websites, and any other sources used to gather information on your subject.
- Appendices. Include any additional information relevant to the report but not in the article’s main body. This might consist of raw data, event details, graphs, charts, or tables.
With all these key report elements, your readers can look forward to an informative, well-organized, and easy-to-read report.
Pro tips: Remember to use the active voice when you can because it helps improve clarity. To write a report essay in a passive voice makes it sound less concise.
Reports should usually be written in the third person.
Edit and proofread the article
Once you have completed your first essay draft, take some time to edit and proofread your work. Look for spelling mistakes and grammar errors, as well as any areas where the flow of your article could be improved. Review your topic sentence.
If hiring a professional editor isn’t possible, have a colleague or someone else read your rough draft and provide feedback. You can also use tools like Grammarly and the Hemingway App.
Stage 3: Post-writing
You’re almost there! This stage is about finalizing your report and ensuring it is ready to be shared.
Format your report
Ensure your report is formatted correctly, with clear and easy-to-read fonts, headings, and subheadings.
Incorporate visuals
Adding visuals to your report article is another great way to help your audience understand complex information more easily.
From charts to illustrations, the right visual can help highlight and explain key points, events, trends, and patterns in your data, making it easier for the reader to interpret the information.

Want to check out more templates? Get access to the template gallery today.
However, it’s important to use visuals sparingly and ensure they are relevant and effectively support the texts. You will learn more about effectively incorporating visuals into your report as you scroll down below to the next sections.
Share your report
Once your report is complete, share it with your audience. This might involve submitting it to your boss, presenting it to a group, or sharing it online.
A final note for this section: Remember to take your time, stay organized, and most importantly, have fun! Writing a report can be a rewarding experience, especially if you get positive feedback when you present.
How to incorporate data visualization in your report
Adding visuals to your report is more than just putting a graph or chart for every piece of information. After all, the purpose of a report is to effectively communicate information and insights, and visuals should strategically enhance that communication, not just decorate it.
There are no hard and fast rules, but use the pointers below as guidelines:
- Each visual in your report should have a purpose. Don’t just add a pie chart or bar graph for the sake of adding one. Your visual of choice should offer clarity to readers that’s impossible to achieve with words alone. Piktochart’s report maker lets you search for free stock images and illustrations to add to any page with drag and drop.
- Add captions, legends, or arrows to your visuals when possible. For more technical reports, graphics are either Tables or Figures. Number them in order of appearance (Figure 1, Figure 2, Table 1, etc.) and give each a descriptive title.
- Place the visual close to the relevant text on the page.
- Document the source of the visual, citing it in both the caption and references section if necessary.
- Make the graphic stand out with colors, borders, boxes, spacing, and frames.
Write reports like a pro with Piktochart’s easy-to-edit report templates
Creating reports from scratch can be time-consuming. The great news is you don’t have to make reports from scratch like how it used to be in the 90s and early 2000s. Organizations of all shapes and sizes now understand that you can also create the perfect report with the help of templates.
For example, Piktochart offers a variety of fully customizable templates, allowing you to easily add your branding, colors, and text within the online editor. You can visualize your thesis statement and first draft in less than an hour. It’s also possible to start writing directly in the tool, adding graphics page by page.
These templates range from reports for school presentations to sales reports. By editing them, you can create professional-looking reports without the hassle of formatting and design.
Here are some examples of Piktochart’s professionally-designed templates. If you can’t pick one that matches your report writing format and needs, create a free Piktochart account to get access to more templates.
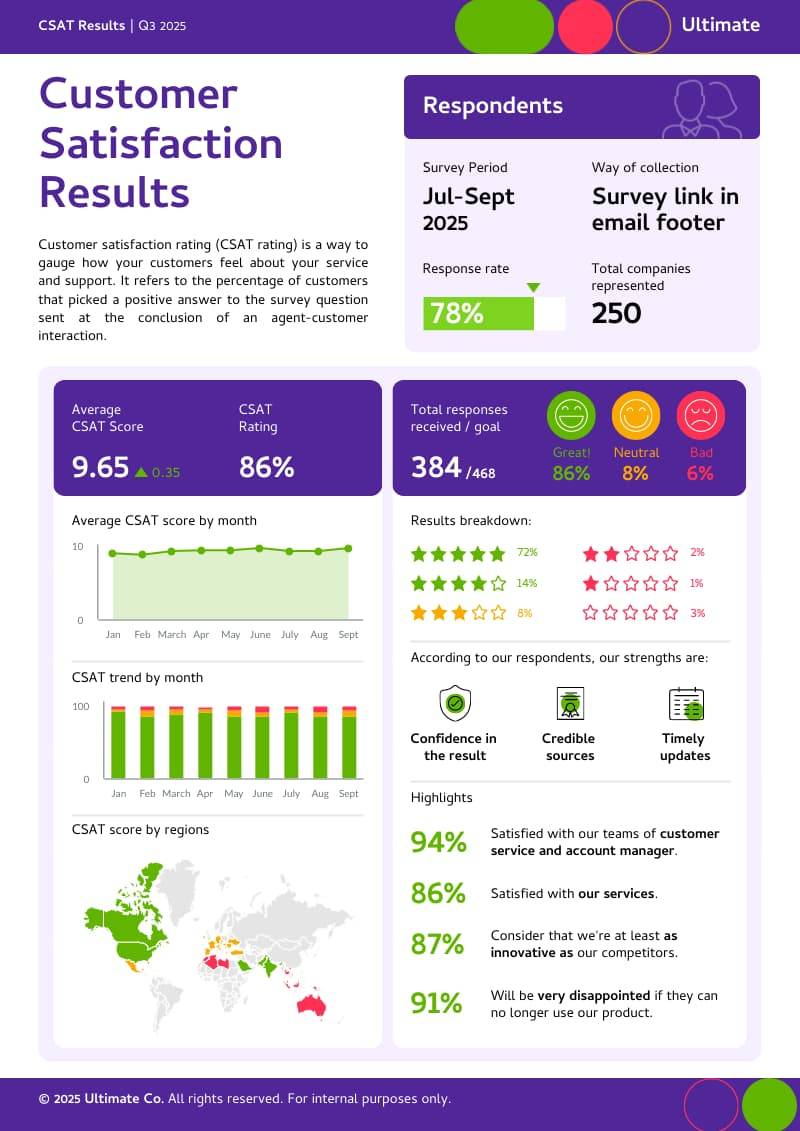
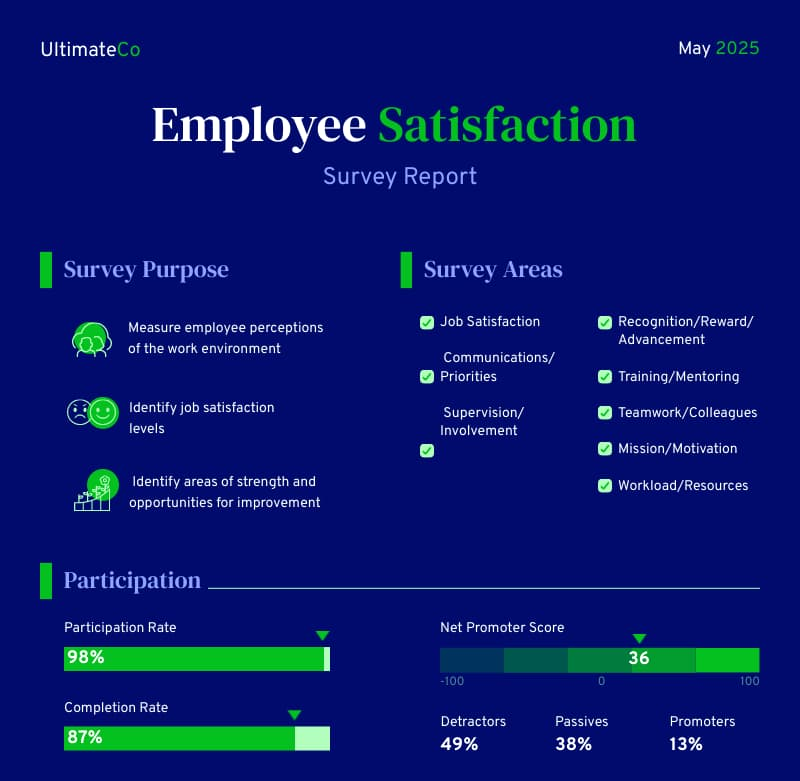
Survey report template
This survey report template includes clear visualizations, making your report findings easier to understand. From customer surveys to employee satisfaction reports, this template is quite versatile.
Employee Satisfaction Report
Research report template
This research report template is perfect for anyone looking to create a thorough and professional research report. The template includes all the necessary sections to help you easily organize your research and present your findings in a concise document.
Client Research Report

Corporate report template
Looking for a corporate report template example with an editable table of contents and foreword? This template is the perfect fit!
Whether you’re presenting to investors or sharing information with your team, this corporate report template will help you create a polished and informative executive summary for any corporate organization.
Corporate Sustainability Report

Case study report template
Whether you’re conducting a business case study or an academic case study, this case study report template can help you earn your readers’ trust. This template is specifically designed with fashion as its main theme, but you can edit the photos and details to make it more on-brand with your niche.
Fashion Case Study

Marketing report template
Use this template to create comprehensive marketing reports. The template includes editable sections for social media, data from search engines, email marketing, and paid ads.
Monthly Marketing Report

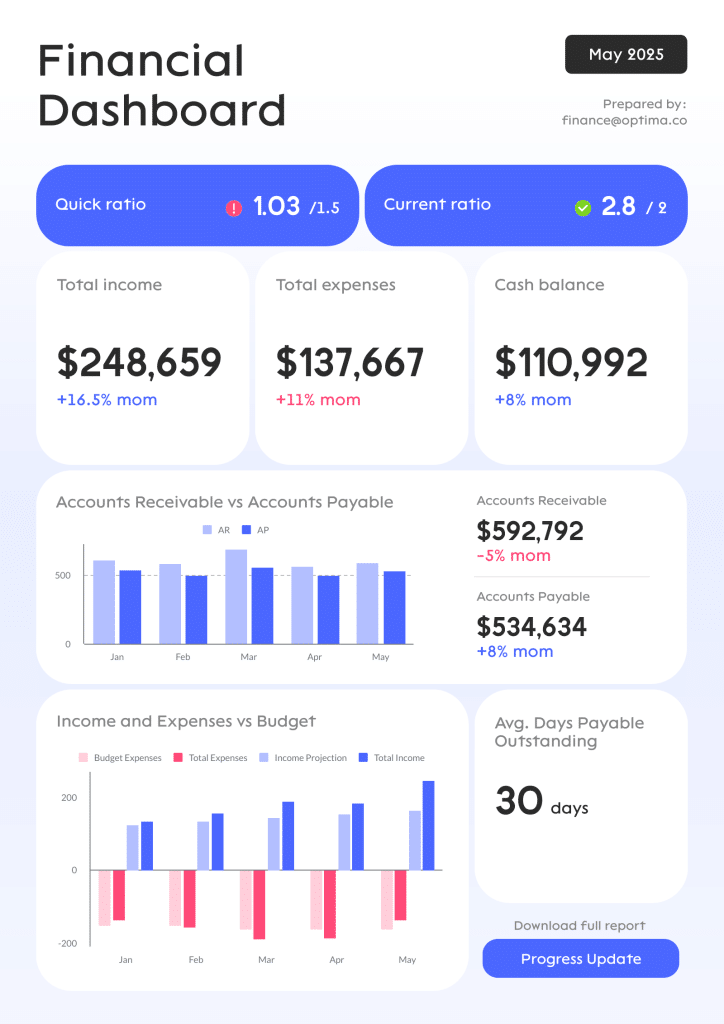
Financial report template
With this customizable finance report template, you don’t need to make a financial report from scratch. Once you’ve written your content, save your report in PDF or PNG formats.
Financial Analysis Report
Annual report template
This annual report template is the right template for creating a professional and informative executive summary of your organization’s performance over the past year. This template was designed for HR annual reports, but you can also repurpose it for other types of yearly reports.
Annual Review

See more report templates by creating a free Piktochart account.
Quick checklist for better report writing
Before you submit or present your report, use the quick checklist below to help ensure that your report is well-structured, accurate, clear, and properly cited. Most of all, you must ensure that your report meets your audience’s expectations and has all the information and details they need.
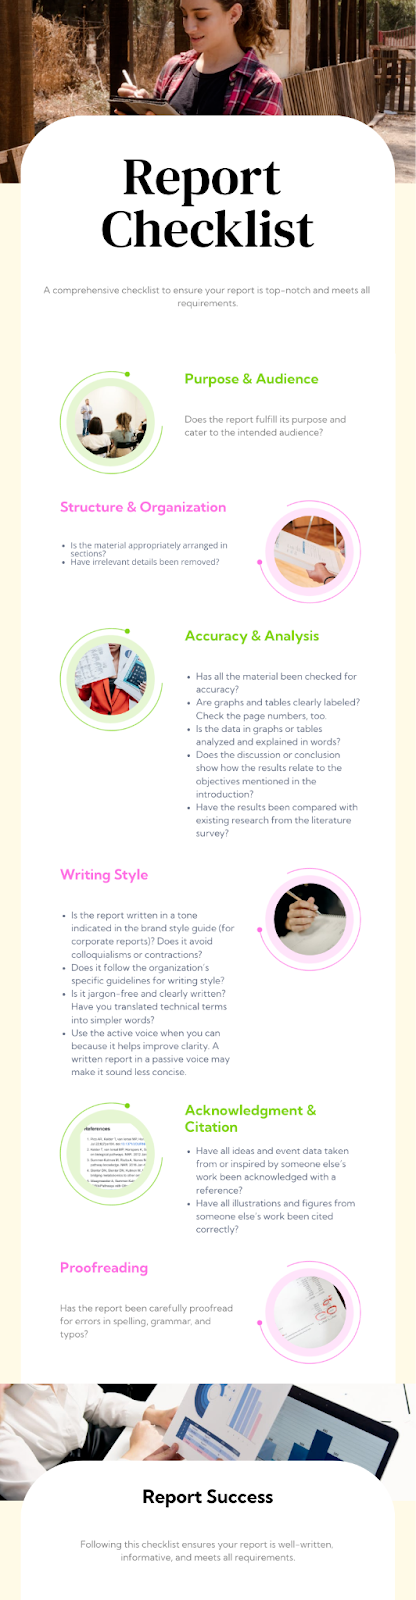
Purpose and audience
- Does the report address its purpose and meet the needs of the intended audience?
Structure and organization
- Is the material appropriately arranged in sections?
- Have irrelevant details been removed?
Accuracy and analysis
- Has all the material been checked for accuracy?
- Are graphs and tables clearly labeled? Check the page numbers, too.
- Is the data in graphs or tables analyzed and explained in words?
- Does the discussion or conclusion show how the results relate to the objectives mentioned in the introduction?
- Have the results been compared with existing research from the literature survey?
Writing style and clarity
- Is the report written in a tone indicated in the brand style guide (for corporate reports)? Does it avoid colloquialisms or contractions? Will the people who read the report easily understand it?
- Does it follow the organization’s specific guidelines for writing style?
- Is it jargon-free and clearly written? Have you translated technical terms into simpler words?
- Use the active voice when you can because it helps improve clarity. A written report in a passive voice may make it sound less concise.
Acknowledgment and citation
- Have all ideas and event data taken from or inspired by someone else’s work been acknowledged with a reference?
- Have all illustrations and figures from someone else’s work been cited correctly?
Proofreading
- Has the report been carefully proofread for typos, spelling, and grammatical mistakes?
Make engaging and effective reports quickly with Piktochart
Writing a report is a must-have skill for anyone looking to communicate more effectively in their personal and professional lives.
With the steps we’ve provided in this guide, anyone can learn how to write a report that is informative, engaging, and comprehensive.
Plus, the free templates we highlighted are valuable for individuals looking to create reports quickly and efficiently. They can also be used to transform a longer report filled with texts into something more engaging and easy to digest.
Sign up for a free Piktochart account today, and look forward to writing reports with its library of modern, customizable report templates.
Piktochart offers professionally designed templates for all your visual communication needs. It is your one-stop shop for presentations, posters, logos, email signatures, infographics, and more. Customize all templates according to your brand assets in seconds. Get started for free today.
Frequently Asked Questions On How To Write A Report
How long does it take to write and finish a report?
The time a report can take to complete varies significantly based on several factors. For shorter documents, you might finish in a few hours, while comprehensive reports with extensive research could span several weeks. The main theme of your report and its complexity will largely determine the timeline.
To help you craft an efficient timeline:
- Simple project updates: 2-4 hours
- Academic assignments: 1-7 days
- Feasibility reports: 1-3 weeks
- Market research reports: 2-4 weeks
Remember that a report is a written document that requires proper planning. Try to pick a topic that matches your timeline constraints. The introduction sets the tone, but the rest of your report demands equal attention—from gathering data or information to thorough proofreading for spelling errors.
Consider these stages when planning:
- Understanding assignment requirements: 5-10% of total time
- Research and information gathering: 30-40%
- Drafting the report’s main sections: 20-30%
- Review your report and revisions: 15-20%
- Adding references or bibliography at the end: 5-10%
How to write a report for school
Writing a report for school requires attention to specific requirements provided by your instructor. Since a report is a written document that presents information in your report systematically, follow these steps to create an effective paper:
- Choose a topic that interests you if possible. The main theme of your report should align with your assignment requirements.
- Create an introduction that outlines the purpose of your report. Your report’s first paragraph should clearly state the document’s purpose and scope.
- Present data in the body using clear sections with headings. I.e., tailor your content to include information that supports your topic and state your findings objectively.
- Use bullet points to highlight key information where appropriate.
- Add a bibliography at the end to give proper credit to your sources.
- Before submission, conduct a thorough proofreading to catch any spelling errors.
Remember that your introduction sets the stage, but the end of the report should provide closure through a summary of key findings. Related articles from your research may help you explore more aspects of your topic, ensuring your report is going to meet academic standards.
How to write a report for work
Professional reports help teams make informed decisions and may identify opportunities for improvement. When you need to create a work report, focus on clarity and actionable insights:
- Define purpose and scope: Clearly establish what your report is going to address. The report’s purpose should be evident in the introduction that outlines the main objectives.
- Structure strategically: Include the title, executive summary, introduction, methodology, findings, and conclusion. The rest of your report should flow logically from one section to the next.
- Present data visually: Charts, graphs, and bullet points help readers quickly grasp complex information in your report.
- Provide context: Explain why the information in your report matters. Project updates should connect to broader business goals.
- End with recommendations: Professional reports include actionable next steps. Your report may recommend specific actions based on findings.
Make sure to review your report for clarity before sharing. Remember that busy professionals may not read the entire document, so tailor your executive summary to include the main theme of your report concisely.
How to write a report paper
A well-crafted report paper presents information systematically and helps readers understand complex topics. To create an effective report paper:
- Analysis before writing: Understand the document’s purpose and who will read it. Try to pick a topic that allows you to present data meaningfully.
- Develop a structure: A report is a written document with distinct sections. The report’s first section should introduce your topic and state the report’s main focus.
- Research thoroughly: Gather relevant data or information from credible sources. Your bibliography at the end should include all references used.
- Write clearly: Use simple language and avoid jargon unless necessary. The rest of your report after the introduction should present findings objectively.
- Revise carefully: Review your report for logical flow and thorough proofreading for spelling errors is essential.
Feasibility reports, academic papers, and market research reports all follow similar principles but may have specific requirements. Related articles on research methodologies can help you craft a more robust paper that supports informed decisions.
How long is a report usually in length?
The length of a report varies significantly based on its purpose, audience, and complexity. A report is a written document that should be as long as necessary to cover the main theme of your report adequately—no more, no less.
Typical length guidelines:
- School/academic reports: 5-15 pages (1,500-4,500 words)
- Business briefs/project updates: 2-5 pages (500-1,500 words)
- Comprehensive research reports: 15-50+ pages (4,500-15,000+ words)
- Feasibility reports: 10-30 pages (3,000-9,000 words)
When you need to create a report, focus first on meeting the assignment requirements regarding length. The information in your report should be concise yet thorough. Many reports include an executive summary (usually 5-10% of total length) that highlights key findings.