Today’s boring annual reports have evolved into more engaging and visually-appealing forms of media (here’s looking at you, Girls Who Code team!).
However, it remains a challenge to keep readers engaged and to not have someone say “Oh, that’s a boring report.” These is usually a multi page document, a multi-month design project for many companies!
There’s also a time frame where companies have to get the annual report out to stakeholders usually within 3 months of the previous year ending (fiscal).
Girls who code annual report

Non profit annual report design
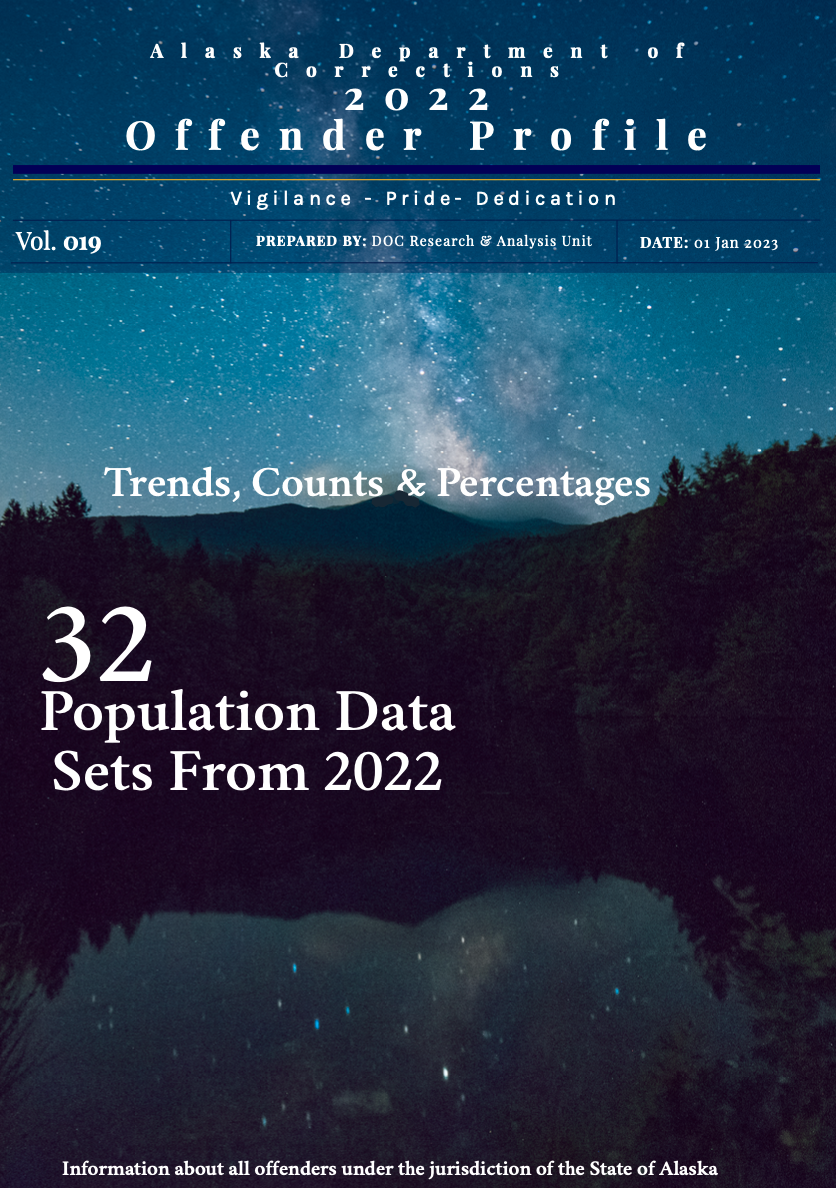
We are also going to give a shout out to the Alaska Department of Corrections for using Piktochart’s report maker to make their annual report designs. Check the full report here! You can also read about his process of using Piktochart’s annual report design templates and also for other design projects.
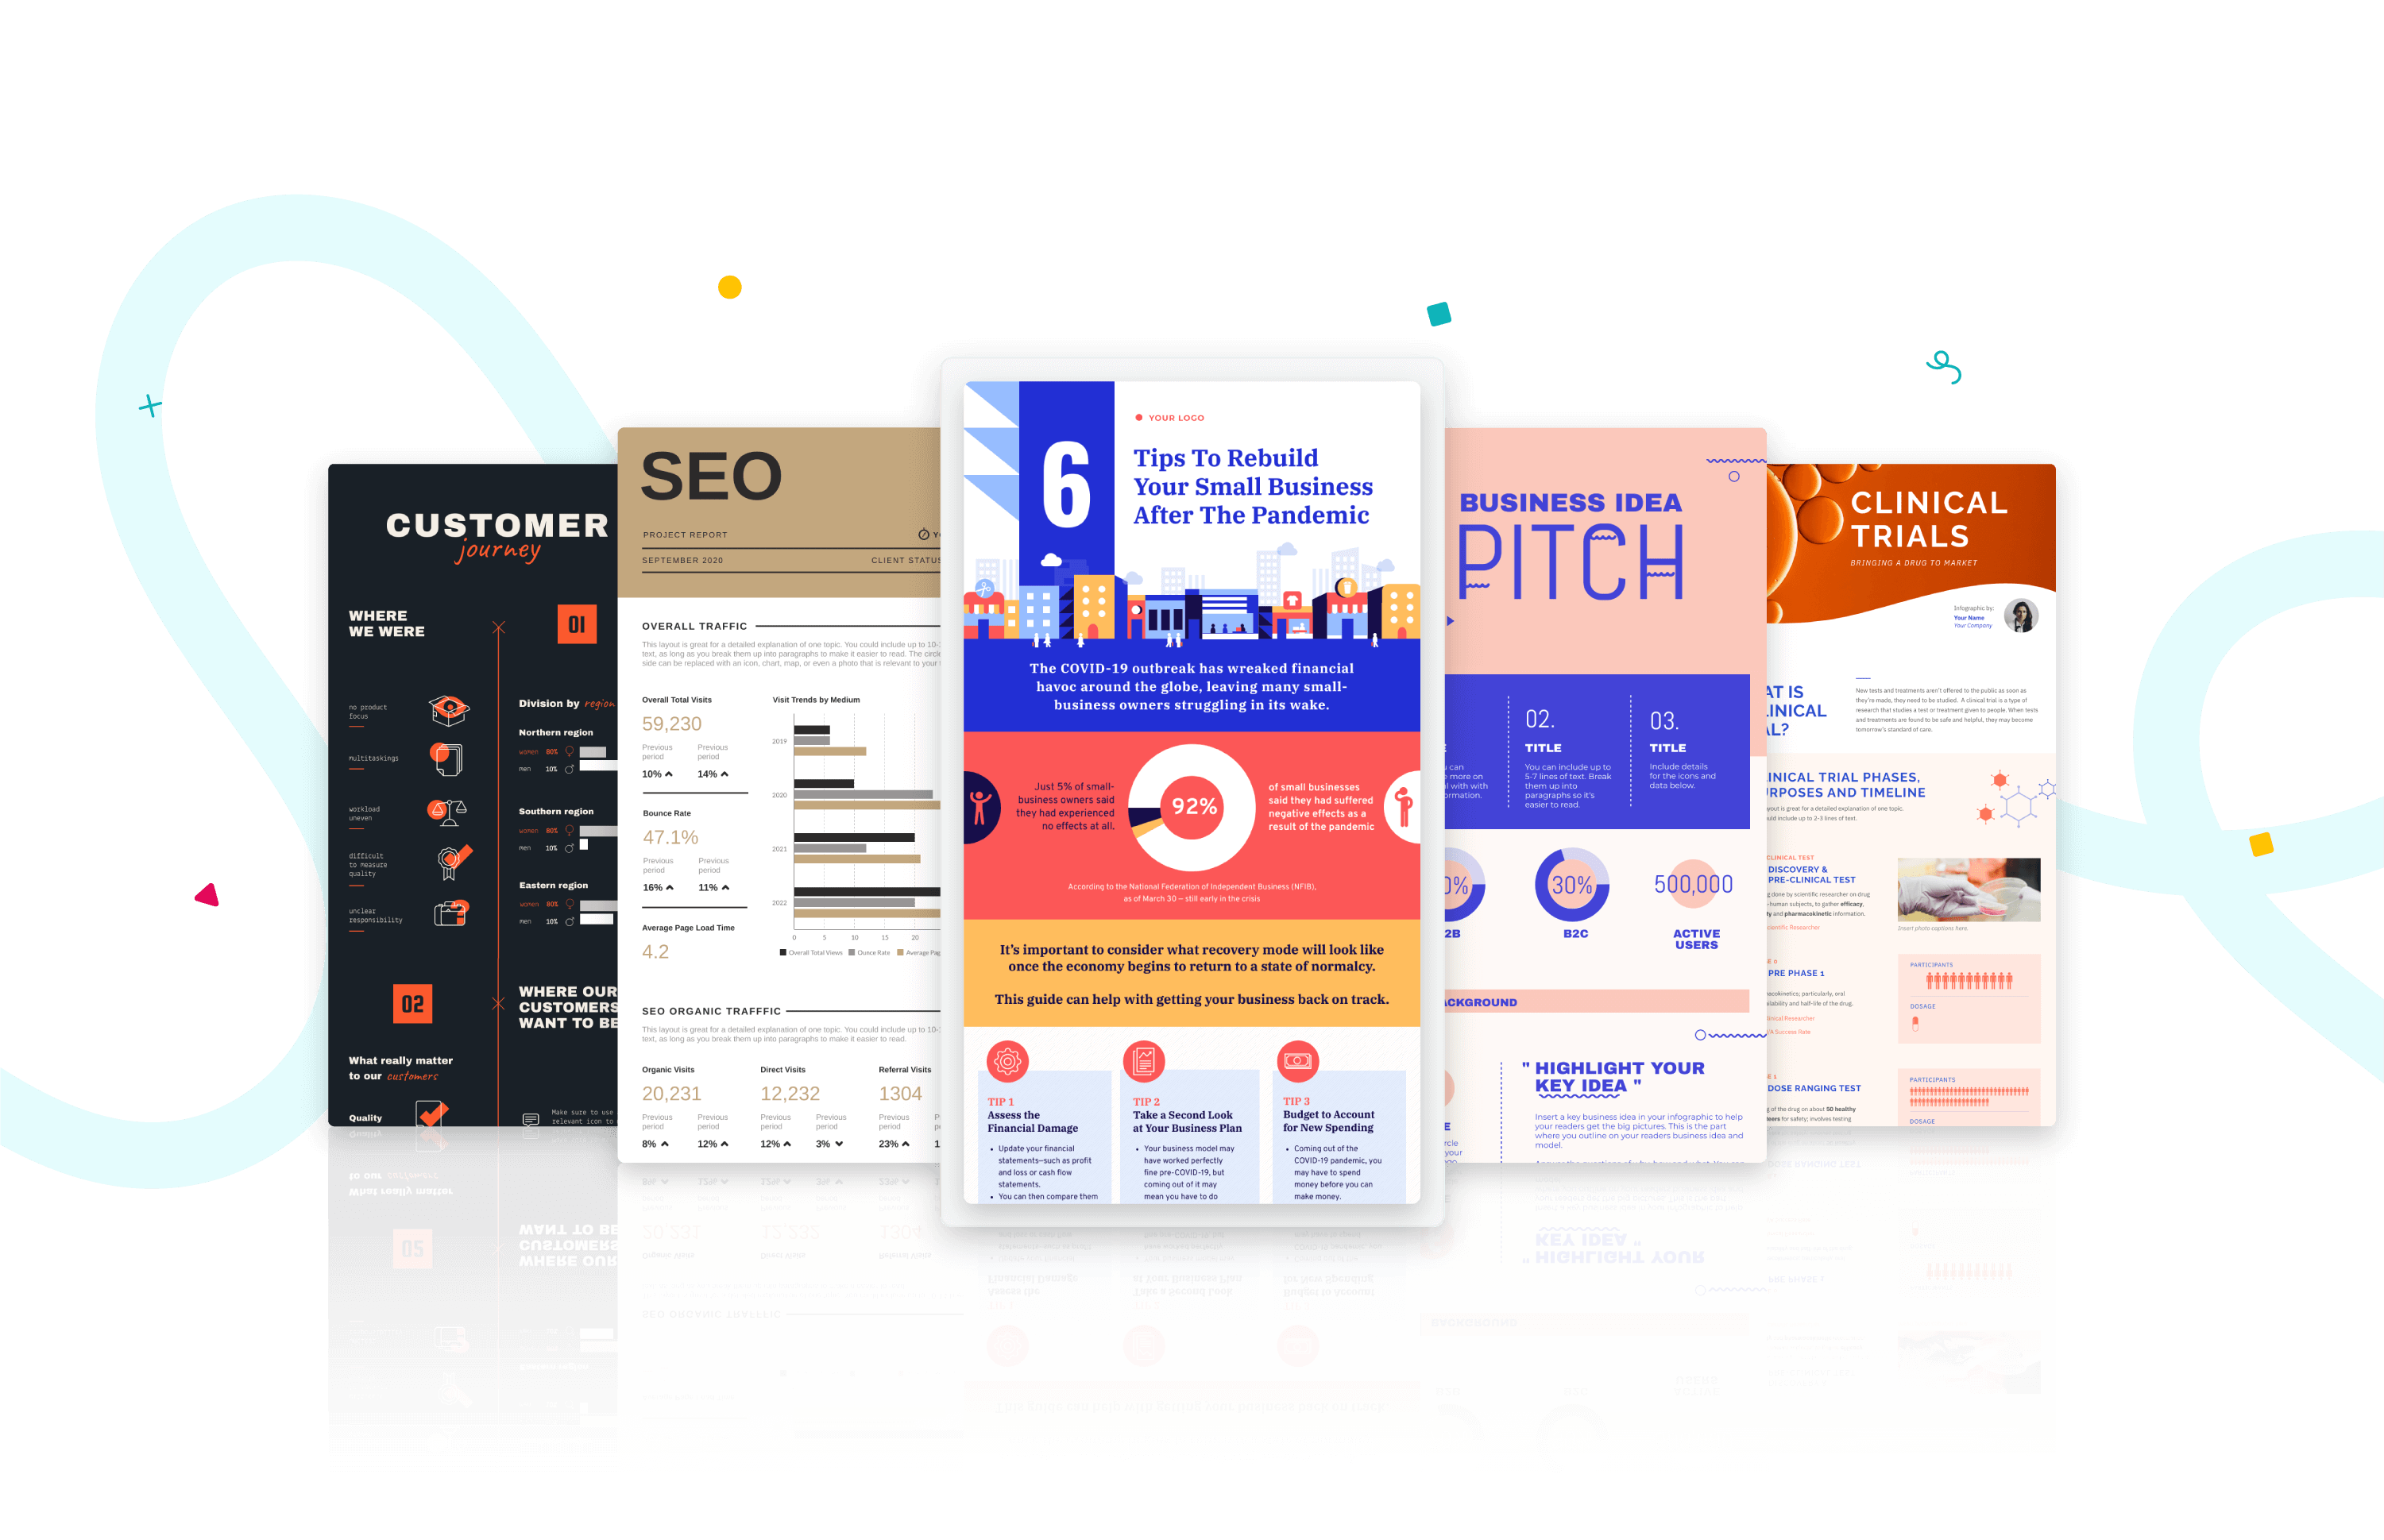
Whether you’re about to share your annual report to a team of 9 or present it to 90 team members around the world in your embedded finance organization, this annual report design inspiration guide will help you make sense of what are the best annual report designs and makes a good annual report.
Guide to annual report design: Ideas, templates, and best practices
Keep reading to:
- Find annual report examples from actual companies
- Learn how to make annual reports that clients will love to read, review, and share
- Watch a step-by-step video tutorial on annual report design from one of our designers
- Discover how you can effortlessly create visually stunning annual reports with a professional look through customizable annual report templates
What is an annual report?
An annual report is a corporate document distributed to company shareholders showcasing the organization’s financial state for the past year.
A typical annual report has the following components:
- Visuals and an accompanying story of the company for the past year
- Valuable information and key metrics about the previous year’s company’s finances and operations
- Forecast of the following year
In a nutshell, an annual report gives an overview of what your business has been up to for the last 12 months.
When planning for your annual report, think of the following audience groups:
- Primary audience: Existing shareholders, stakeholders, potential investors, employees
- Secondary audience: Suppliers, businesses, and organizations in the same industry or space
Annual report design templates you can edit and print
The concept behind annual report creation is simple — you share metrics and tell the story of your business or company’s operations for the past year.
But let’s be honest: most of us don’t read those traditional annual reports filled with MWOT (also known as a massive wall of text) and overwhelming data. An annual report format unfortunately is constrained by legal and statutory requirements, e.g. Form 10-K in the United States.
It’s either you don’t have the time or the cognitive load to process endless bits of information. Or maybe both.
The good news is you can visualize your annual reports (if you’re not bound by these legal requirements)!
We may be biased, but Piktochart is a business visual storytelling tool with some professional-looking, editable annual report design templates that you can edit and print. It comes with graphic design elements to capture visual interest from your target audience. No need to make your report from scratch!
Bonus benefit: you can download templates as a PDF in Piktochart, which is often the preferred format for annual reports.

You can download your annual report as a PDF in Piktochart
Create a free account so you can follow along for little inspiration as we feature the best annual report design templates below.
1. Modern annual report template
Want a more modern look to your annual report design?
This modern annual report template with simple design is the perfect choice. It has 8 pages filled with graphs, layouts, and typography that are easy on the eyes.

2. Creative annual report template
If you’re looking for a template with unique annual report design, this creative annual report template is filled with bright colors and bold geometric shapes to help you stand out from other reports in your industry.
The great thing about this template is you can customize it to your brand colors with just one click with Piktochart.
Not only that, with Piktochart PRO, you can use build a custom color kit for your account based on your brand guidelines.
3. HR annual report template
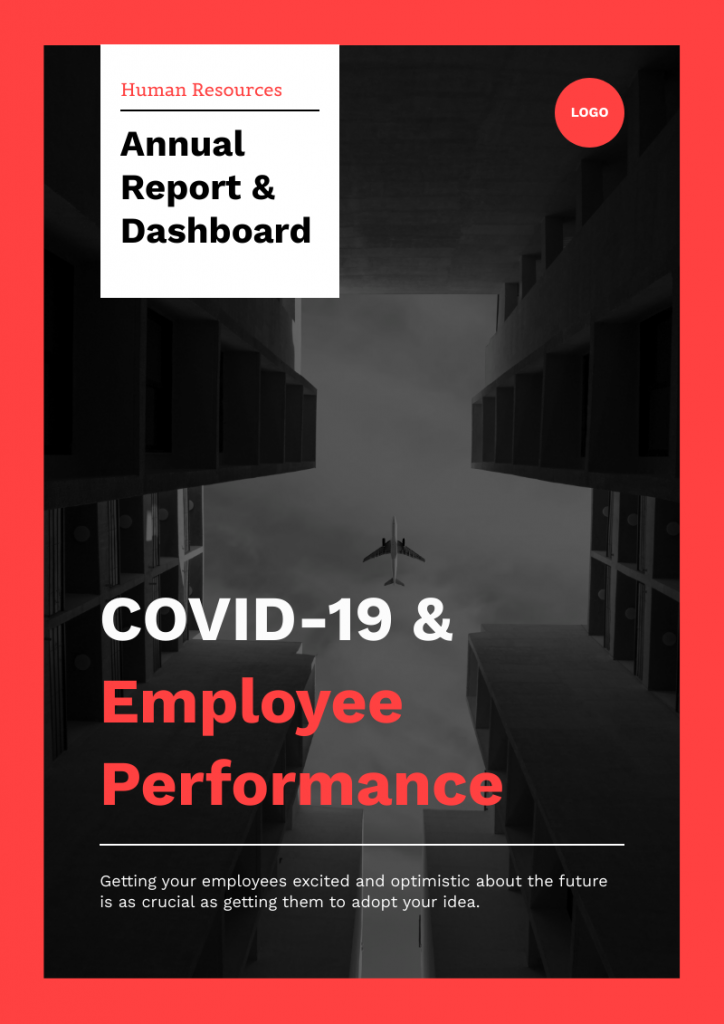
A good HR annual report highlights essential recruitment metrics like cost per hire, turnover rate, time to fill, and recruiting conversion rate. These annual report formats make sense especially for the human and workforce industries.
Use this black and red annual report template to share your HR data and turn your metrics into actionable tactics for the following year.
Not a fan of black and red? You can change this template’s colors and fonts quickly using Piktochart.
4. Business annual report template

Here’s what a business annual report layout typically looks like:
- Words from our CEO
- List of Directors
- Business Objectives and Overview of the Company
- Vision and Mission
- Products and Services
- Global Review
- Annual Statistics
- Summary
These sections, alongside pre-designed data widgets and icons, are built right in this annual report template.
5. Corporate annual report template

This 10-page annual report template is a cross between the modern and geometric templates we shared earlier. With this template, you can stay professional while looking more modern and hip at the same time!
6. Annual review template

Design an annual report that you and your team will be proud of with this annual report template of white, blue, and green colors.
This annual report comes with a world map, slick-looking graphs, and a visually striking page dedicated to corporate social responsibility.
7. Short annual report template
If you prefer a shorter annual report, this is the right template for you! This 5-page annual report template will help you share information more succinctly. These annual report templates are also ideal for organizations who want to cut to the chase and present the most critical details of their report.
8. One-page annual report template

Are one-page annual reports a thing? It sure is with this one-page annual report template.
The great thing about this template is it does well on the data visualization side with the customizable charts and graphs.
Bonus annual report infographic template
Here’s another one-page annual report example (it’s actually an infographic!) that you can use for end-of-year reviews and reports.

9. Marketing annual report template
Impress your shareholders and the rest of the team with this black, yellow, and white marketing annual report template.
This template is also versatile because you can also use it for monthly reports. All you need to do is edit the colors, change up the fonts, and you’re ready for a new, great-looking marketing report!
10. Team progress annual report template

Share your team member’s progress in such annual report design templates highlighting the progress of your team members — from roadblocks to team goal progress.
11. CSR annual report template

The CSR annual report template features a clean and modern design, incorporating vibrant colors, impactful visuals, and organized sections to effectively showcase a company’s corporate social responsibility initiatives and achievements.
12. Nonprofit annual report template

The food nonprofit annual report template showcases a warm and inviting design, highlighting impactful imagery, informative sections, and a focus on community engagement and the organization’s efforts to address food insecurity and promote nutrition.
You can easily tweak the report design to reflect your company’s mission and purpose!
13. Corporate annual report design
The corporate annual report design presents a professional and sophisticated layout, featuring a balance of concise text, elegant typography, and strategic use of visuals to effectively communicate the company’s financial performance, strategic goals, and overall achievements.
14. Monochrome annual report design
Did you know that annual report design can be black and white? Well now you do!
The monochrome annual report design template embraces a sleek and minimalist aesthetic, utilizing shades of black, white, and gray to create a sophisticated and timeless look that emphasizes clarity, simplicity, and elegance.
The 9 best annual report design from around the world (2022 examples)
#1. Warby Parker’s annual report is interactive, engaging, and uses a mix of graphics, images, and text to deliver a comprehensive overview of their year.

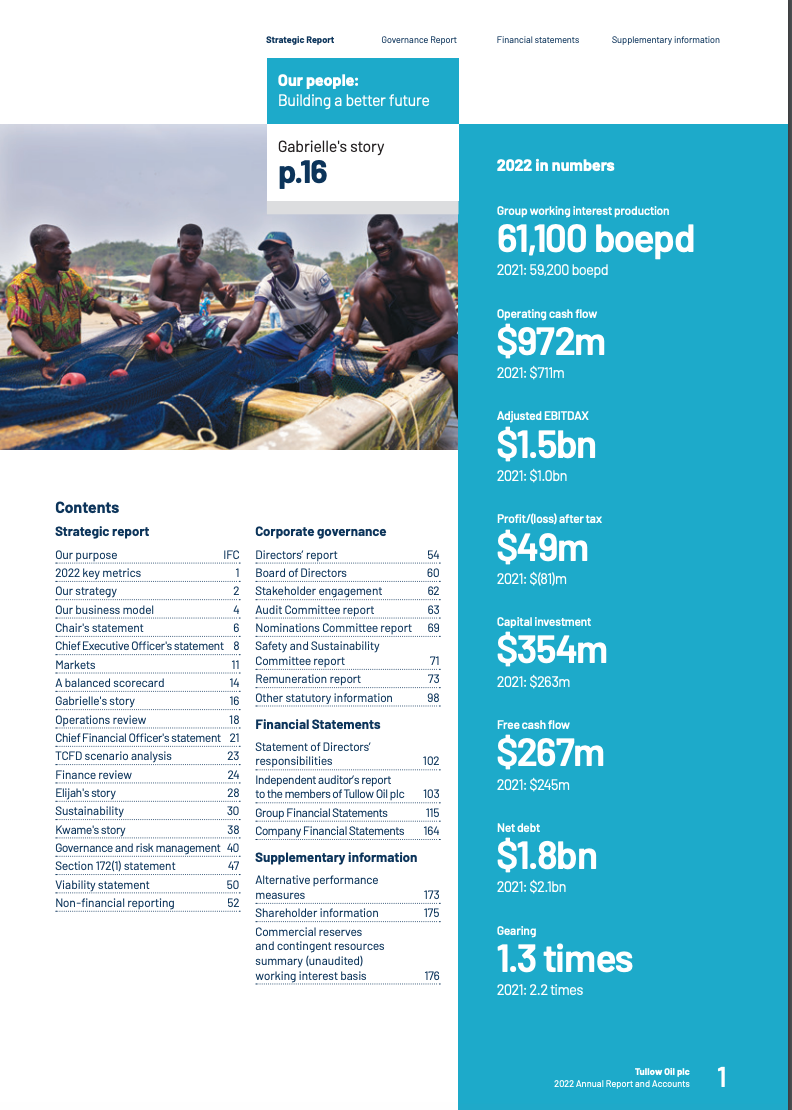
#2. Tullow Oil’sannual report is professional and clean, with a nice balance of text, visuals, and infographics. They provide a detailed and comprehensive look at the company’s financials.
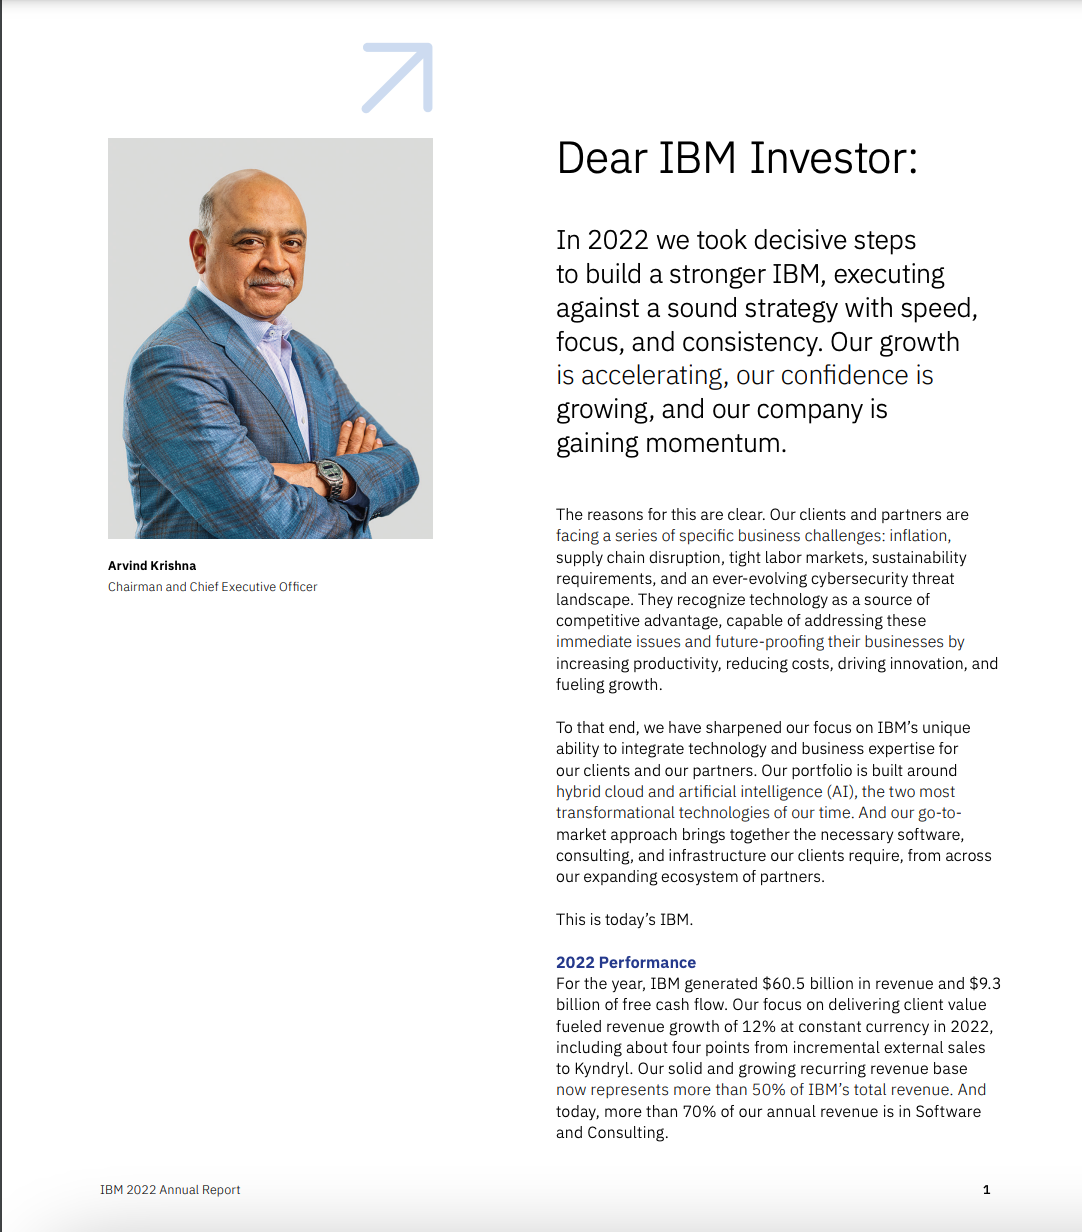
#3. IBM’s annual report is clean, modern, and packed with information. They use a mix of graphs, charts, and images to convey their data. Their shareholder letter presented business’s story in a concise manner.
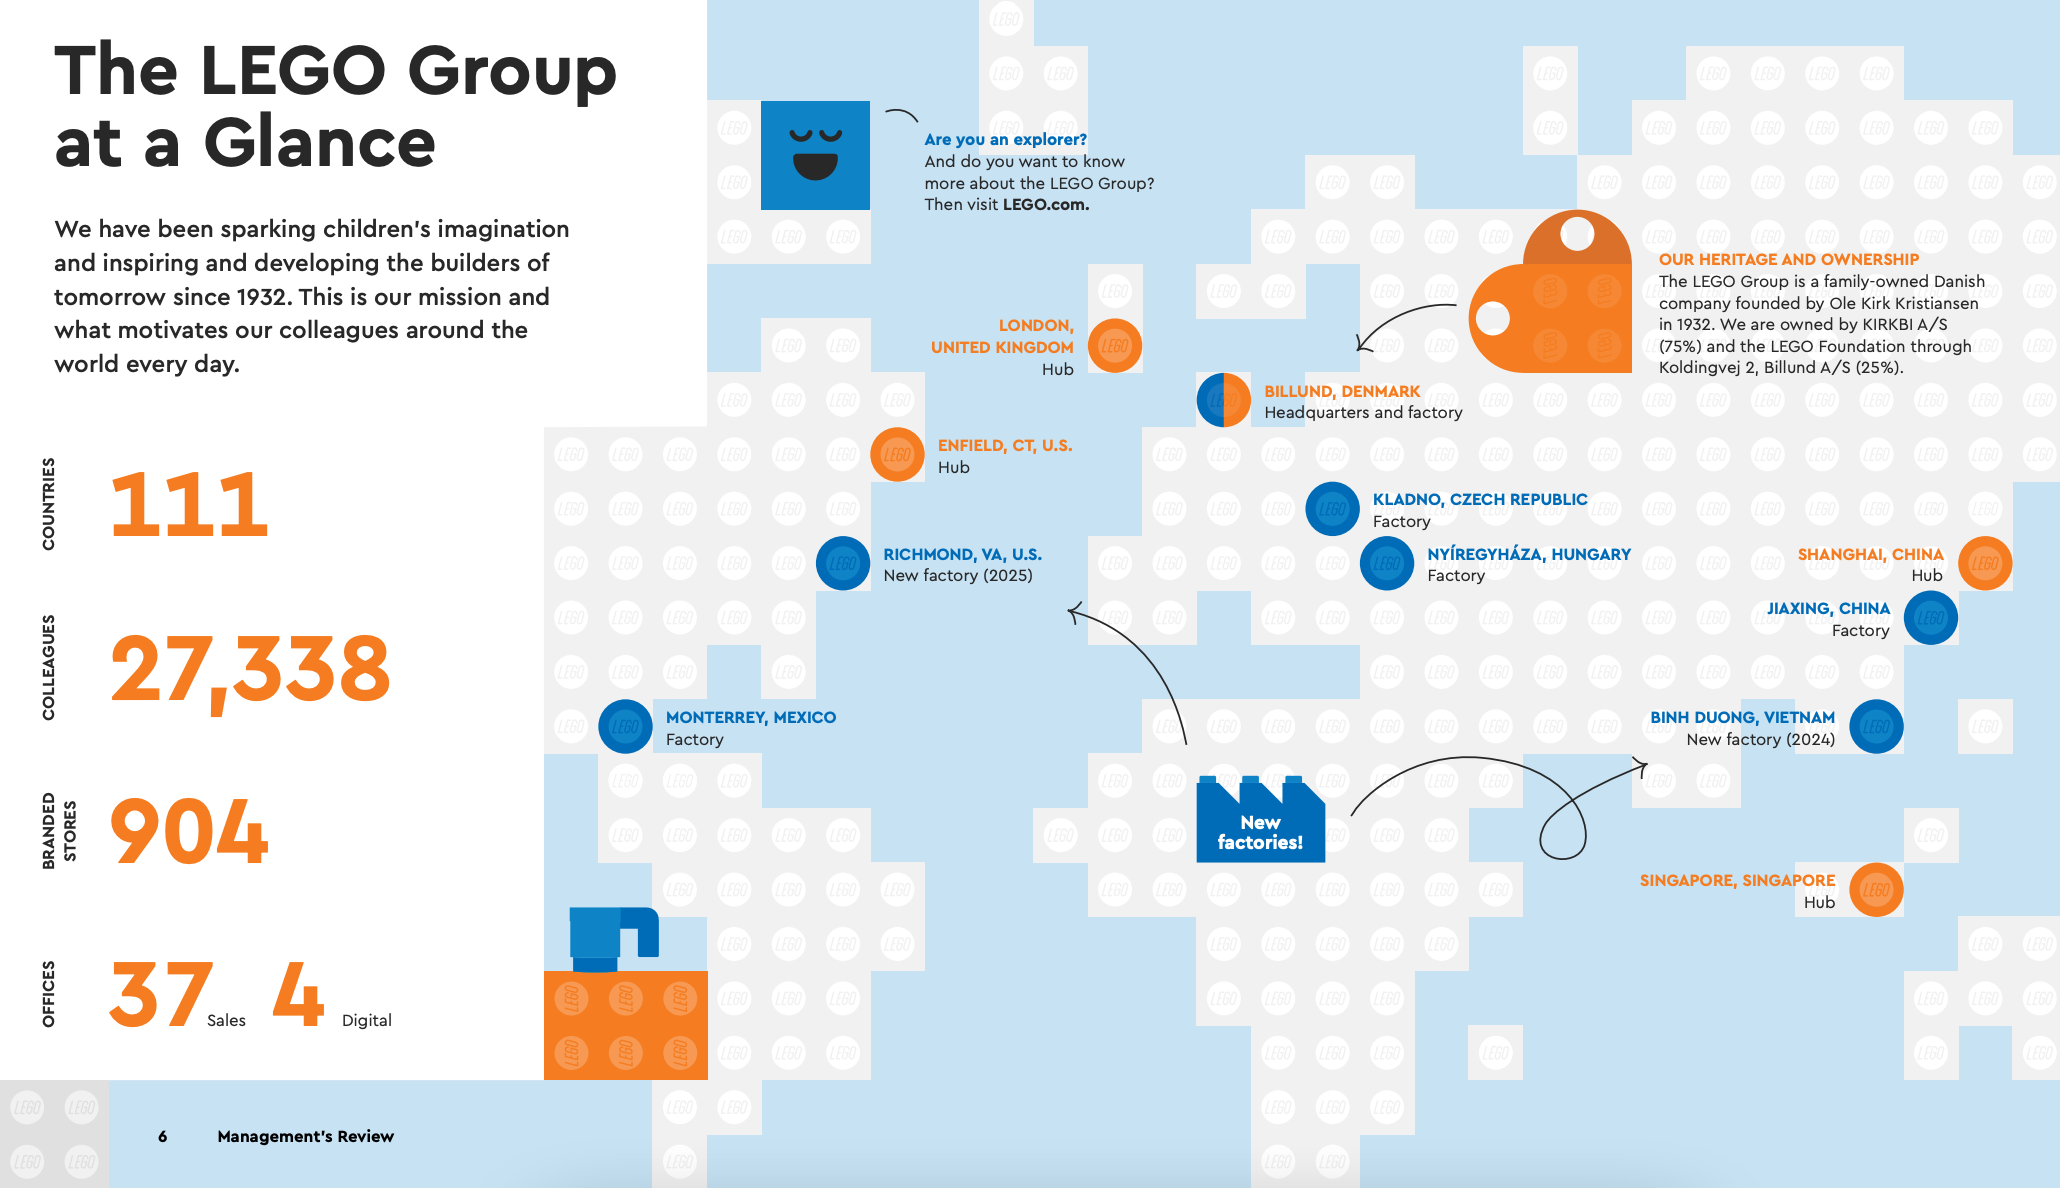
#4. Lego’s annual report is fun, colorful, and engaging. They use a lot of images and graphics to showcase their brand and products along with engaging annual report layouts. The entire annual report was so much fun to read, it’s one of the more creative annual report we have seen.
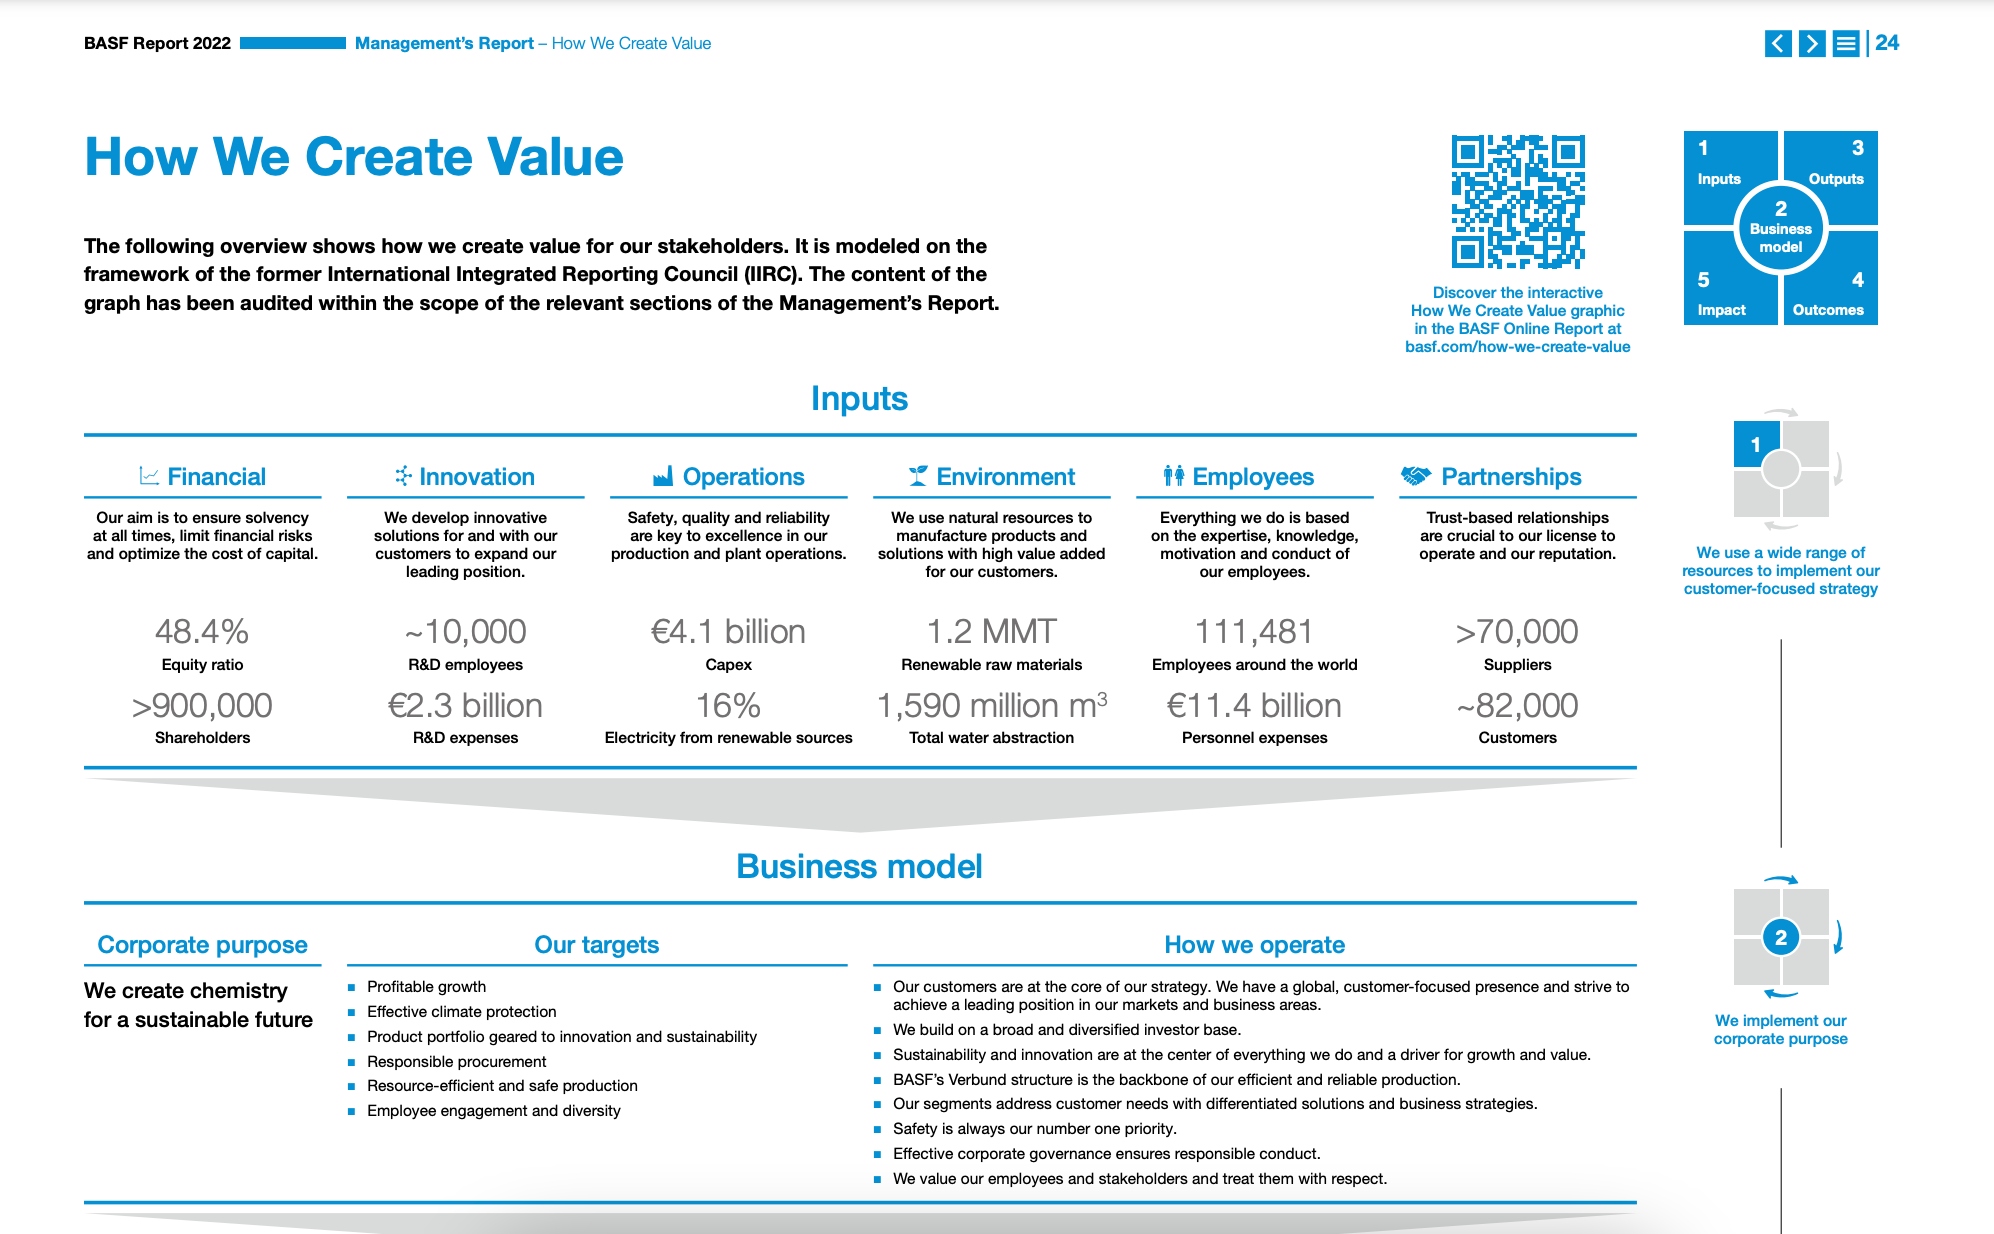
#5. BASF’s annual report is known for their clarity and detail (200+ pages!!). They are designed in a straightforward way, with a focus on delivering clear and concise information coupled with good data visualizations.
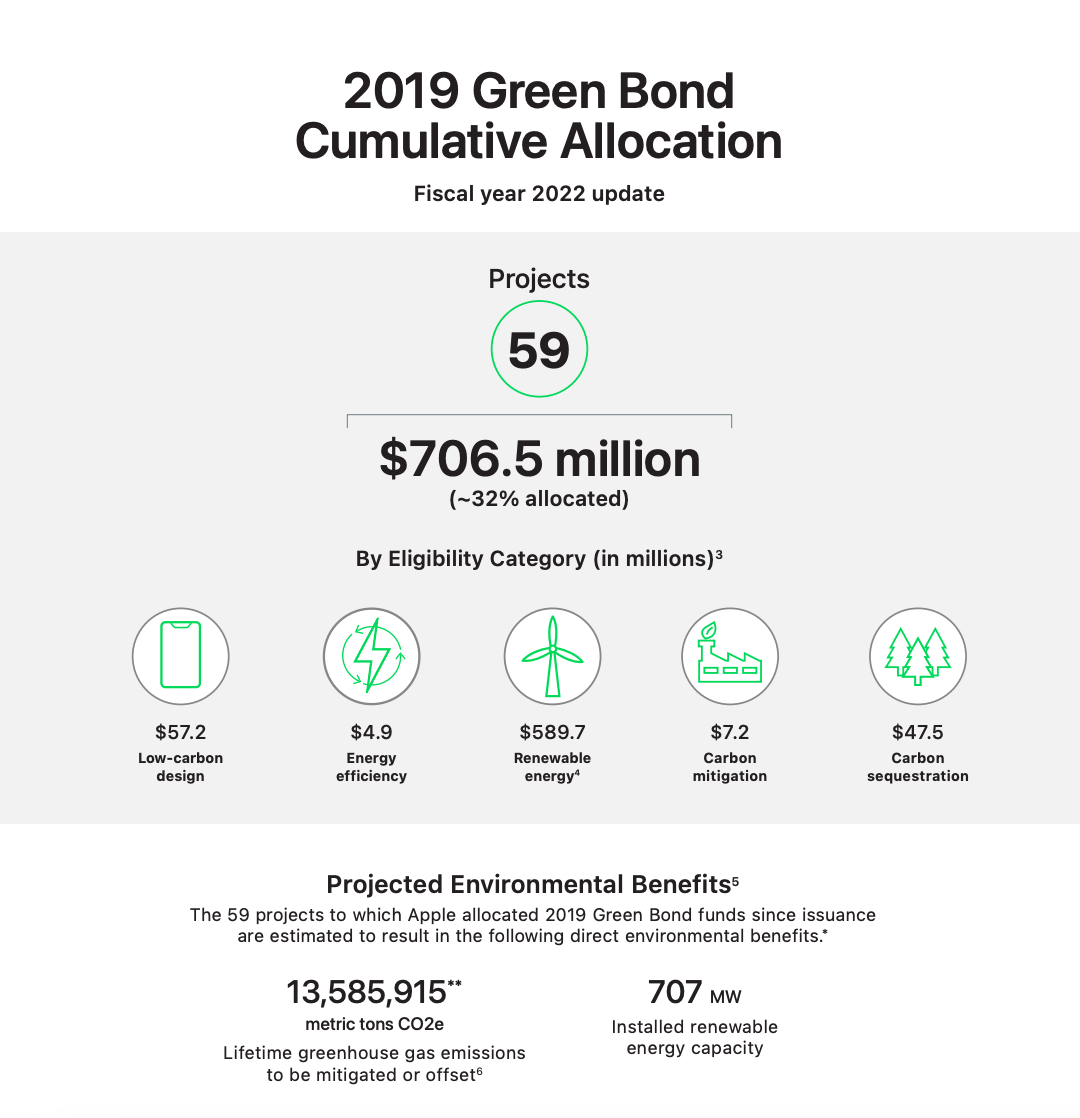
#6. Apple’s annual report reflects their brand’s minimalist aesthetic, with a clean and modern design. They are known for their attention to detail and the inclusion of high-quality images.
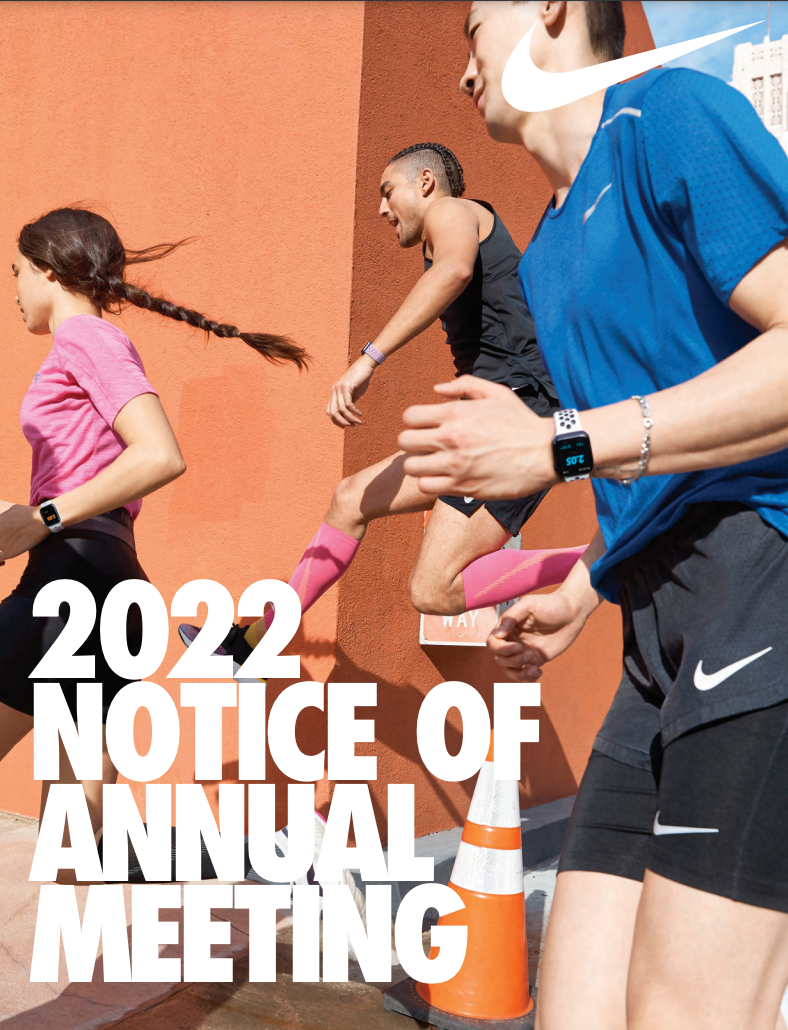
#7. Nike’s annual report is visually appealing, with a balance of images, graphics, and text. They reflect the brand’s energetic and sporty image. Link to Form 10-K and their proxy statement.
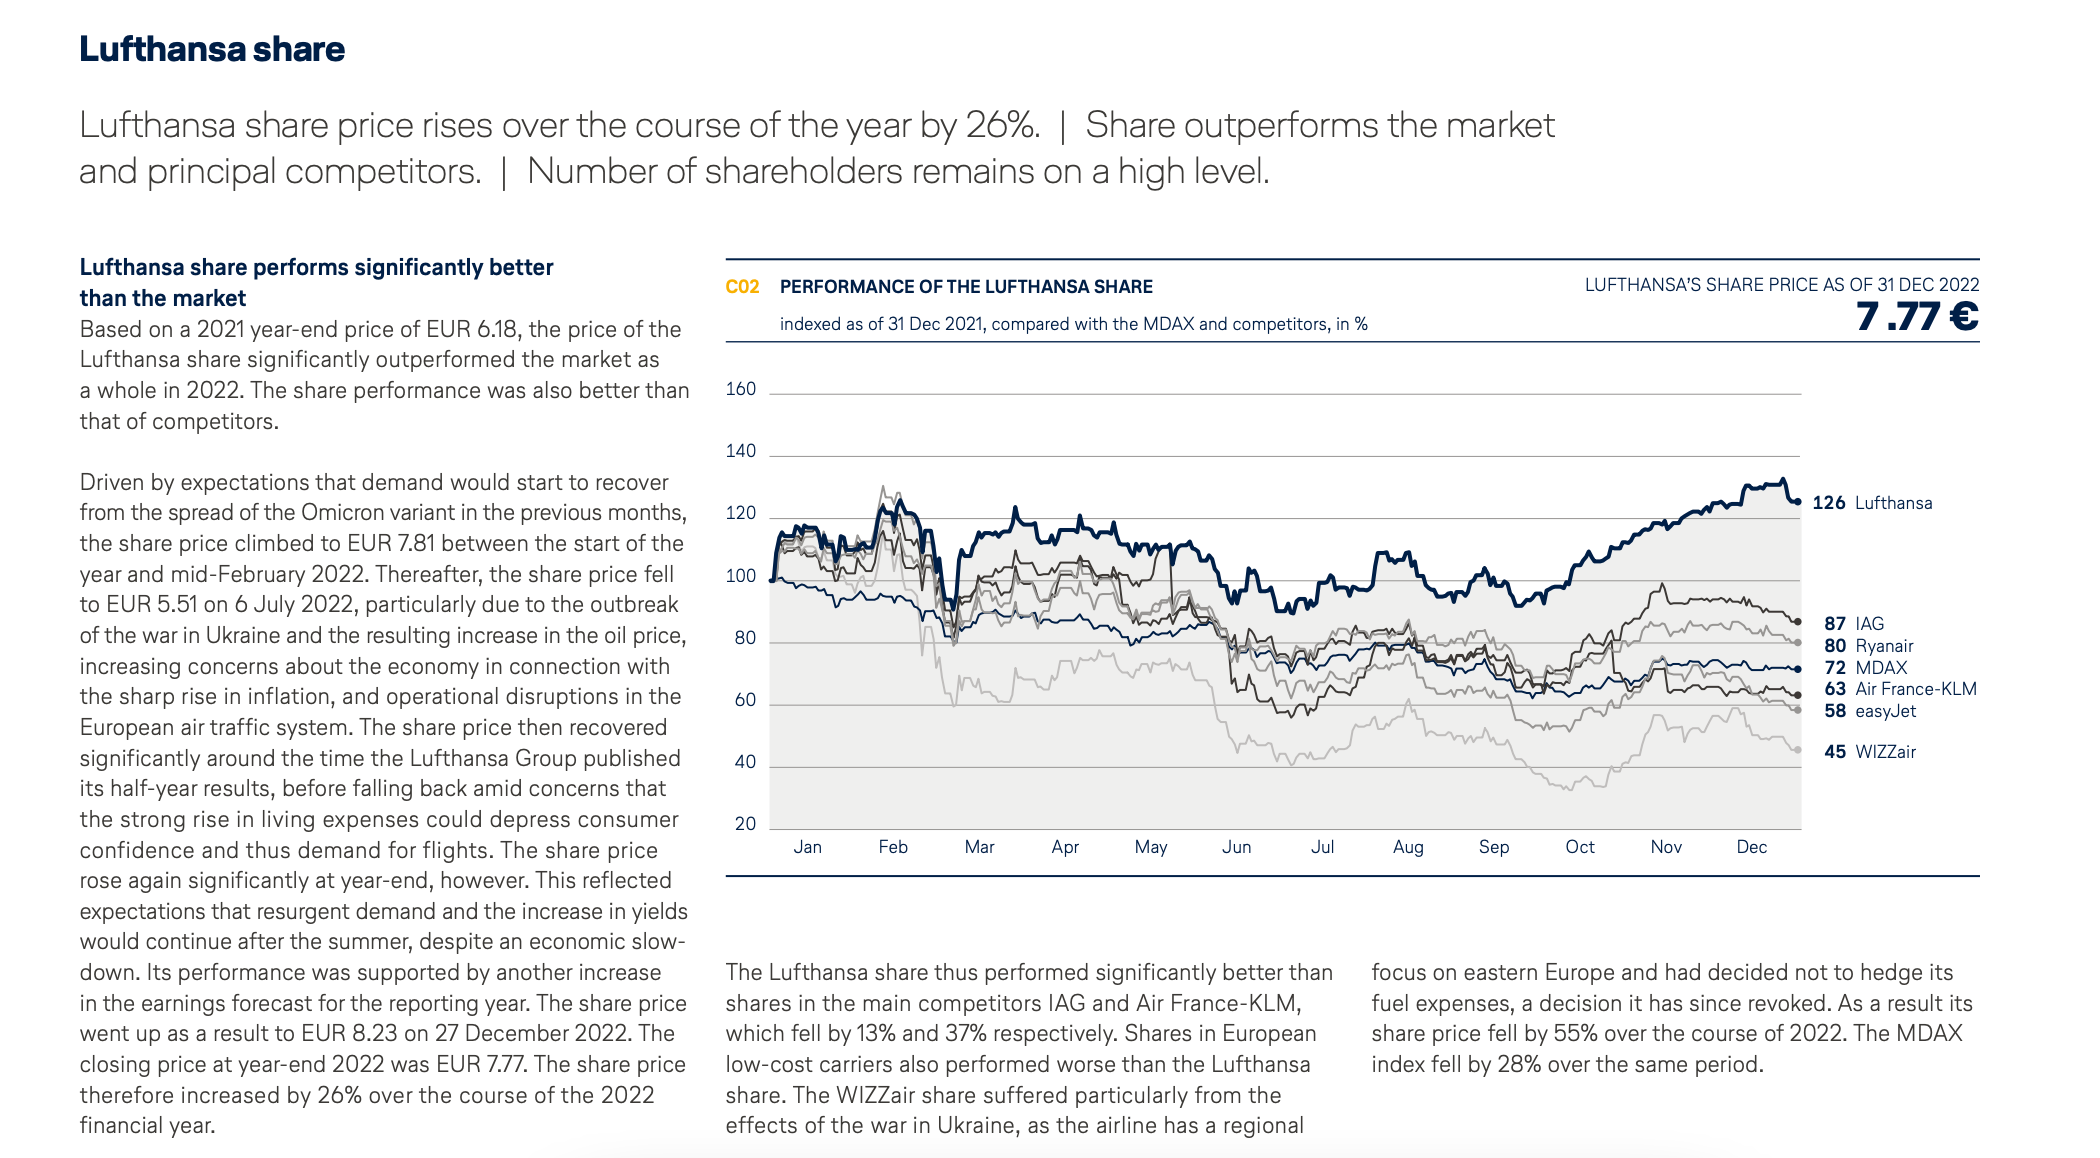
#8. Lufthansa‘s annual report isknown for its clean design and concise copy, their annual report presents data in an easily digestible format. However, the annual report layout tends to follow a more regulatory design.
If we had to choose the best annual report design, we may have gone with drums roll
Lego!
But that’s clearly not for every company’s brand image, so tread with caution here.
Annual report design best practices with examples
Now that you have a vast collection of templates to choose from, your next step is to improve your annual report design skills.
Celebrate your company’s success and learn from your organization’s failures with the following the best annual report design practices and examples:
1. Go all-out on your cover design to pique your audience’s interest.
Think of your cover page as your headline. Your annual report’s cover should capture the attention of your audience and give them a glimpse of what to expect if they read your annual report.
The cover design is sometimes as deliberate as an ad campaign, so don’t hold back!

Mailchimp’s interactive 2020 annual report
Mailchimp’s interactive 2020 annual report is a good example.
While you don’t have to make your report interactive as well, what makes this annual report cover stand out are the wonderful illustrations, cute characters, and its catchy title, “Against All Odds”. It entices you to check out the rest of the report.
2. Use visuals to help your audience learn and retain information in your annual report.
If you’ve ever had to read and go through lengthy annual reports, you know it can be challenging to retain the reader’s attention.
A well-thought-out annual report should use visuals to help your audience understand complex data. We’re not talking about using a bright yellow color, but you get the gist. Take a look at a section of Netflix’ 2018 annual report below as an example.
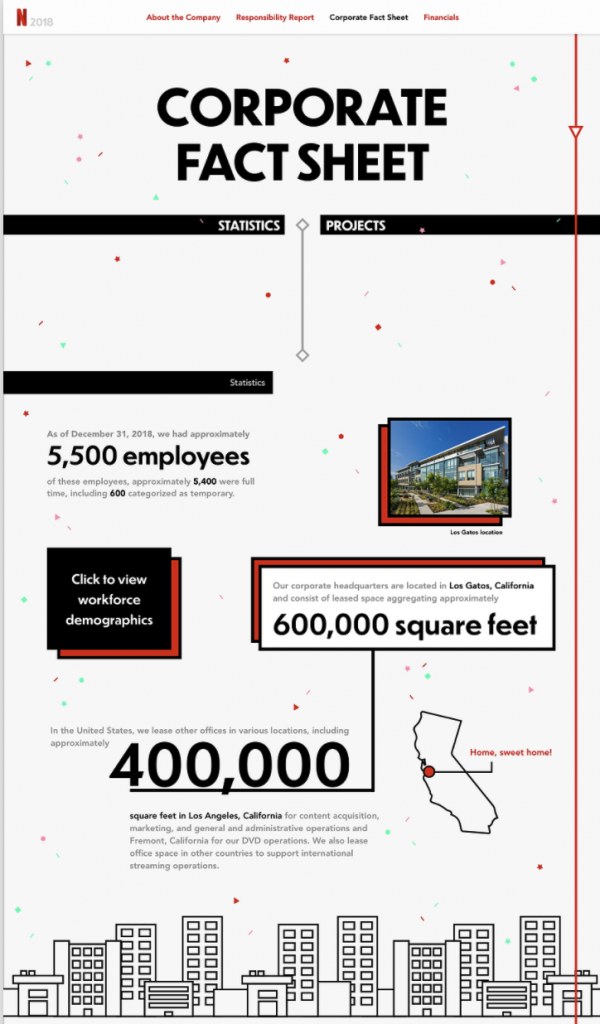
Source: Caren Jones
With 65 percent of the world population as visual learners, help your audience understand your report better through photos, icons, diagrams, charts, and infographics.
Piktochart allows you to easily import your data for your charts and graphs in your annual report.
3. Integrate your brand image into your annual report.
Your annual report is a huge marketing opportunity to showcase your company’s brand identity and connect with your audience.
When created strategically, an annual report can even help boost your internal marketing efforts.
Some helpful design tips
Incorporate your company logo, colors, typography, and tone of voice into your annual report design. For example, your yearly report doesn’t have to sound boring.
Borrowing from Verizon, take a look at a section of their Data Breach Investigations Report (DBIR) for 2020 – it is informative yet also entertaining to read!

For more annual report design inspiration and tips, watch our webinar recording of How To Visualize A Perfect Annual Report for the End of the Year Reporting below.
By the end of the video tutorial, you’ll discover:
- The essential ingredients of a well-thought-out, effective annual report design
- Actionable steps to help your audience understand and retain information better
- A walkthrough of how to edit and customize Piktochart’s annual report templates
Recommended reading: Measure and Report with Meaning – an Interview with Meghan Keaney Anderson of HubSpot
FAQs about annual report design
How much does it cost to design an annual report?
Companies typically spend between thousands to tens of thousands of dollars to design these reports. It depends on the company’s size.
How long are annual reports typically?
The length of annual reports can vary depending on the company, industry, and regulatory requirements. This can range from tens of pages to over a hundred pages.
For smaller companies or those with simpler operations, the length typically ranges from 10 to 30 pages.
For larger companies or those in more complex industries, annual reports can span anywhere from 50 to 100 pages or more.
What are the main components of an annual report?
- Letter to Shareholders/Chairperson’s Letter: Usually on the first page, the report opens with a letter from the company’s leadership, providing an overview of the company’s achievements, challenges, and future prospects in view of the company’s mission statement. This is where the business’s story can be told as an outlook and our favorite pick is Warren Buffett, the Oracle of Omaha’s yearly shareholder’s letters.
- Financial Highlights: Key financial information and key performance metrics summarizing the organization’s performance over the reporting period, including in-depth report on revenue (indicating financial success), net income, earnings per share, and other relevant financial ratios. A financial statement are attached as an appendix.
- Management’s Discussion and Analysis (MD&A): A detailed narrative analysis by management, discussing the company’s financial results, market trends, risk factors, and significant events or developments during the reporting period.
- Business Overview: A description of the company’s business model, products or services, market position, competitive landscape, and key strategies employed to drive growth and profitability.
- Corporate Governance: Information about the company’s governance structure, board of directors, executive compensation, and any related governance policies and practices.
- Financial Statements: Detailed financial statements, including the balance sheet, income statement, cash flow statement, and statement of changes in equity. These statements provide a comprehensive view of the company’s financial position, performance, and cash flows.
- Notes to the Financial Statements: Explanatory notes accompanying the financial statements, providing additional details, disclosures, and explanations for specific accounting policies, estimates, and significant transactions.
- Risk Factors: An assessment of the potential risks and uncertainties that could impact the company’s financial performance, operations, or future prospects.
- Corporate Social Responsibility (CSR) or Sustainability Report: Information about the company’s environmental, social, and governance (ESG) initiatives, including its environmental impact, social responsibility programs, diversity and inclusion efforts, and community engagement activities.
- Auditor’s Report: An independent auditor’s opinion on the fairness and accuracy of the financial statements.
- Shareholder Information: Information about dividends, share performance, annual general meetings, and contact details for shareholder inquiries.
What is the best layout for an annual report?
The following are common in annual report layout.
- One-Column Layout: A one-column layout is clean, simple, and allows for a straightforward flow of content. It works well for pages with less content or to emphasize on visual elements.
- Two-Column Layout: A two-column layout can offer a good balance between content and design elements especially when you want to present data. It allows for the presentation of text in one column while utilizing the other column for visuals, call-outs, or additional information.
- Three-Column Layout: A three-column layout provides greater flexibility for organizing content, particularly when the entire report contains a significant amount of text or data visualizations.
When determining the most appropriate layout for an annual report, consider the volume and type of content, the desired balance between text and visuals, and the overall design objectives by section of your annual report.
You want to balance the important elements to make the report easy to digest.
Create annual reports that people will read (and rave!) about
You know it’s a good annual report if you read it from cover to cover and you got a good grasp of what you just read. You might even rave about it and share it with colleagues and business partners!
Annual report creation doesn’t have to involve complicated software (Adobe InDesign or Microsoft Word) that you have to download nor expensive graphic designer fees. Templates are not only time-savers, but they also encourage creativity because of constraints.
Create your free Piktochart account and get started on your next annual report!
For more annual report design inspiration and tips, watch our webinar recording of How To Visualize A Perfect Annual Report for the End of the Year Reporting below.
Create an annual reports that people will read!
Select a template that sparks your imagination. Clone, add or delete blocks. Visualize concepts, processes, lists, timelines and data. Use charts and graphs. Sync them with spreadsheets. Export the visual in PDF or PNG format. Start for free.
Create a visual