An infographic poster turns dense information into a visual people can scan in seconds. If you need a format for research findings, awareness campaigns, event promotion, or internal communication, this guide shows how to plan one, pick the right layout, and start from editable templates.
Inside, you will find infographic poster examples, format ideas, and a step-by-step workflow for building your own design in Piktochart’s poster maker. You will learn where chart-based posters fit best, how structure changes by use case, and which elements help readers follow the message fast.
Use the ideas below for print posters, digital sharing, classroom work, or workplace communication. If you want a shorter path from concept to first draft, start with one of Piktochart’s editable templates and shape the content around your audience.
Table of contents
Want to jump right into creating infographics posters? Sign up for free and get access to our library of infographic poster templates.
What is an infographic poster anyway?
An infographic poster is a visual that presents information from a different perspective through engaging visual elements like icons, graphs, charts, and stylish fonts.
The goal of infographic posters is to make information more interesting and to present complex data in a clear, straightforward way.
12 infographic poster categories that you can click, edit, and download
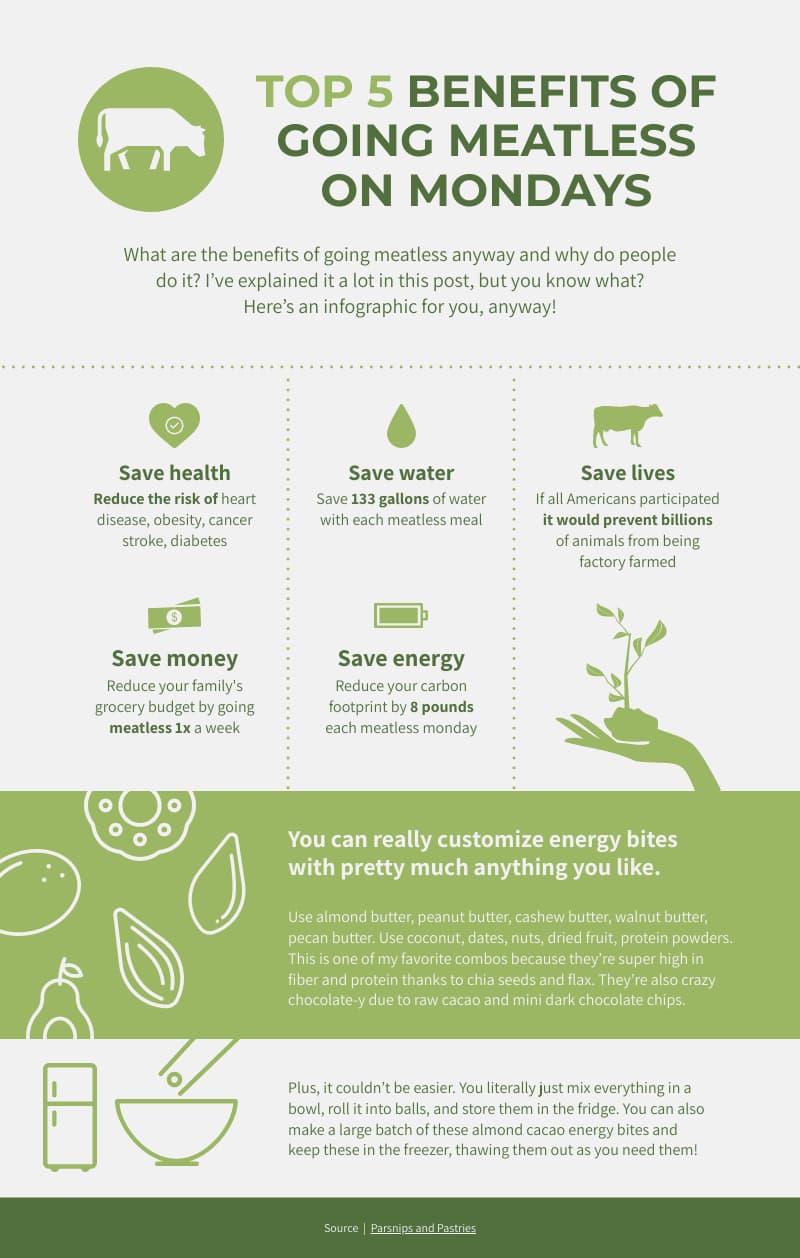
1. Raise awareness about a specific problem
This infographic visual about the benefits of going meatless on Mondays is an excellent example of taking the visual route in creating persuasive informational content.
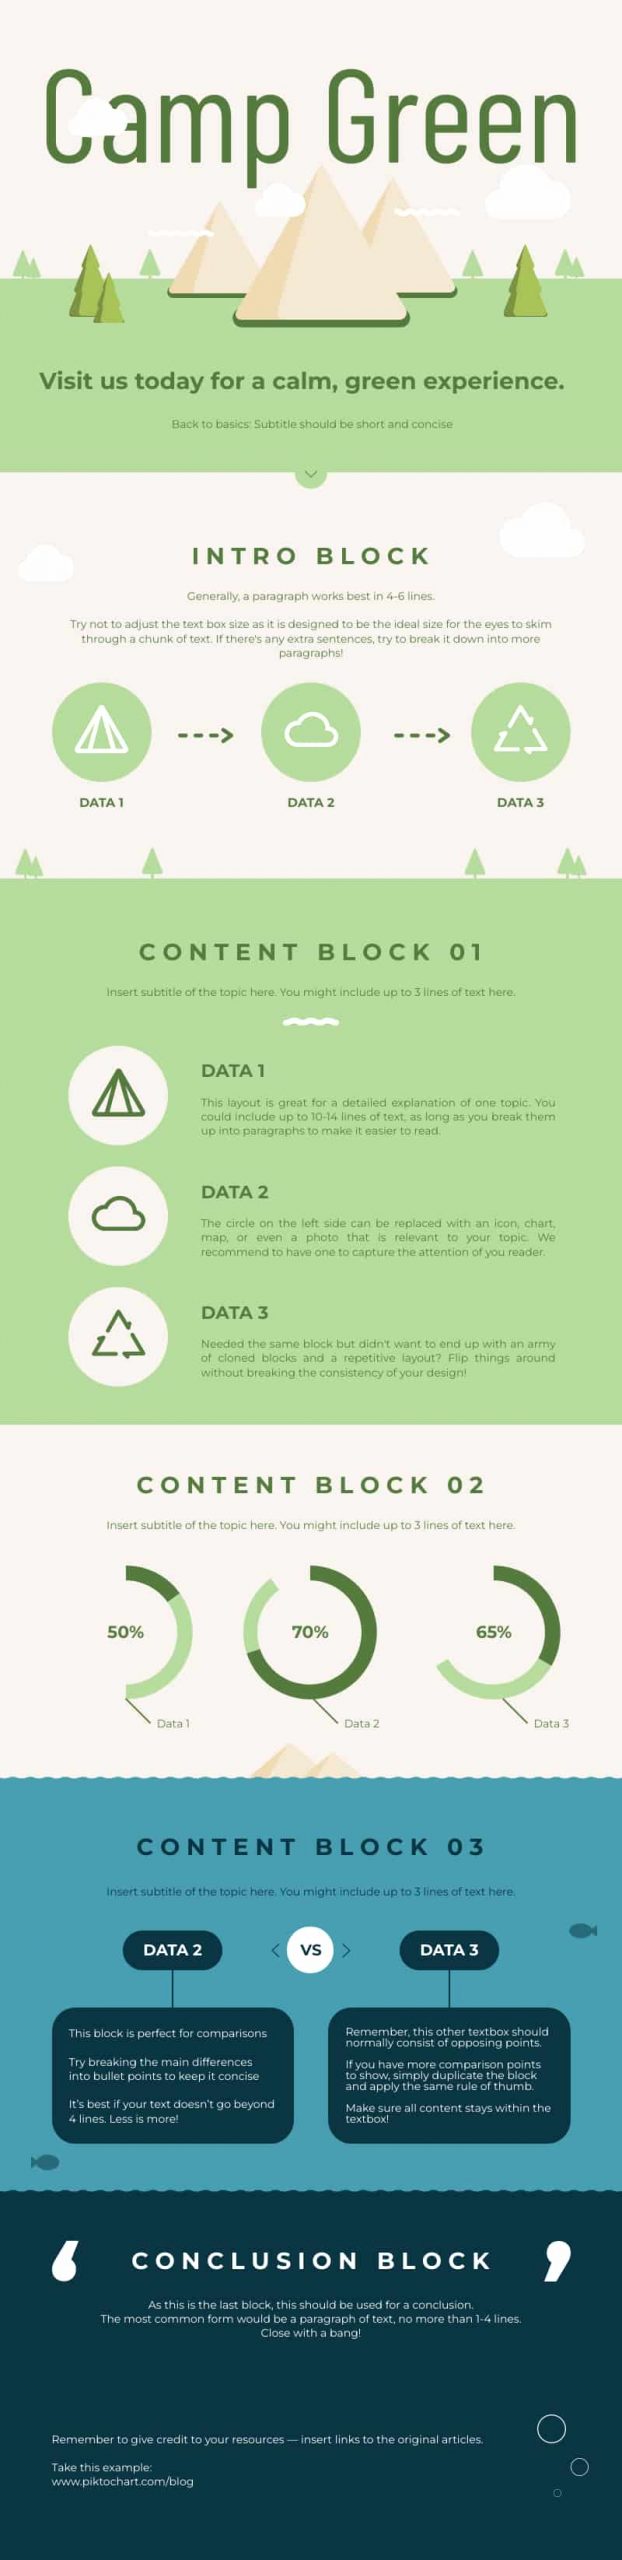
2. Introduce a complex concept in a scannable and digestible way
The visual nature of infographic posters helps overcome the challenge of explaining a new complex idea or process.
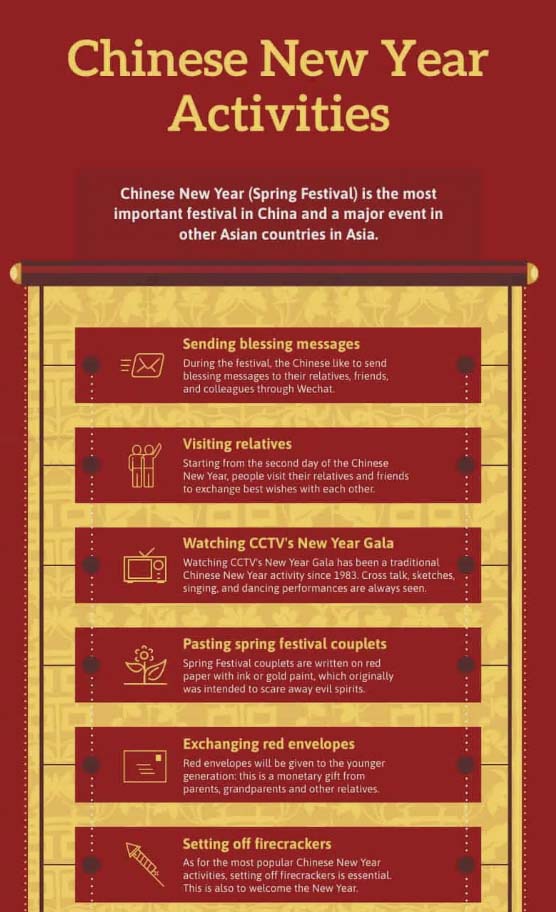
3. Drum up the buzz for an upcoming event or activity
Are you organizing an event? Or hosting a holiday activity?
Use these posters to pique your attendees’ interest and build anticipation, like the timeline activities order example below.
4. Inspire your audience
There’s more to infographic posters than being informative.
You can also use these templates to inspire your audience, whether rethinking their lifestyles or emulating successful inventors.

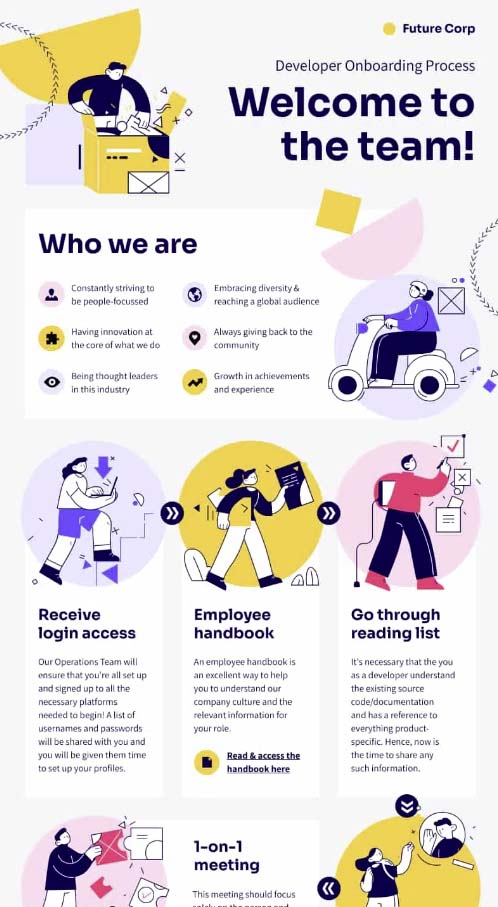
5. Explain the steps of a process or workflow
A well-designed infographic poster is your ally if you want to explain how a process works clearly. This is especially great for employee onboarding.
Instead of scheduling an hour-long onboarding discussion for every new hire, new employees can scan the visual independently and ask questions during a 30-minute meeting.
6. Highlight differences or similarities
Contrast or compare places, ideas, or objects with infographics in timeline formats.
As an example, the infographic below visually shows the contrasts between working as a full-time employee and being a freelancer. Aside from bringing to light the differences, you can also see the use of charts.

7. Advertise a product, service or event
Using traditional posters to advertise has been around for centuries.
These posters are no exception, especially when placed strategically or where your audience frequently hangs out.
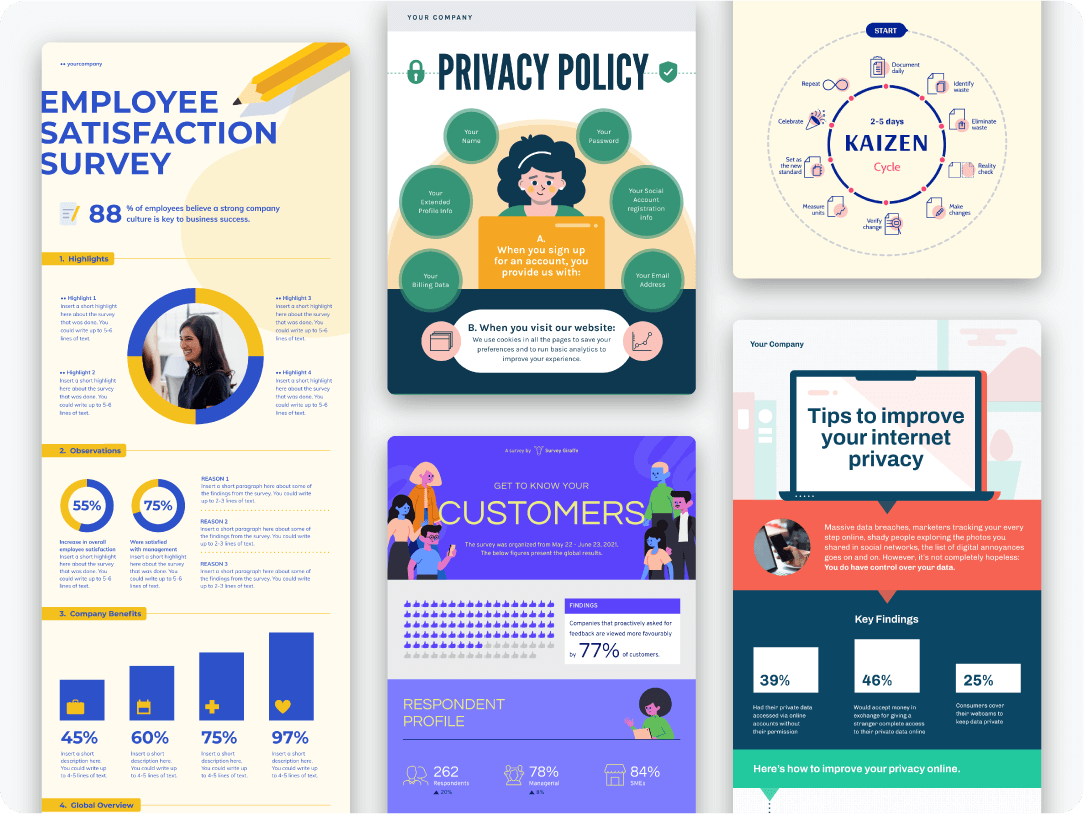
8. Showcase survey results
Whether you’re presenting an annual report to stakeholders or sharing your employee satisfaction survey findings with the entire organization, you can’t go wrong with infographics in the style of posters.

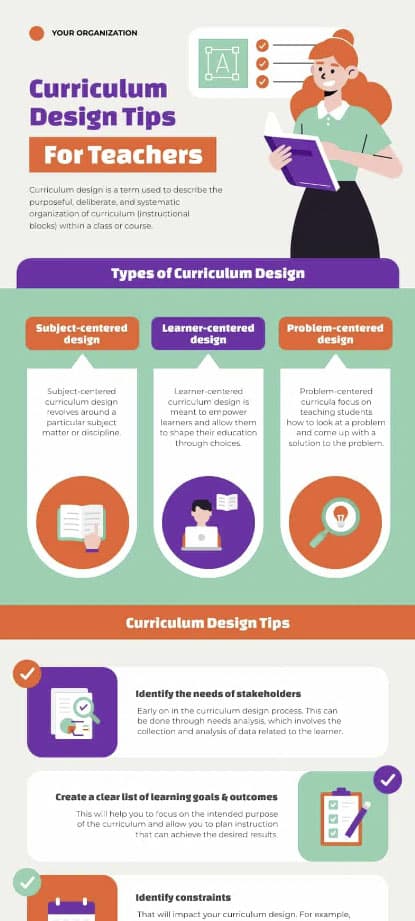
9. Share tips and best practices
Another way to use infographics as posters is to visualize best practices.

10. Show hierarchy
Infographic posters also effectively show how information is organized into various levels and how those levels are interconnected.

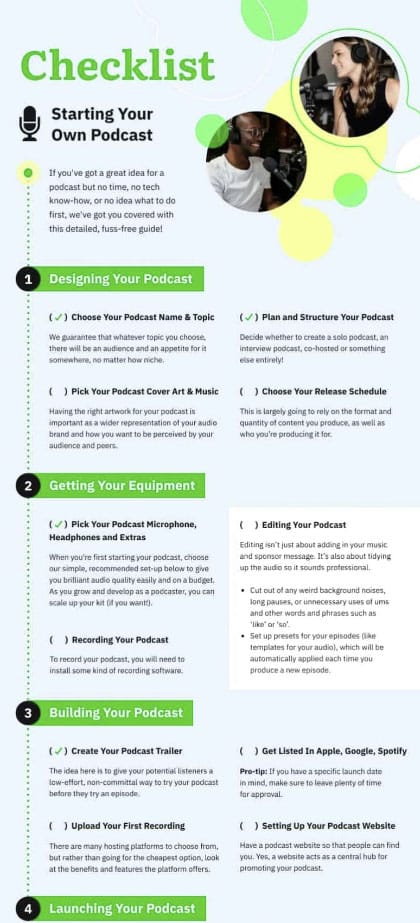
11. Visualize a checklist
A checklist is one of the most effective tools to stay focused, get things done, and stay organized with a timeline amid life chaos.
12. Make an argument
Finally, making and building an argument isn’t just limited to essay writing or public speaking.
How to create your infographic in the form of a poster in five steps
The video guide below shows you how to make an infographic in poster form with Piktochart examples in 30 minutes.
Step 1: Drill down on your goal.
The first step in creating impactful informational posters is to answer this question – find what you want to communicate to the world.
Step 2: Assess your audience.
Audience assessment and analysis is identifying your target audience and getting to know them in terms of how well they already know your poster’s topic or subject.
The most common types of audiences to think about when creating infographic posters are:
- Non-specialists or novices: They are unaware of the idea or message you want to convey. Your visual is their first exposure to your topic.
Example: Explaining the basics of inbound marketing
- Generalists: These people are already aware of your subject but are more interested in your poster’s overview of the topic.
Example: Explaining different inbound marketing examples
- Managerial – They expect to learn actionable tips that they can implement from your poster.
Example: Explaining how to put together your own inbound marketing strategy
- Expert – They want to understand the intricacies of your topic.
Example: Showcasing the different tools to track inbound marketing metrics
- Executive – This audience group is more interested in the most critical data about a topic or subject.
Example: Showing the cost of an inbound marketing strategy plus data set about the return on investment (ROI).
Step 3: Do your research and gather relevant data.
Performing in-depth research on your end may not be necessary if you need to communicate to novices. The key is to make your content simple and understandable for those new to the subject.
However, if your target audience is experts in their field, you must ensure that your content is comprehensive and reliable. It also helps always to cite your sources regardless of your audience group.
As we suggested in our in-depth guide to making infographics, “less is more” when creating copy for your infographic posters.
Step 4: Plan for your content and structure.
After gathering your data and information, the next step is to plan your template’s content and structure.
What should be in your infographic poster?
It should include the following:
- A catchy and descriptive heading
- Your main ideas
- Eye-catching visuals like illustrations, photos, or diagrams
- A compelling call to action
You should also consider your color scheme, fonts, and the visual hierarchy or order of your poster elements.
Step 5: Choose a custom poster template and get creative.
The final step is to find and select a poster template for your infographic and add your content to the existing template. The best thing about these templates is there’s no need for you to bring in designers or study graphic design trends.
Another way to choose the most suitable template for your poster is to understand the different types of infographics and when to use them.
After customizing your free infographic and or poster, use the opportunity to promote the design to your social networks, upload it to your website, or transform it into printables such as flyers or brochures.
How to choose data visualization types for an infographic poster
The best infographic poster designs do not start with decoration. They start with a match between the message and the visual format. Pick the wrong chart, and readers spend extra time decoding the poster. Pick the right one, and the main point lands almost at once.
Use a bar chart when readers need to compare values across categories. Sales by region, survey answers by department, or budget by team fit this format well. Use a pie chart for parts of a whole, though only when you have a small number of segments and clear differences in size. Use a timeline when your story moves in sequence, such as project milestones, event history, or a campaign rollout. A comparison layout works best for side-by-side choices, like product plans, before-and-after results, or two policy options. A process visual or flow-based layout fits instructions, onboarding, and step-by-step workflows.
Poster format matters too. Readers often stand a few feet away, so clutter hurts more on a poster than on a social post or slide. Keep one main chart or one dominant visual story per section. If you need several visuals, give each one a clear label and enough white space around it. Strong headings, short captions, and consistent icon use will do more for clarity than extra decoration.
One useful rule: if the reader needs to ask, “What am I looking at?” the layout still needs work. Start with the message, choose the chart or structure that serves it best, and build from a poster template that already supports the flow. If you need inspiration for format choices, review common types of infographics before you start designing.
Bring your ideas to life with infographic posters
Pick a template, edit it minutes, and voila, you have a stunning infographic poster! You don’t have to be a designer.