Your inbox pings.
It’s the CEO. They need a complete overview of the company’s performance for next week’s board meeting.
Your heart races as you stare at folders full of quarterly reports, customer data, and financial projections.
How do you condense months of work into something a busy executive absorbs in under two minutes?
A fact sheet. One page. Every critical detail. Nothing wasted.
A fact sheet is a single-page document that distills complex data into a clear, scannable format: the kind of one-pager that gets read instead of filed away. Whether you call it a fact sheet, an information sheet, or an executive one-pager, the goal is identical: get the right information to the right person, fast.
Fact sheets are just one format — explore other types of reports to find the right fit for your audience.
Stakeholders, investors, and decision makers do not have time for novel-length reports. They want the key facts. Presented clearly. Right now.
And it is not only boardrooms that need them. HR teams use fact sheets to onboard new hires. Educators use them to break down complex curricula. Non-profits use them to communicate impact to donors. Public health organizations use them to translate medical data into language anyone can act on.
Pitching to investors? Onboarding a new team? Running a public health campaign? Whoever your audience, a well-crafted fact sheet closes the gap between complex information and clear understanding.
In this guide, you will find 10 real-world fact sheet examples spanning business, healthcare, education, and more, along with a step-by-step breakdown of how to build your own.
What is a fact sheet?
A fact sheet is a one-two pages long document that presents key information about a specific topic, product, or organization. It’s designed to communicate essential facts and figures in a clear format.
Any topic under the sun can have many complex layers, from basic concepts to advanced details. And you can cut through this complexity with a fact sheet.
Here’s a snapshot from our healthcare templates that shows how a fact sheet transforms complex health data into clear insights:

See how it takes a complex issue like physical inactivity and breaks it down into key statistics anyone can understand?
That’s the power of an effective fact sheet.
When should you use one?
Clear communication can make or break any project. Fact sheets excel at delivering key information quickly and clearly when:
- You need to translate complex data into clear insights for stakeholders
- You’re presenting research findings to a non-technical audience
- You want to give your annual report a compelling executive summary
- You need a reliable handout for training or educational sessions
- You’re sharing project milestones with several teams
- You want to make your technical documentation more accessible
A well-built fact sheet does two things: It captures your audience’s attention and gets your message across.
Here’s how you build a robust one.
Key sections to include
You’ve probably run into fancy fact sheets at work or on social media. These often look like the work of a talented designer.
When you see these polished designs floating around, it’s easy to feel a bit intimidated, and we don’t blame you.
But you don’t need a crazy design to convey a message effectively. In fact, you can go as simple as this.
Looks straightforward, right? Clean font, clear headings, and organized bullet points.
There’s a simple formula you can follow to craft your fact sheets. This formula guarantees you will always produce a fact sheet that captivates and informs your target audience.
All you need is a few basic ingredients:
- Title — Your audience’s first touchpoint with your content
- Introduction/Summary — A brief overview that hooks your reader
- Main content organized into logical sections — The meat of your fact sheet, broken down into digestible chunks
- Contact information — How readers can learn more or reach out
- Sources/References — Build credibility by citing where your information comes from
Here’s how they look like when put together:
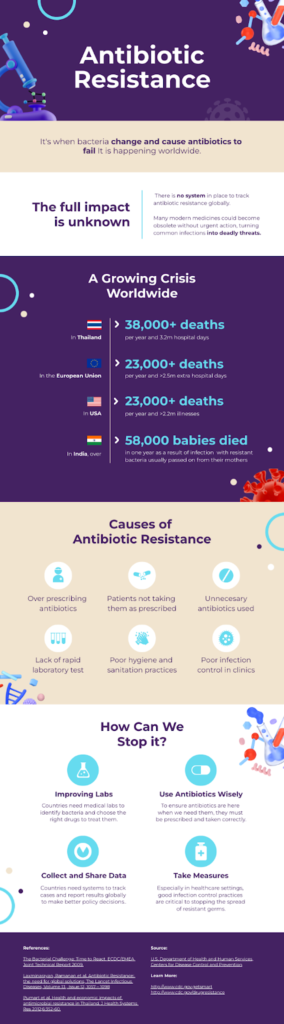
Every effective fact sheet, simple or sophisticated, is built from these essential elements:
- Title — “Antibiotic Resistance” catches attention right away
- Introduction/Summary — The one-liner explaining what it is
- Main content organized into logical sections — From “The Full Impact” to “How Can We Stop It?”
- Contact information — The “Learn More” links
- Sources/References — Academic citations at the bottom
Everyone can create a robust fact sheet. Let’s see how.
Planning Your Fact Sheet
Creating a fact sheet starts long before you type your first word.
Starting with a clear purpose and target audience helps shape the content.
For example, an investor fact sheet needs different information than one for potential customers.
Each segment has specific interests you need to take into account.
A SaaS startup might highlight their 127% year-over-year growth and $2.4M ARR for investors. But the same startup will showcase their proven ROI (e.g. “$200K annual savings”) and enterprise client list to potential customers.
Next comes the research phase. With your goals and audience in mind, gather facts and stats that support your message.
As you collect your information, try to create a simple hierarchy:
- At the top, must have facts
- In the middle, supporting details
- At the bottom, nice-to-have information
Knowing what you want to put into the fact sheet will make writing the content much easier.
Writing the content
Your fact sheet’s content needs to capture attention in seconds.
Start with a clear, compelling title that spells out exactly what readers will learn.
A clear and compelling title helps readers quickly grasp what they’ll learn from your fact sheet.
While general titles like “Health Facts” serve a purpose, try to get more specific. A title like “Teen Mental Health: Warning Signs Parents Need to Know” tends to resonate better with the target audience.
Hook readers with a punchy introduction that previews your key findings. Two strong sentences are better than five weak ones.
A punchy introduction will hook readers in and get them interested in your fact sheet. Remember to keep it brief—two impactful sentences capture attention better than five weaker ones.
For example: “Our AI solution cut customer service costs by 40% in 2023. This report breaks down the implementation process and ROI metrics.”
When structuring main sections, a journalistic approach often works well. Leading with key facts before supporting details helps maintain reader engagement.
Rather than “We have made significant progress”, something like “Customer base grew 85% in 6 months” tends to be more impactful.
Some approaches that can help transform complex ideas into digestible points:
- Breaking long sentences into shorter ones
- Using strong verbs (“achieved”, “launched”, “delivered”)
- Replacing jargon with plain language (ditch the “interface” for the “screen”)
- Adding specific numbers and timeframes
Lastly, test your draft by reading it aloud — if you stumble, your readers will too.
Formatting for Readability
Your fact sheet needs to be visually digestible at a glance.
And it doesn’t take much to make it pop:
- Stick to two pages max – a single page is even better. A pharmaceutical company fact sheet showing drug trial results on one crisp page will have more impact than three pages of dense text.
- Build a clear roadmap with headlines and subheads. Think newspaper-style hierarchy: big story first, details follow.
- White space is your friend – don’t feel compelled to fill every inch of the page.
- Transform numbers into visuals. A simple bar chart showing market share speaks louder than a paragraph of percentages.
- Pick a clean, modern typeface like Arial or Calibri.
- Accent with color thoughtfully – use it to guide eyes to key takeaways, not to overwhelm. Keep it to 2-3 colors.
How your fact sheet looks at first glance can determine whether it gets read or ignored. Make those seconds count.
Final Tips
What you’ve built up so far is a good fact sheet.
But the difference between a good fact sheet and a great one often comes down to the final polish.
Common pitfalls crop up even in well-researched fact sheets. Remember that you, as the sheet’s creator, might not see it objectively. What seems crystal clear to you might confuse others.
This is why successful fact sheets go through several reviews. Fresh eyes can identify where jargon has crept in, where important data got buried, or where a simple chart could replace paragraphs of text.
Before you share your work, complete these essential checks:
- Have a subject matter expert verify your technical accuracy
- Ask someone from your target audience to flag any confusing sections
- Get a complete newcomer to point out where you’ve made assumptions
Think of each reviewer as a different lens. The expert catches technical flaws. Your target audience reveals clarity issues. And the newcomer points out any assumptions that may not be common knowledge.
You’re not done yet. You’re never really done with fact sheets. New data, methodologies, and shifts in your audience all mean your document needs regular check-ups to stay relevant and reliable.
10 Examples of Fact Sheets
We’ve been banging on about goals and target audiences for a while. Let us show you how these look in practice.
Fact sheets come in many forms, each tailored to serve specific communication needs.
These documents all share common elements like clear organization and concise presentation. But their content focus and structure can vary significantly based on their purpose.
The fact sheet you craft to showcase your company’s achievements will look quite different from one explaining complex scientific research or outlining financial performance.
Below, we’ve broken down the most common types with examples and templates you can adapt.
Company Fact Sheet
A company fact sheet gives stakeholders the essential information about your business.
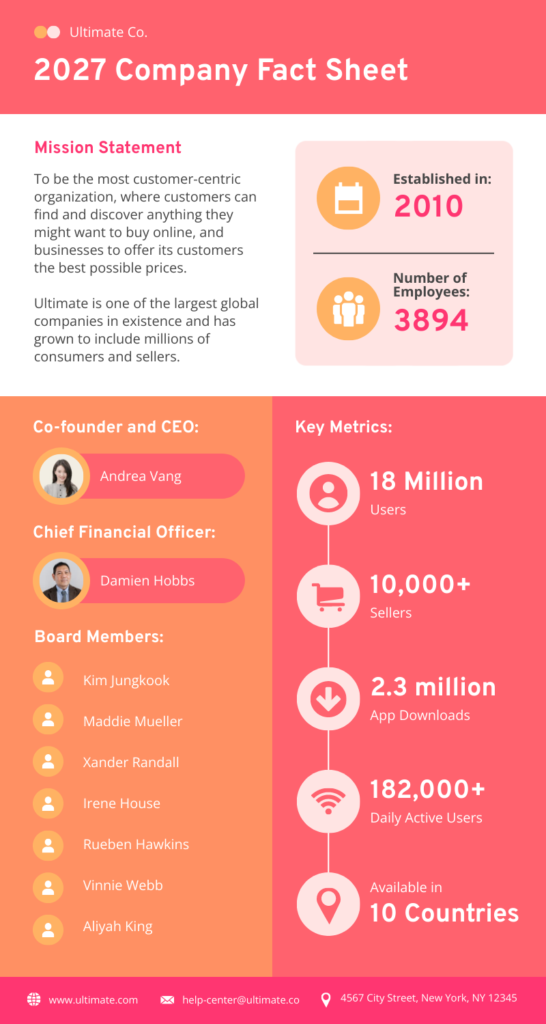
Notice how this sheet gives you an instant snapshot of the company’s scale and structure. The clean layout draws your eye to crucial details. The leadership section adds credibility, while the metrics tell a compelling growth story.
A few ideas of metrics to include:
- Mission statement and company overview
- Key leadership team members
- Company statistics and metrics
- Market presence information
Common applications include:
- Investor relations
- Media kits
- Partnership proposals
- Job fairs
- Company websites
This format helps stakeholders quickly understand who you are and what makes your company unique.
Mental Health Awareness Fact Sheet
Mental health fact sheets transform medical guidance into supportive, accessible information.
For an example, check out this fact sheet we got from our mental health templates:
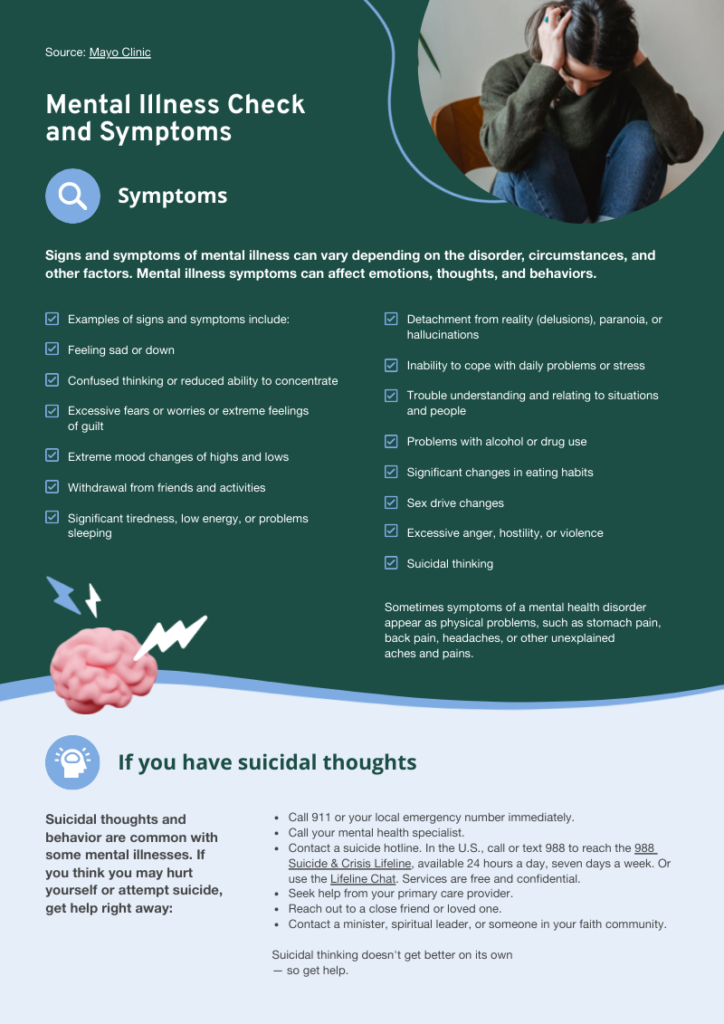
The checklist format helps with accessibility. Anyone scanning the document can quickly identify concerning symptoms. The thoughtful design pairs clear descriptions with visual cues, while the bottom section provides immediate action steps for crisis situations.
Most importantly, it removes barriers to getting help by listing specific resources and contact information.
Make sure to include:
- Clear symptom descriptions
- Warning signs and red flags
- Action steps and resources
- Emergency contact information
- Support options
- Professional guidance
You’ll find these fact sheets being used across::
- Mental health awareness campaigns
- Healthcare provider offices
- Support organizations
- Educational institutions
- Crisis response teams
This format helps people recognize symptoms and find help when they need it most.
Product Roadmap Sheet
Product roadmap fact sheets map out initiatives, timelines, and deliverables in an easy-to-follow format.
For example, here’s a product roadmap fact sheet, created with our project timeline template:
Ready to create your own? See our guide to the best apps to create a fact sheet.

Anyone seeing this can quickly grasp how the app is evolving, including developers and investors. The benefits section under each feature helps everyone understand the “why” behind the “what”. The clean team assignments keep accountability clear and timelines realistic.
A strong project fact sheet includes:
- Project overview and objectives
- Timeline with key milestones
- Team responsibilities
- Feature descriptions and benefits
- Quarterly breakdowns
- Resource allocations
Typically used in settings such as::
- Project kickoffs
- Stakeholder updates
- Team alignment
- Planning sessions
- Progress tracking
This format helps teams understand project scope, timeline, and expected outcomes at a glance.
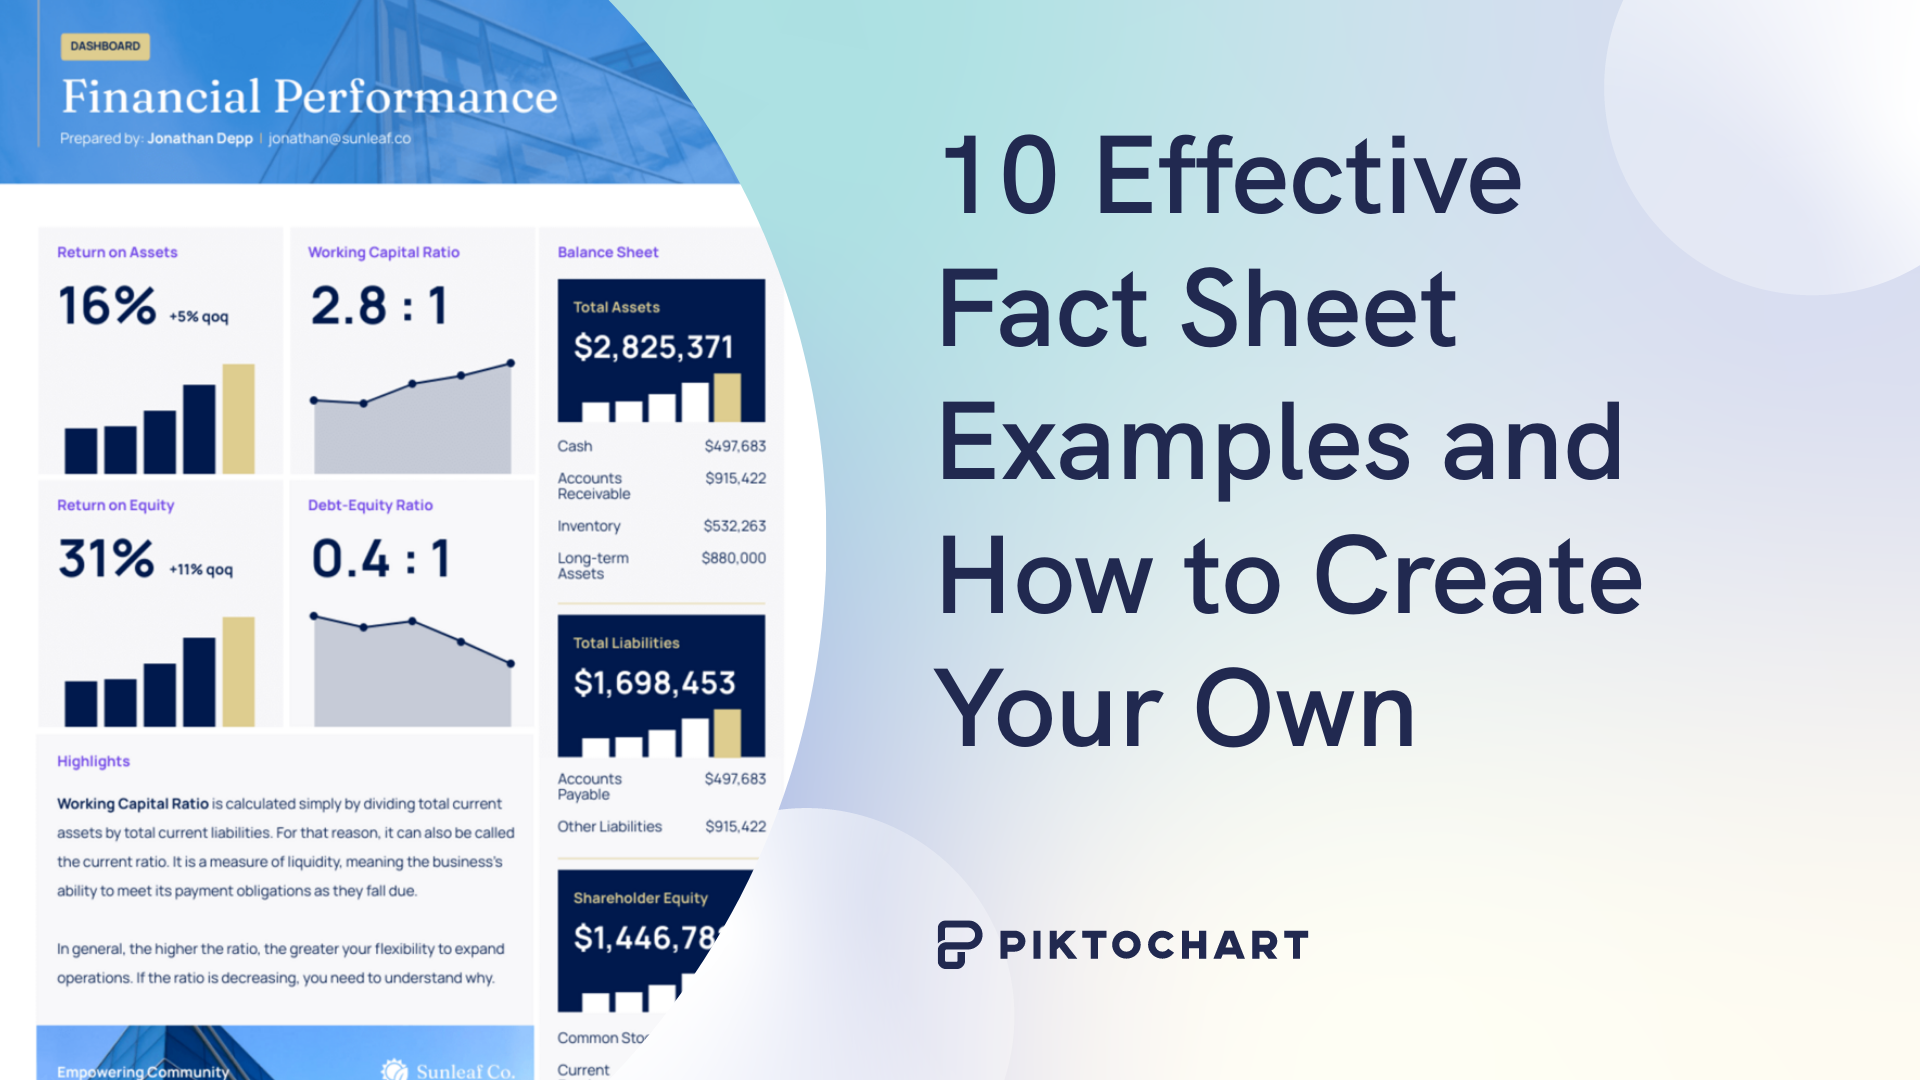
Financial Performance Fact Sheet
Financial fact sheets present complex financial data in a clear, visually appealing dashboard format.
For example, here’s a quarterly financial performance report, built using our financial templates:

The dashboard layout instantly communicates the company’s financial health. Key ratios and metrics are prominently displayed with quarter-over-quarter comparisons, while the balance sheet breakdown gives a complete picture of assets and liabilities. The visual charts make growth trends immediately apparent, even to those without a finance background.
A strong financial fact sheet includes:
- Key performance indicators (KPIs)
- Growth metrics and trends
- Financial ratios
- Balance sheet highlights
- Visual data representations
- Quarter-over-quarter comparisons
These fact sheets work great for:
- Investor relations
- Board meetings
- Annual reports
- Stakeholder updates
- Financial reviews
This format helps stakeholders quickly grasp your company’s financial health and performance trends.
Product Fact Sheet
Product fact sheets showcase key features and specifications in a scannable, attractive format.
For this one, we asked our AI fact sheet generator for help:
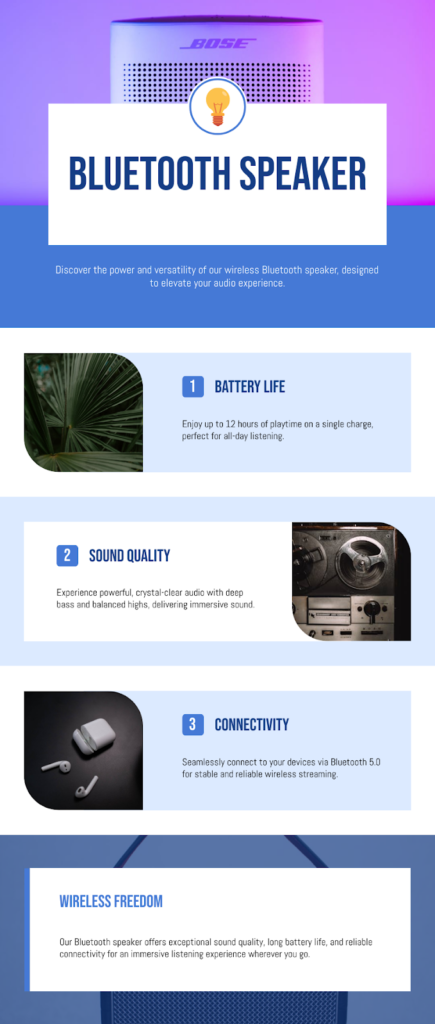
The clean, three-point layout walks you through the key selling points effortlessly. Each feature section pairs a relevant image with concise benefit statements, while the consistent blue color scheme reinforces the brand.
A strong product fact sheet includes:
- Clear product name and category
- Key features with brief explanations
- Technical specifications
- Visual product demonstrations
- Brand elements and styling
- Benefit-focused descriptions
Key use cases include::
- Product launches
- Sales materials
- Retail displays
- Customer education
- Trade show handouts
This format helps potential customers quickly understand your product’s value and benefits.
Medical Statistics Fact Sheet
Healthcare fact sheets turn medical data and research into clear, actionable information for patients and providers. For example, here’s a fact sheet about diabetes, courtesy of our statistical infographic templates:
The visuals tell the story of global diabetes impact at a glance. Regional breakdowns and trend projections make the data digestible, while the clear statistics and growth indicators help readers grasp the scale of the issue. The color-coding and icons guide you naturally through different aspects of the condition.
Key statistics with visual representations
- Clear breakdown of risk factors
- Global and regional impact data
- Future projections and trends
- Disease-specific complications
- Prevention and management tips
Most valuable in contexts like::
- Public health campaigns
- Patient education
- Medical research summaries
This format helps people understand crucial health information without getting overwhelmed.
Environmental Impact Fact Sheet
Environmental fact sheets transform complex sustainability data into actionable insights for stakeholders. Here’s an example, courtesy of our AI generator (with light text editing):
The three-pillar approach breaks down environmental impacts into clear, relatable benefits. Each section pairs compelling statistics with real-world outcomes, showing how green investments directly improve lives.
Effective environmental fact sheets include:
- Key performance indicators with specific percentages
- ROI metrics for green investments
- Multi-faceted impact analysis (environmental, social, health)
- Clear connection between environmental actions and tangible benefits
- Visual elements to represent data
These strengths make them particularly useful for companies that are:
- Preparing an ESG report
- Launching a green initiative
- Showcasing environmental impact to stakeholders
This format shines when you have to show measurable outcomes of your green initiatives.
Health Benefits Fact Sheet
Health benefits fact sheets turn complex wellness data into clear, motivating information for the general public. Here’s an example from our healthcare templates:

The visual hierarchy guides readers through both immediate and long-term benefits of exercise. Statistics at the top establish urgency, while color-coded sections break down complex health impacts into digestible chunks.
Key components for health benefit fact sheets include:
- Current statistics and participation rates
- Immediate benefits with clear icons
- Long-term health outcomes
- Disease prevention metrics
- Simple action steps
These fact sheets work particularly well for:
- Public health campaigns
- Wellness programs
- Healthcare providers
- Fitness centers
- Corporate wellness initiatives
This format helps communicate the value of healthy behaviors without medical jargon.
Event Fact Sheet
Event fact sheets provide essential details about upcoming gatherings in a way that helps any attendee know what to expect.
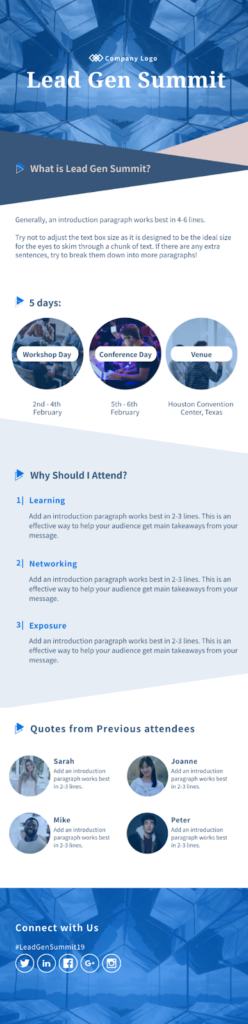
The clean layout guides attendees through all crucial event information. The blue geometric header creates visual interest, while clearly marked sections help readers quickly find key details.
Effective event fact sheets include:
- Clear event name and branding
- Key dates and location details
- Structured agenda or timeline
- Main benefits of attending
- Speaker or participant highlights
- Social proof (testimonials/quotes)
These fact sheets are particularly valuable for:
- Conference organizers
- Corporate event planners
- Trade show coordinators
- Professional development workshops
- Industry summits
This format helps potential attendees quickly understand the event’s value proposition and logistics while building credibility through social proof.
Educational Fact Sheet
Educational fact sheets transform complex learning concepts into clear, actionable frameworks.
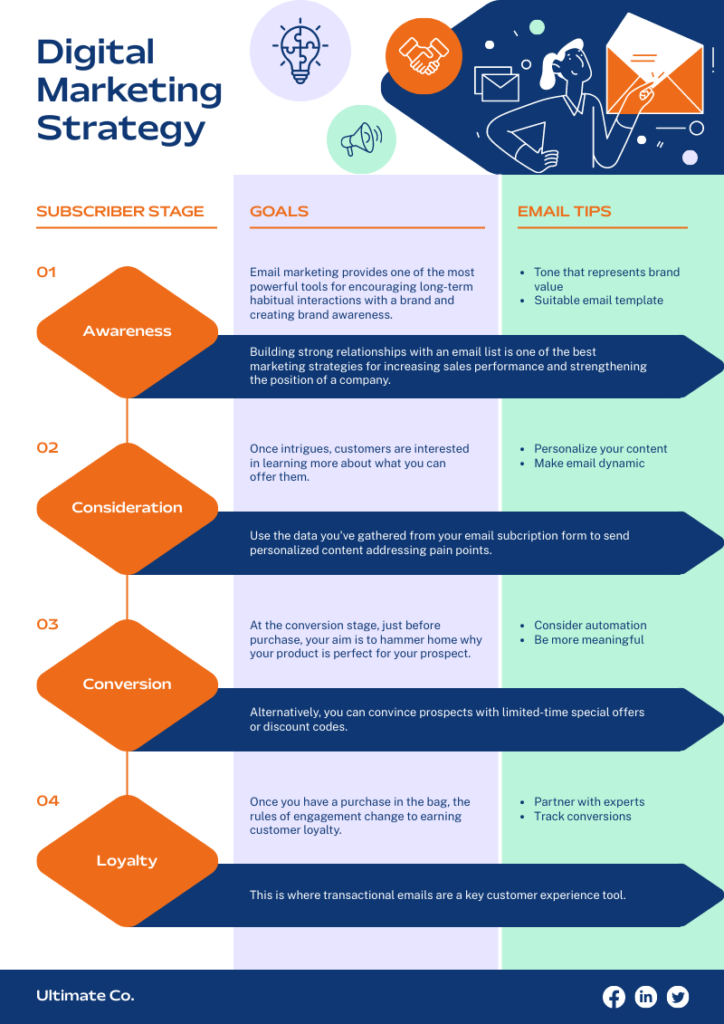
The vertical flow chart design breaks down sophisticated marketing concepts into digestible stages. Each phase is color-coded with matching goals and tips, creating an intuitive learning path. The consistent visual structure helps learners grasp the progression from awareness to loyalty.
Essential elements for educational fact sheets include:
- Clear learning objectives or frameworks
- Step-by-step progression
- Practical tips for each concept
- Visual hierarchy through color and shape
- Supporting explanations
- Action items or takeaways
Ideal for scenarios like:
- Professional development
- Course materials
- Training programs
- Process documentation
- Skill-building guides
This format helps learners understand complex concepts by presenting information in a structured, visually engaging way that emphasizes practical application.
Common Mistakes to Avoid When Creating a Fact Sheet
Your fact sheet can look stunning but still fail to land.
The most common culprit is usually overcrowding. Squeezing every available statistic onto one page does not signal thoroughness. It signals poor editorial judgment. White space is not wasted space. It is what makes your key data breathable and readable.
The second mistake is burying your lead. Your most important number, finding, or claim belongs at the top. Not paragraph four.
Last but not least is often inconsistent typography. Mixing three font sizes and two typefaces across a single page fractures the reader’s attention. As tempting as it is to make certain text really stick out, we risk ruining the flyer by not choosing the right font. The fix is pretty easy: pick a hierarchy, and stick to it.
One page. One message. One clear visual path.
Conclusion
Fact sheet rank among the best communication tools. They transform complex data and ideas into appealing visuals that capture attention. If you want to get to the core of the matter quickly, you’ll be hard pressed to find something better than a fact sheet.
Want to create your own? Head to our templates library, or create one with the help of our AI generator that we specifically trained for this.
Want to learn how to design fact sheets that truly pop? Check our design principles series for a dive deep into the world of design. Or get inspired by these creative infographic examples.
Remember — whatever you need to communicate, a well-crafted fact sheet will make your message more appealing.