Visme alternatives at a glance
| Tool | Free plan | Starting paid | Best for |
|---|---|---|---|
| Piktochart | Forever free, 60 AI credits/month, all templates | $14/month | Infographics, reports, marketing visuals, HR comms |
| Canva | Free, 200 Standard AI uses/month | $15/month | Broad design needs — social, presentations, video, print |
| Venngage | 5 designs cap, public sharing only | $10/month (annual) | Branded marketing collateral, form-style infographics |
| Infogram | Free with 10 project cap, no downloads | $19/month | Interactive charts, embedded data viz, media publishing |
| Adobe Express | Free with limited Premium features | $9.99/month | Adobe ecosystem users, quick social and print designs |
| Snappa | Free with 3 downloads/month | $15/month | Social media marketers needing fast graphics |
| VistaCreate | Free with 10 GB storage | $13/month | Animations, social posts, short videos |
| Beautiful.ai | 14-day trial only | $12/month | Presentation-first teams who want AI-assisted slides |
Pricing verified 2026-05-09. Looking for the head-to-head comparison? See our deep dive: Piktochart vs Visme.
Visme is a popular visual design tool, but it isn’t the right fit for every team. If you’re looking for alternatives — whether for pricing, free-plan limits, editor weight, or a specific use case mismatch — here are the options worth considering in 2026. Each alternative below includes its strengths, who it’s best for, and current pricing.
However, it’s not for everyone. There are certain limitations that might compromise your ability to create engaging graphics with ease. For example, many users don’t like that the fact that it doesn’t have a mobile app — Not to mention the limited storage space.
For a related read, see our guide on easelly vs piktochart.
So if you’re on the lookout for Visme alternatives, you’re in luck. In this post, we’ll show you what other options you have, apart from Visme, to design professional-looking visuals in no time.
The Best Visme Alternatives for 2026
The following list will help you find graphic design software similar to Visme while avoiding the limitations that impact your design experience.
- Piktochart — Best for businesses that need to communicate data internally
- Canva — Best for beginners looking for a multipurpose design tool
- Venngage — Best for marketing communication and data visualization
- Crello — Best for creating and sharing animations on social media
- Snappa — Best for social media marketers to quickly publish and share their designs
- Stencil — Best for bloggers and social media marketers
- Lucidpress — Best for users who need to design branding and print media
- Infogram — Best for users who want to visualize complex data sets
- Easil.ly — Best for educational institutions seeking an affordable tool
1. Piktochart — Best for marketers, HR teams, and consultants building infographics and reports

Piktochart is built around the visuals that don’t fit the social-tile format — long infographics, internal reports, HR comms, training decks, data summaries. The free trial is short (seven days, two lifetime PNG exports, then the account locks), but if you’re shipping infographics every month, the AI infographic generator and data widgets pay for the Pro plan inside a few hours of work.
Pros
- 1,000+ infographic templates across 20+ formats with native data widgets and live chart linking
- Pikto AI Studio includes infographic, video, and image generation — plus a ChatGPT plugin shipped in late 2025
- Pro plan starts at $14/month annual with 1,000 AI credits — competitive against Visme Pro at the seat level
- G2 4.5/391, Capterra 4.7/198, Trustpilot 4.7 — ratings hold up across all three platforms
Cons
- The free tier is a 7-day trial with 2 lifetime PNG downloads, not a forever-free plan — if you need an indefinite free tool, look elsewhere first
- Chart label crowding on dense data is the most-cited complaint in user reviews
- Layout and typography control trail Visme and Adobe Express for users who want pixel-level adjustment
- Template search and filtering could be sharper — finding a specific template can take more clicks than it should
Pricing
- Free trial: 7 days, 60 AI credits, 2 lifetime PNG downloads
- Pro: $14/month (billed annually) or $29/month (billed monthly) — 1,000 AI credits, premium templates, PDF and interactive exports
- Business: $24/month (billed annually) or $49/month (billed monthly) — 3,000 AI credits, brand kit, team collaboration
- Enterprise: Custom — SSO, dedicated success, advanced admin
Piktochart is the right tool if you’re shipping infographics, reports, or data-heavy comms more than once a month — marketers running quarterly reports, HR teams onboarding new hires, consultants packaging research for clients. It’s the wrong tool if you need a forever-free design tool, a print-shop level layout engine, or a social-tile factory.
If you’re comparing Piktochart against Visme specifically, our side-by-side breakdown covers pricing, feature gaps, and the kinds of work each tool handles best.
2. Canva — Best for general design across social, presentations, and marketing assets
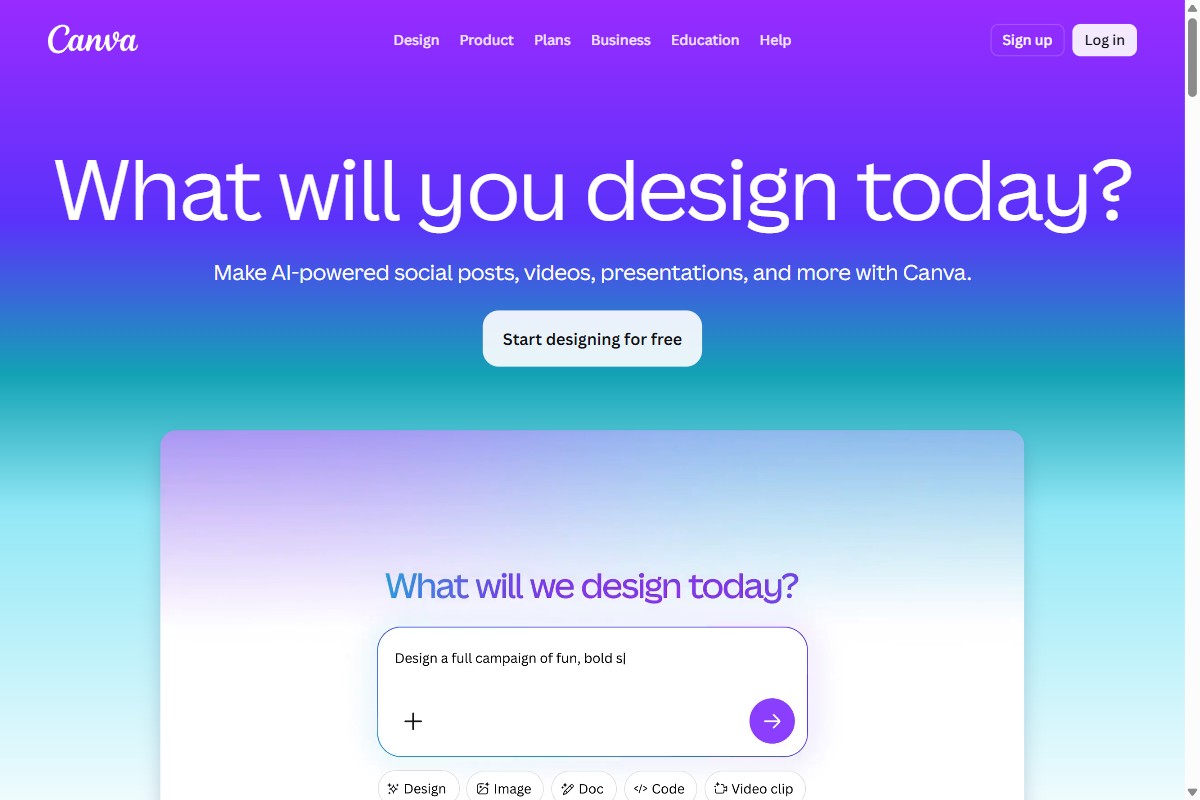
Canva is the broadest of the tools in this list. If you need one tool that handles social posts, slide decks, posters, T-shirts, and the occasional infographic, it’s the safe pick. The Visual Suite 2.0 launch in April 2025 added Canva Sheets and Canva Code, pushing the product further into productivity territory. The trade-off: Canva’s chart breadth and data binding stay shallow compared to infographic specialists like Piktochart and Visme.
Pros
- 4.5M+ templates across every format you can name — the broadest content library in the category
- Magic Studio AI bundles Magic Write, Magic Media, Veo 3 video generation, and Magic Edit into a shared credit pool — Free 50 lifetime, Pro 500/month, Business 500/seat/month
- Pro is single-user-friendly: $15/month gets one creator the full library, brand kit, and unlimited storage
- Business is genuinely cheap on annual billing at $10/seat/month with a 3-seat minimum, undercutting Adobe Express Teams in many configurations
Cons
- Trustpilot sits at ~3.5/5 even while G2 stays at 4.7 — almost every complaint is about cancellation, surprise renewals, or refunds
- Pro paywall creep is real and often noted in Reddit threads — features that were free in 2022 are now Pro-locked
- Chart breadth and data binding are shallow vs Piktochart and Visme — if your work is data-heavy infographics or analyst reports, Canva will frustrate you
- The October 2025 Creative OS rollout caused a rough mobile experience and a forced migration that drew widespread complaints
Pricing
- Free: 250K+ free templates, 5GB storage, ~50 lifetime Magic Studio uses
- Pro: $15/month or $120/year — full template library, brand kit, 500 AI credits/month, background remover, 1TB storage
- Business: $10/seat/month annual (3-seat minimum) or $20/seat/month monthly (no minimum) — admin console, brand controls, 500 AI credits per seat
- Enterprise: Custom — SSO, advanced security, unlimited AI
Canva is the right tool if your work spans many formats and few of them are data-heavy — social, decks, posters, marketing collateral. It’s the wrong tool if your weekly deliverables are long-form infographics, analyst reports, or chart-driven content where Piktochart and Venngage will serve you better.
If you specifically need a Canva alternative for infographic-heavy work, see how Piktochart compares to Canva on the data-viz dimension.
3. Venngage — Best for accessible data visualization and infographic-first teams
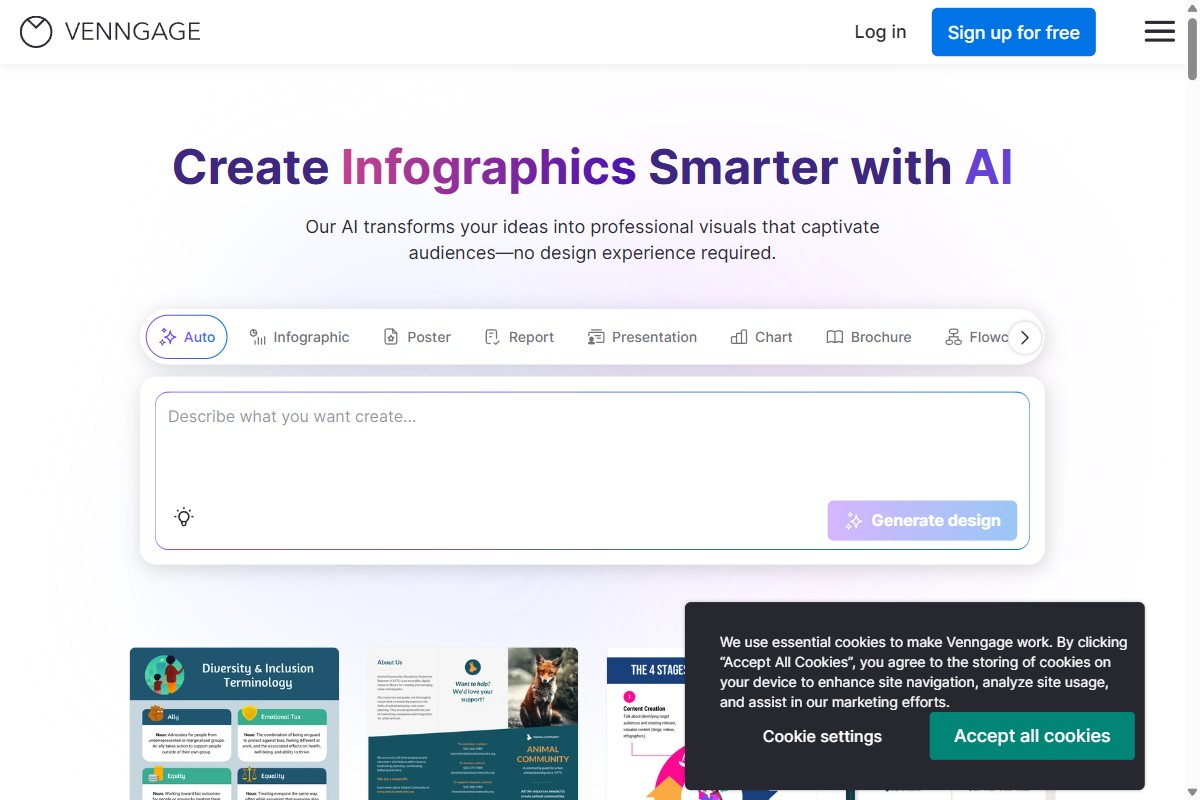
Venngage is the closest direct comparison to Piktochart in this list — both are infographic-first, both target non-designers, both ship AI-prompt and Smart Template features. The honest read: Venngage genuinely wins on data viz depth, accessibility tooling (WCAG-compliant chart templates), and template library size. Piktochart wins on a usable free tier and free-tier support. Pick by which trade-off matters more for your team.
Pros
- Strongest data viz in the category — 35+ chart types, native Google Sheets and CSV sync, ADA/WCAG-accessible chart templates
- 10,000+ template library, deeper than most competitors for infographic-specific templates
- Real shipped AI: prompt-to-infographic, Smart Templates auto-fill, AI brand kit logo extraction, AI translation, AI custom illustrations
- G2 customer service score 9.4 (vs Piktochart 8.5) — users consistently call out responsive support
Cons
- Free plan caps you at 5 lifetime designs, 6 image uploads, and zero downloads — you can only share via link with a watermark
- Premium pricing is per-user even at the individual tier, which adds up fast for small teams
- Editor UX is less polished than Piktochart for first-time users — learning curve is steeper
- Trustpilot 5.0/187 reviews carries a bias flag — the score looks inflated against G2 and Capterra norms
Pricing
- Free: 5 lifetime designs, 6 image uploads, link-share only with watermark, no support
- Premium: $10/month annual or $19/month monthly — unlimited designs, downloads, brand kit, AI features
- Business: $24/user/month annual ($49/user/month monthly) — team collaboration, admin controls, priority support
- Enterprise: From ~$499/month for 10+ seats — SSO, custom contracts, dedicated success
- Nonprofit discount up to 30%; Education at $99/year per instructor + 35 students
Venngage is the right tool if data visualization quality and accessibility compliance are non-negotiable — analyst teams publishing public reports, agencies serving regulated industries, educators building accessible learning content. It’s the wrong tool if you need a usable free plan or a faster onboarding curve.
If accessibility and data viz are your top priorities, Venngage is a strong pick. If you also need a usable free plan and broader format coverage, take a look at Piktochart — the trade-off goes the other way on those dimensions.
4. VistaCreate — Best for budget-conscious solopreneurs and social media managers
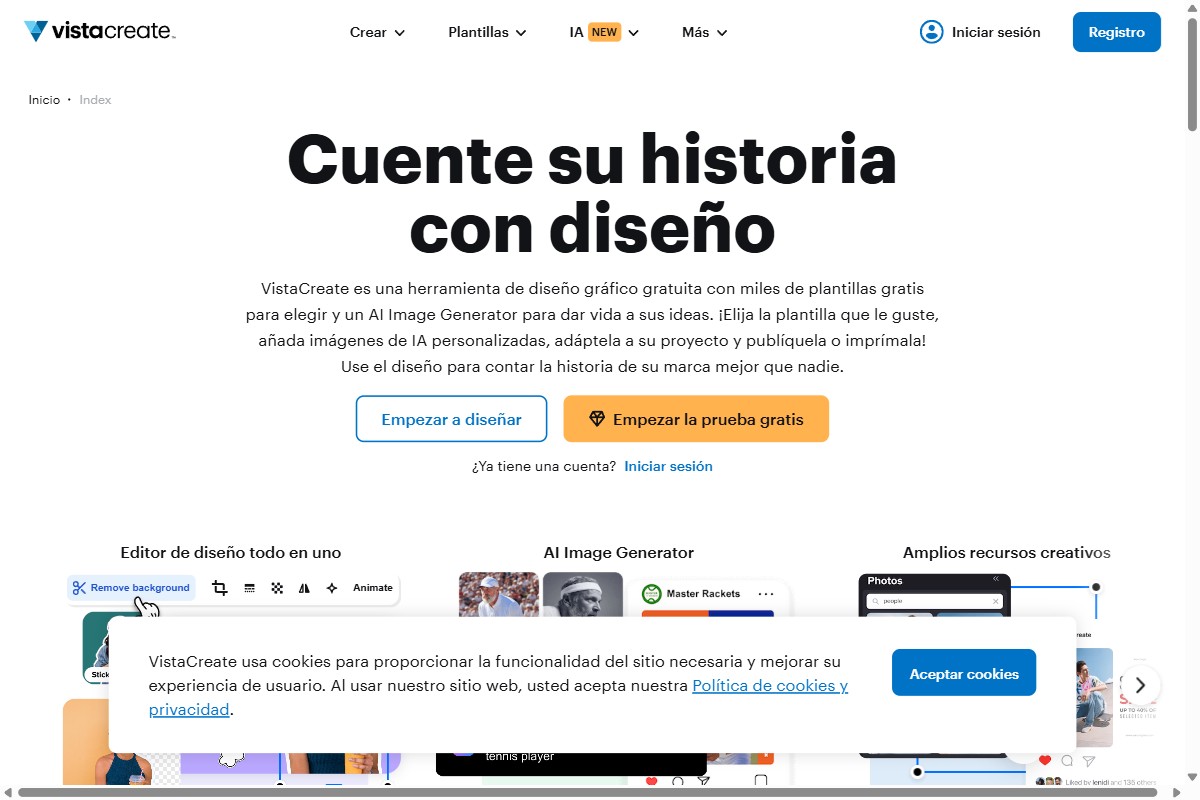
VistaCreate is what Crello became after Cimpress’s Vista picked it up in 2021 and rebranded it the following year. The product still leans into social: animated stories, Reels, TikTok templates, and a free Brand Kit (which Canva tucks behind its Pro paywall). For a one-person business or a small social team running daily posts on a tight budget, it covers most of what Visme does at the price of a streaming subscription.
Pros
- Animated social-media templates for Instagram, TikTok, and Reels are stronger than most tools at this price point
- Brand Kit, font upload, and team folder access are included on the free plan — Canva gates these behind Pro
- 200,000+ templates and 70M+ stock assets baked in, so most users never hit a content wall
- Pro plan undercuts Canva Pro and Visme Starter on annual price
Cons
- Trustpilot is dominated by billing complaints — auto-renewal, surprise charges, and a refund policy that voids itself the moment you’ve downloaded a single design in the past 14 days
- AppSumo reviewers repeatedly call it “Canva in 2017, not 2025” — the roadmap is quiet and recent updates are thin
- No SVG export, no PDF with bleed, hard cap of 10 team seats — not viable for print agencies, designers, or larger teams
- Infographic and data-visualization tooling is shallow compared to Visme or Piktochart
Pricing
- Starter (Free): Brand Kit, 70K+ free templates, basic export
- Pro: $10/month (billed annually) or $13/month (billed monthly) — full library, animation, background remover, commercial license
- Team: Pro pricing per seat, capped at 10 users
VistaCreate makes the most sense for solopreneurs, freelance social media managers, and small content teams whose work lives on social feeds and ad creative — not on print, not on long-form reports, not on infographics that need to carry weight. Set a calendar reminder for renewal day so you don’t get caught by the refund policy.
If you came to VistaCreate because Visme felt heavy and you’re posting more than you’re presenting, you’re in the right tool. If you need infographics, reports, or any kind of long-form data story, take a look at our Piktochart vs Visme comparison for a clearer fit.
5. Snappa — Best for one-off social graphics when you don’t need AI or interactivity
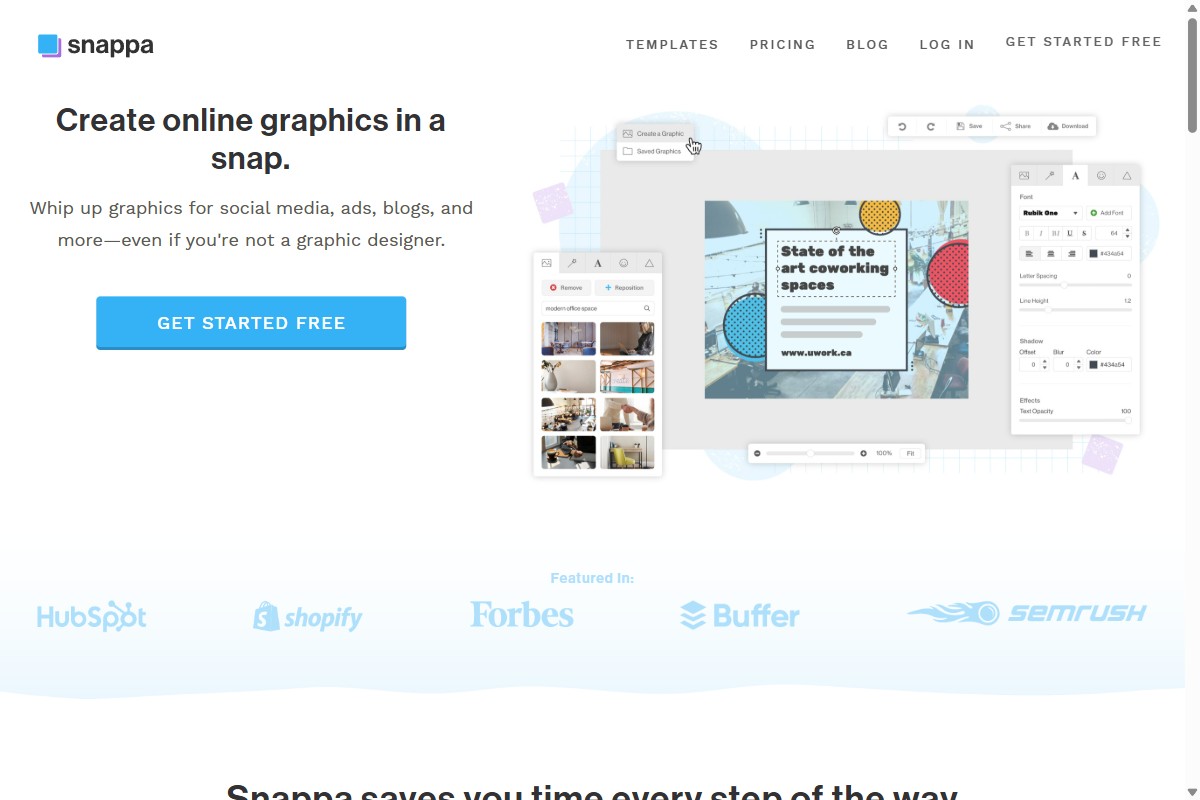
Snappa is the simplest tool in this list. No AI features, no interactive content, no mobile app, JPG and PNG export only. That’s a feature, not a bug, if your needs are equally simple — a Twitter card, a blog header, a quick promo graphic. Worth knowing: Snappa hasn’t shipped a major product update in over two years, and reviews trail off after 2023. The product still works, but you’re picking a tool in maintenance mode.
Pros
- 5M+ stock photos baked in — library is genuinely large for a tool this simple
- Drag-and-drop editor is the fastest learning curve in this list — you can ship a graphic in under 5 minutes from sign-up
- Pro at $10/month annual covers unlimited downloads, brand kit, and team folders without seat-pricing friction
- Background removal is one click and works well for product shots and portraits
Cons
- No AI features — not text-to-design, not magic edit, not AI image generation. If AI matters, Snappa is the wrong tool
- Maintenance-mode signals: footer dated 2025, no public changelog, no recent feature launches, ~570 LinkedIn followers
- Export is JPG and PNG only — no SVG, no PDF, no editable formats
- No mobile app, and no signal that one is coming
Pricing
- Starter (Free): 3 downloads per month, basic templates
- Pro: $10/month (billed annually) or $15/month (billed monthly) — unlimited downloads, brand kit, custom font upload
- Team: $20/month for up to 5 users (billed annually)
Snappa is the right tool if your design needs are genuinely simple and you don’t want to pay for AI or interactivity you’ll never use. It’s the wrong tool if you need infographics, reports, AI-generated content, vector or PDF export, mobile editing, or a tool you can commit to for years.
If you’ve outgrown Snappa or want a tool with active development and AI built in, Piktochart covers infographics, reports, and AI generation in one product.
6. Adobe Express — Best for Creative Cloud users and teams who want Adobe quality without the Adobe complexity
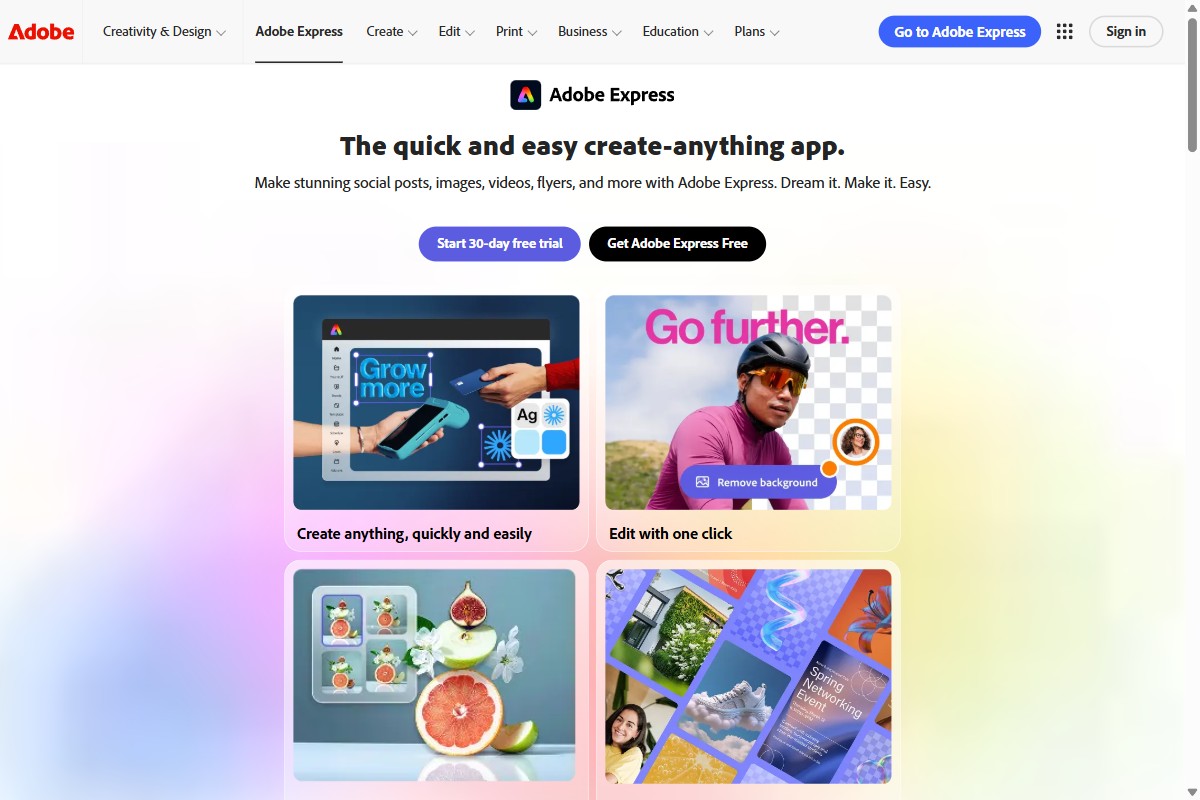
Adobe Express is the rebuilt successor to Adobe Spark, now positioned as Adobe’s answer to Canva. For Creative Cloud subscribers it shows up as a free, integrated extension of the suite — pull a Photoshop file in, edit a quick social asset out, hand it back. For teams shopping for a Canva alternative, the surprising hook is the seat price: Adobe Express for Teams is materially cheaper than Canva Teams.
Pros
- Firefly generative AI is genuinely competitive — Reddit and review-site verdicts consistently call its output more “design-grade” than Canva Magic Studio
- Adobe Stock (147M+ assets), Adobe Fonts, and round-trip with Photoshop and Illustrator give designers a real ecosystem moat
- Teams pricing at $7.99 per seat undercuts Canva Teams ($20 per seat) — a strong angle for marketing and HR teams already buying Adobe
- Free plan is unusually generous for an Adobe product, including Firefly credits, templates, and brand kit
Cons
- The “$9.99 a month” lead price is misleading once you include Creative Cloud apps and Stock — Reddit and Trustpilot users repeatedly mention real total cost being 5–7x the headline
- Cancellation friction is the loudest reputational issue: lockout fear, billing surprises, and Adobe’s annual-plan early termination fee come up across Trustpilot, Capterra, and Hacker News
- Export is flat only (PNG, JPG, PDF) — no editable round-trip back into Photoshop or Illustrator
- Data visualization, interactive content, and charting are weaker than Visme and well behind Piktochart for infographics
Pricing
- Free: Templates, Firefly Generate credits, basic editing, brand kit
- Premium: $9.99/month — full template library, premium fonts and stock, video editing, scheduling
- Teams: $7.99 per seat per month (annual billing) — admin console, brand controls, team libraries
Adobe Express is the right call if you already pay for Creative Cloud, if your team is buying group licenses and Canva’s seat pricing is biting, or if you specifically need Firefly’s image generation in your workflow. It’s the wrong call if you need explainer videos, interactive content, complex charts, or infographics that carry data — that’s Visme territory, and Piktochart territory.
If your team is comparing Express against Canva right now, the seat price is the conversation worth having. If your team is comparing it against Visme because you need infographics and reports, take a look at the Piktochart vs Visme comparison — it’s the closer like-for-like fit.
7. Beautiful.ai — Best for executive and sales decks where brand consistency matters more than design freedom
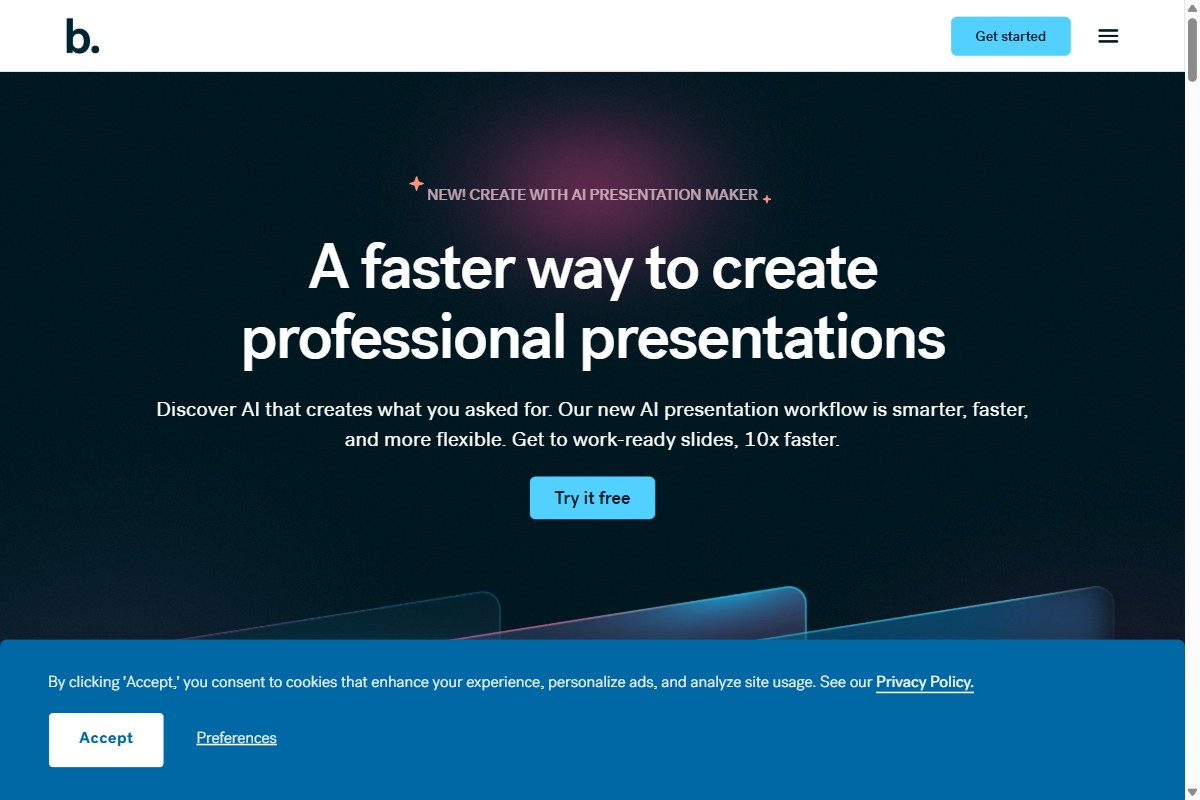
Beautiful.ai is the presentation specialist in this lineup. Smart Slides do the layout work for you — drag a chart in, the slide auto-balances; add a sixth bullet, the type scales. It’s a love-it-or-fight-it interaction. Sales teams shipping branded decks at speed tend to love it. Designers who want to nudge a logo two pixels left tend to fight it.
Pros
- Smart Slides auto-design saves real time on first drafts — G2 reviewers consistently cite 50–75% faster turnaround
- DesignerBot AI generates a full deck from a prompt in under two minutes, which is enough for most board-update or pitch use cases
- Brand controls on the Team plan keep multi-rep sales decks visually consistent without policing every slide
- Salesforce and Slack integrations cover the most common B2B sales-enablement workflow
Cons
- No free plan — only a 14-day trial that requires a credit card and auto-bills, with a “we don’t provide refunds” policy that drives Trustpilot to 3.1 even while G2 sits at 4.7
- PPT export is documented-lossy by Beautiful.ai themselves: animations strip, web fonts substitute, text blocks break into shape objects. They published a blog post titled “How to Export to PPT and Why You Shouldn’t”
- Real-time collaboration and version control are Team-only — solo Pro users can’t co-edit a deck
- Smart Slides cage anyone who needs unconventional layouts — you can’t reposition elements freely, can’t add a second content block per slide, and DesignerBot can’t build complex diagrams like quadrants or flowcharts
Pricing
- Pro: $12/month (billed annually) or $45/month (billed monthly) — single user
- Team: $40 per seat per month (annual, 2–20 seats) — adds real-time collaboration, brand controls, version history
- Enterprise: Custom — single sign-on, advanced admin, dedicated support
- No free tier. 14-day Pro trial requires a credit card
Beautiful.ai is the right tool for sales teams, exec assistants, and consultants who ship branded decks weekly and value speed-to-good-enough over pixel control. It’s the wrong tool if you need a free option, if your audience reviews decks in PowerPoint with edits, or if your slides regularly include custom data visuals or non-template layouts.
If your work is presentations, Beautiful.ai or Gamma is a closer comparison than Visme. If your work is infographics, reports, and data stories that happen to sometimes get presented, you’ll get more out of Piktochart — see the Piktochart vs Visme comparison for a like-for-like fit.
8. Infogram — Best for journalists and analysts publishing interactive, embeddable charts
Infogram, owned by Prezi, is the data-viz specialist in this lineup. Where Visme covers the full content range, Infogram goes narrow and deep on charts, maps, and embeddable interactive infographics — the kind a newsroom or analyst report needs to live inside an article. The product reputation on review sites is strong. The commercial reputation on Trustpilot is not.
Pros
- 35+ chart types and 13 map types on the free plan, expanding to 800+ map types on Pro — broader coverage than most generalist tools
- Live data linking from Google Sheets, JSON, and direct API feeds — charts update on their own once embedded
- Interactive, embeddable HTML output is genuinely better than Visme’s for journalism, dashboards, and analyst reports
- G2 scores Infogram higher than Visme on Graphs and Charts (9.2 vs 8.8) and Reports Interface (9.1 vs 8.1)
Cons
- Trustpilot reviewers describe billing as “predatory” — auto-renewal traps, no pre-billing warning, and absolute refusal to refund even on same-day requests
- The free plan now blocks downloads entirely and stamps a watermark on everything, which is a noticeable tightening from previous years
- AI text-to-design and content variety lag behind Visme — if you want to prompt your way to a finished asset, this isn’t the tool
- The jump from Pro ($19) to Team ($149) is steep, with no middle option that includes real-time collaboration
Pricing
- Free (Basic): 35+ chart types, 10 projects, watermarked, no downloads
- Pro: $19/month (billed annually) — 800+ map types, 1M images and icons, AI image maker, live data, HD downloads
- Business: $67/month — white-label, custom branding, team folders
- Team: $149/month for 3–10 users — real-time collaboration, advanced permissions
- Enterprise: Custom
Infogram is the right tool for data journalists, financial analysts, and content teams whose deliverable is a chart or interactive infographic embedded inside an article or report. It’s the wrong tool if you primarily build long-form static infographics, want a generous free plan, or are sensitive to the kind of cancellation policy that has dominated its Trustpilot page.
If you live inside chart workflows, Infogram or Datawrapper will fit your hands better than Visme. If your data work eventually has to live inside a long-form infographic or a branded report, see how Piktochart compares to Visme — that’s where the use case bends back toward us.
Frequently asked questions
What is the best free Visme alternative?
Piktochart’s free plan is the most generous — it’s forever free, includes 60 AI credits each month, and gives you access to every template with no watermark on exports. Canva’s free plan is broader in design types but tighter on AI usage (200 Standard AI uses/month).
Why are people looking for Visme alternatives?
The most common reasons are pricing on small teams, free-plan limits (Visme’s free plan watermarks downloads, blocks premium templates, and limits storage to 250 MB), and the editor weight when teams only need infographics and reports rather than animation and lead-capture forms.
Which Visme alternative is best for infographics specifically?
Piktochart and Venngage are both built around infographics and reports as primary deliverables. Piktochart leans into AI-generated infographics and broader use cases (HR comms, internal reports, marketing visuals). Venngage leans into branded marketing collateral and form-style infographics. For a head-to-head, see our Piktochart vs Visme comparison.
Can I migrate my existing Visme designs to a different tool?
Yes. Export your existing Visme designs as PDF or PNG (use Visme’s download options to grab clean copies). Then create a free account on your chosen alternative and rebuild from a similar template. Most teams complete the switch in an afternoon.
Conclusion
Visual content has the power to draw more attention than regular text. It also makes the information you want to convey easy to digest and memorable. No wonder professionals are investing heavily in visual content, regardless of whether they are communicating inside or outside their organizations.
So it’s obvious that you shouldn’t miss out on this opportunity to engage your audience like never before. But what can you do if you’re not a professional designer and Visme isn’t working for you?
Well, now you have your answer. In this article, we have tried to ensure that no matter what’s holding you back, it’s not for the lack of options. You have plenty of Visme alternatives to pick from. So give them a try and see what works best for your needs. Happy hunting!