Project updates can be as important as the projects themselves. A recent survey of 500 companies revealed most businesses surveyed produce at least five reports per month, and employees spend an average of three or more hours creating each.
Failure to give an effective update may mean you miss out on important opportunities because leadership didn’t understand your project’s significance, or because your team members did not understand how to move the project forward. Fortunately, crafting a progress report that’s useful and engaging relies on answering just three questions:
- Who is your audience?
- What is the best way to present information to them?
- How often do they need progress reports?
In this article, you’ll get answer to these questions and show how you can use Piktochart to give project updates quickly and more efficiently.
How to give project updates based on your stakeholder type
Start by considering your audience. For work presentations, stakeholders typically fall into three categories: executive stakeholders, team members, and external partners or clients.
To create a project update matching their needs, you need not write differently so much as choose a format and information level appropriate for each group.
Executive stakeholders
- What fits: High-level summaries, easily digestible takeaways, visual storytelling
- What to avoid: Getting into the weeds with your data, huge walls of text
- Best formats for this audience: Dashboards, one-pagers focused on Key Performance Indicators (KPIs), Objectives & Key Results (OKRs) and other familiar metrics
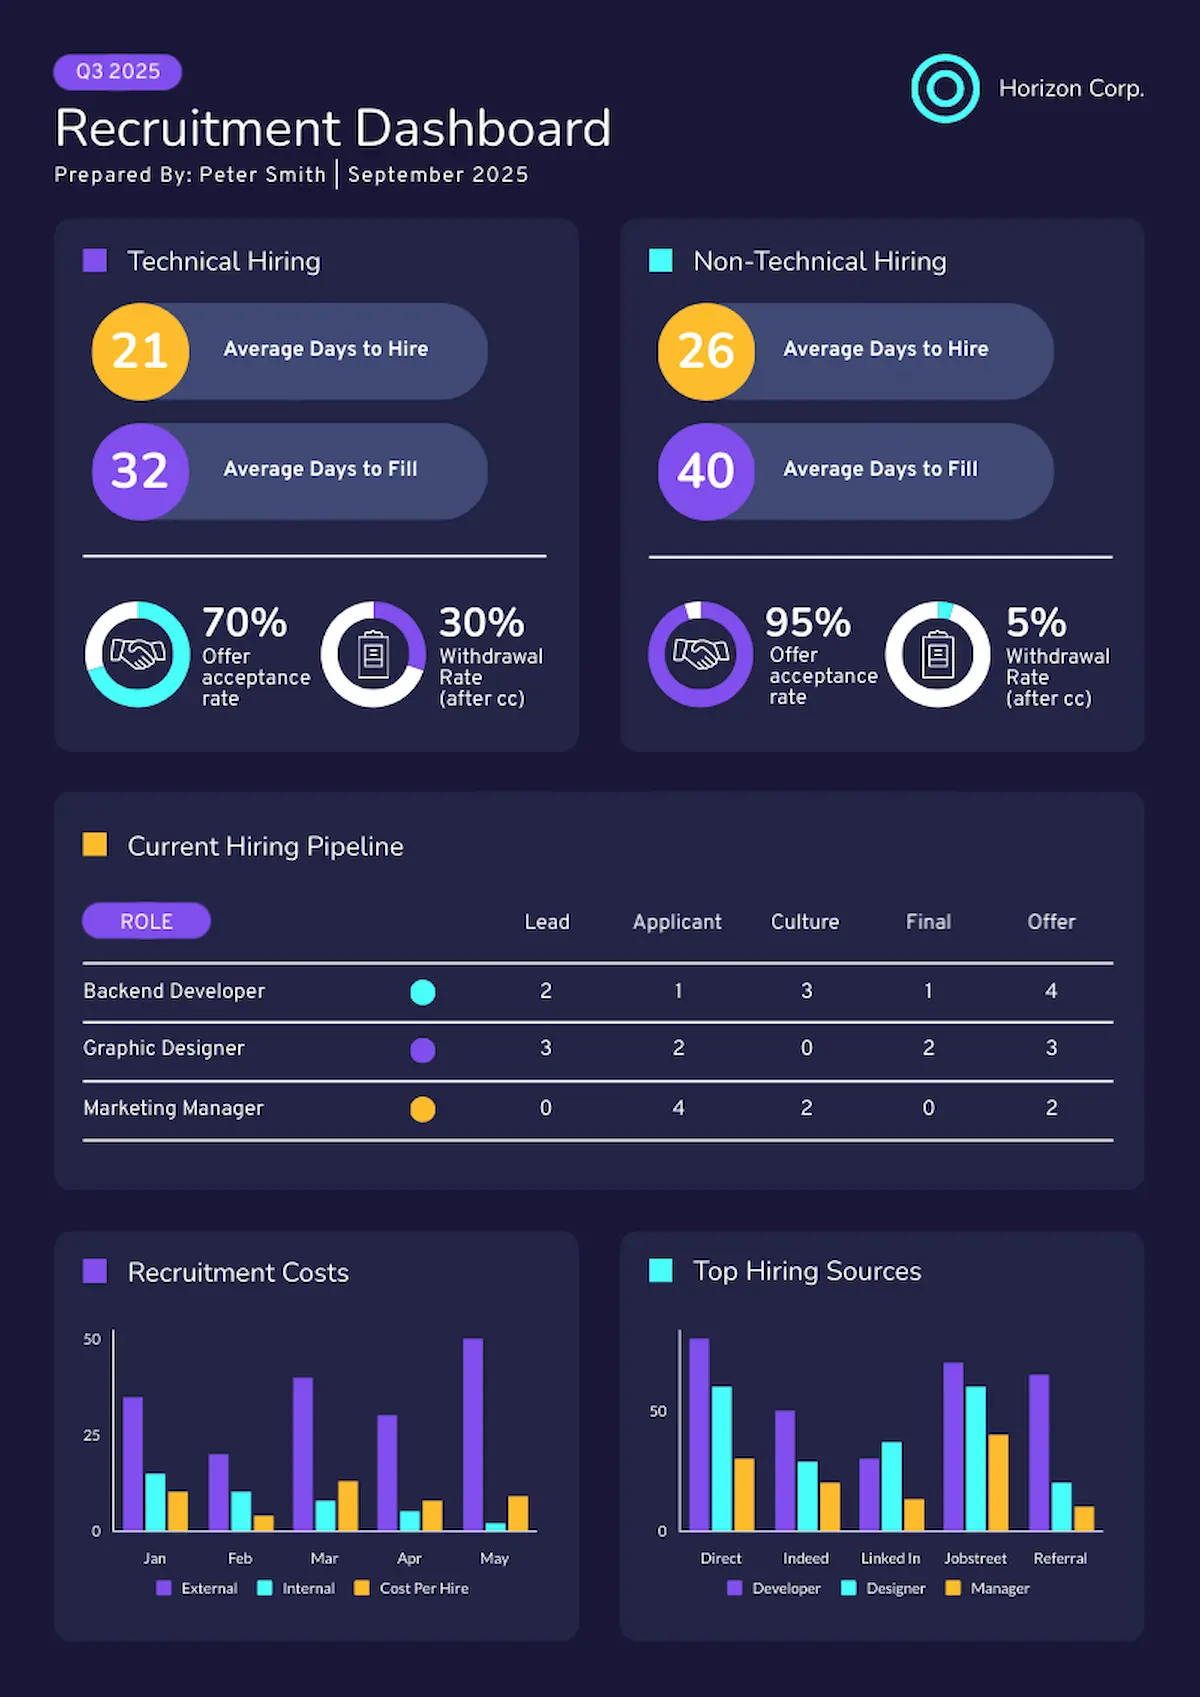
Here’s an example of a dashboard template that communicates quarterly recruiting highlights. Everything a C-level needs appears at a glance—hiring metrics, costs, and sources—without operational clutter.
Team members
- What they need: Operational details, space to report and resolve challenges, links from current results to next steps
- What to avoid: Designs that ignore challenges, templates lacking specifics
- Best formats for this audience: Team standup templates, sprint progress reports
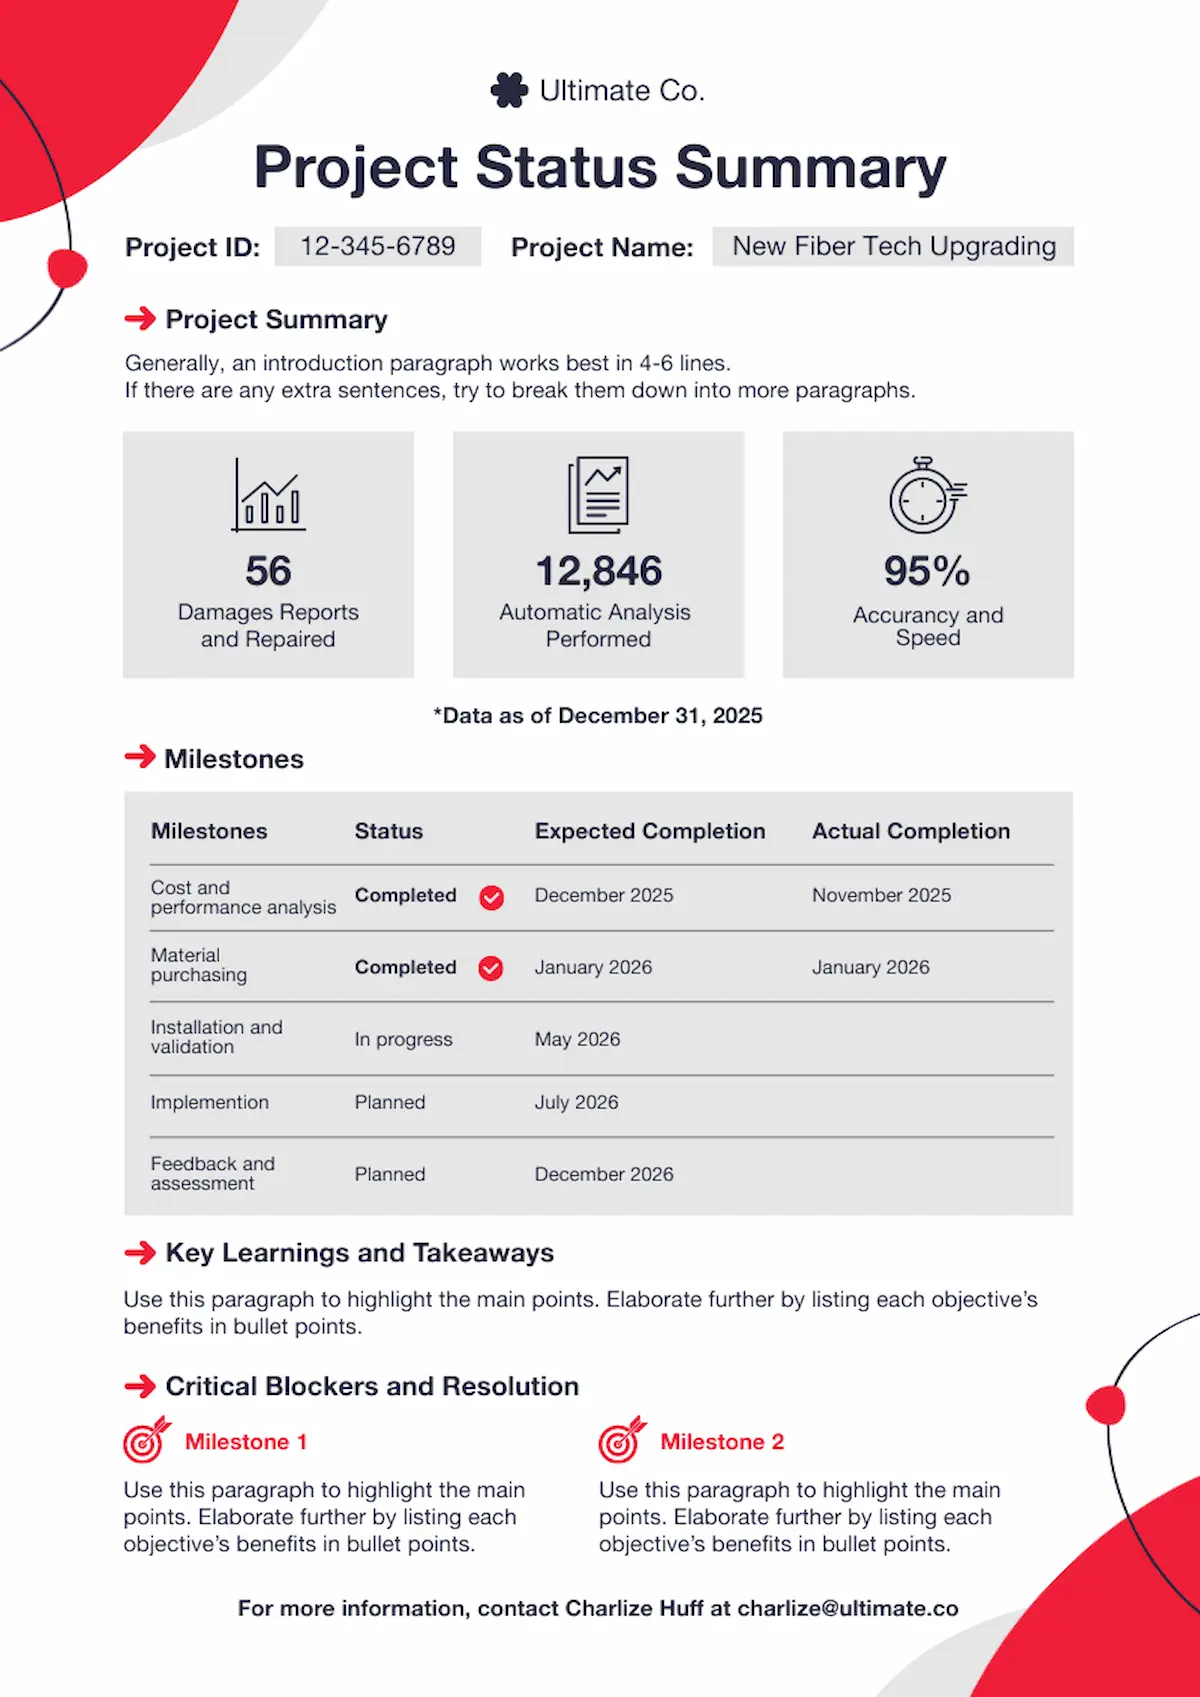
This project progress template is a great example of a team report. Key achievements get the headline treatment, followed by a review of the project timeline and next steps in the sequence. As a result, teams see exactly what’s done and what’s blocking progress.
External partners and clients
- What’s to know: Milestone achievements, big-picture financials, status updates on deliverables
- What to avoid: Operational details unrelated to their role
- Best formats for this audience: Traditional slide deck
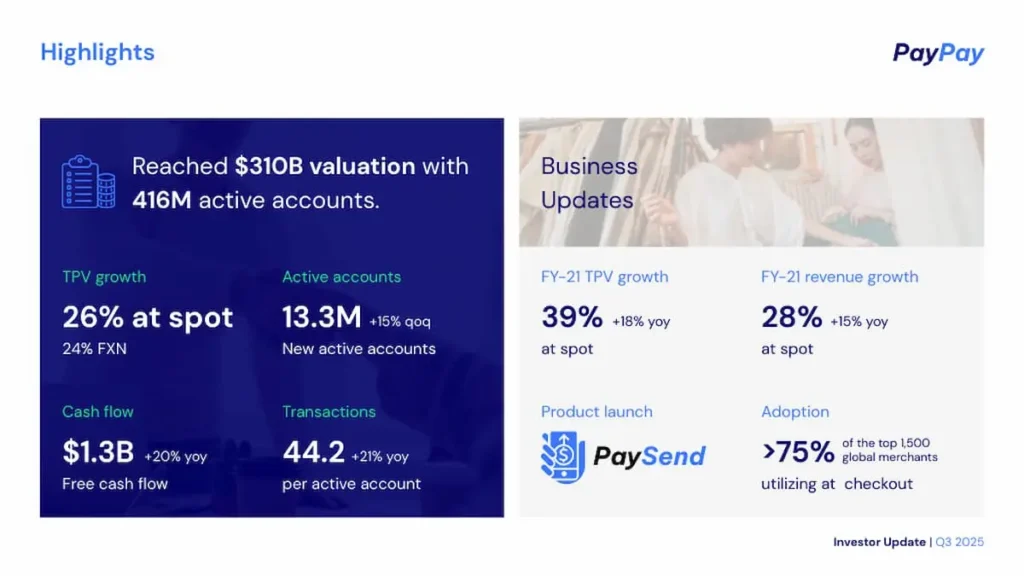
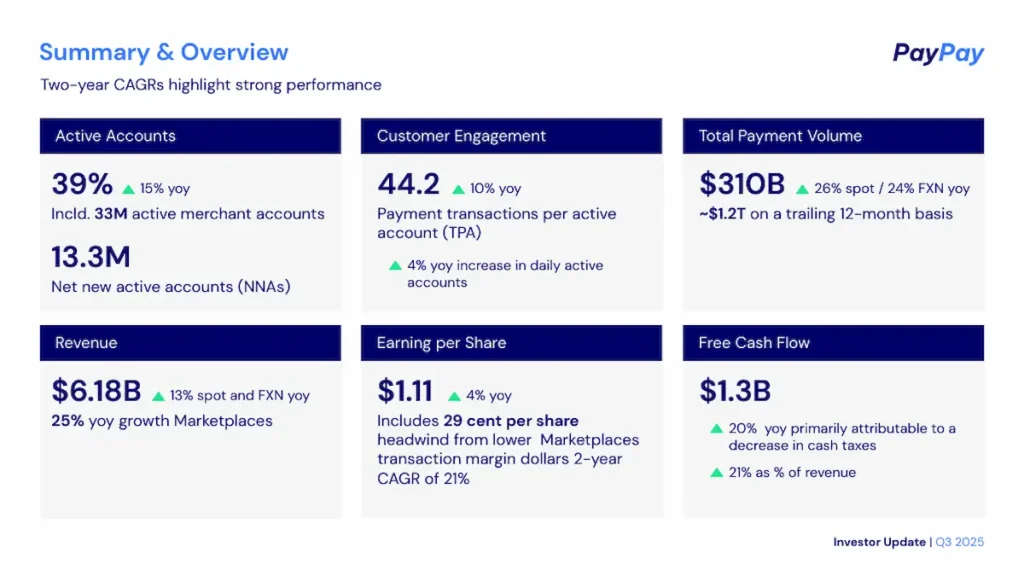
This investor update template is geared to the needs of outside stakeholders and partners. The slides present statistics on increased valuation, revenue growth, customer engagement and other financial metrics in an engaging, visual manner.
Presenting a project update visually
Next, select a visual presentation method. Whether creating your progress report from a Piktochart template or trying our AI report generator tool, use a format suiting your audience.
Information dashboard updates
Dashboard templates appeal to high-level stakeholders because they focus on top-line takeaways. You see the project’s real-time status with a glance, and your audience gets the information they need without extensive exposition.
This social media monthly update template uses the dashboard format to share all the relevant stats from a comprehensive multi-channel marketing strategy. As with real-life dashboards in cars, each metric can be read separately. Combined, the components deliver a comprehensive status picture.
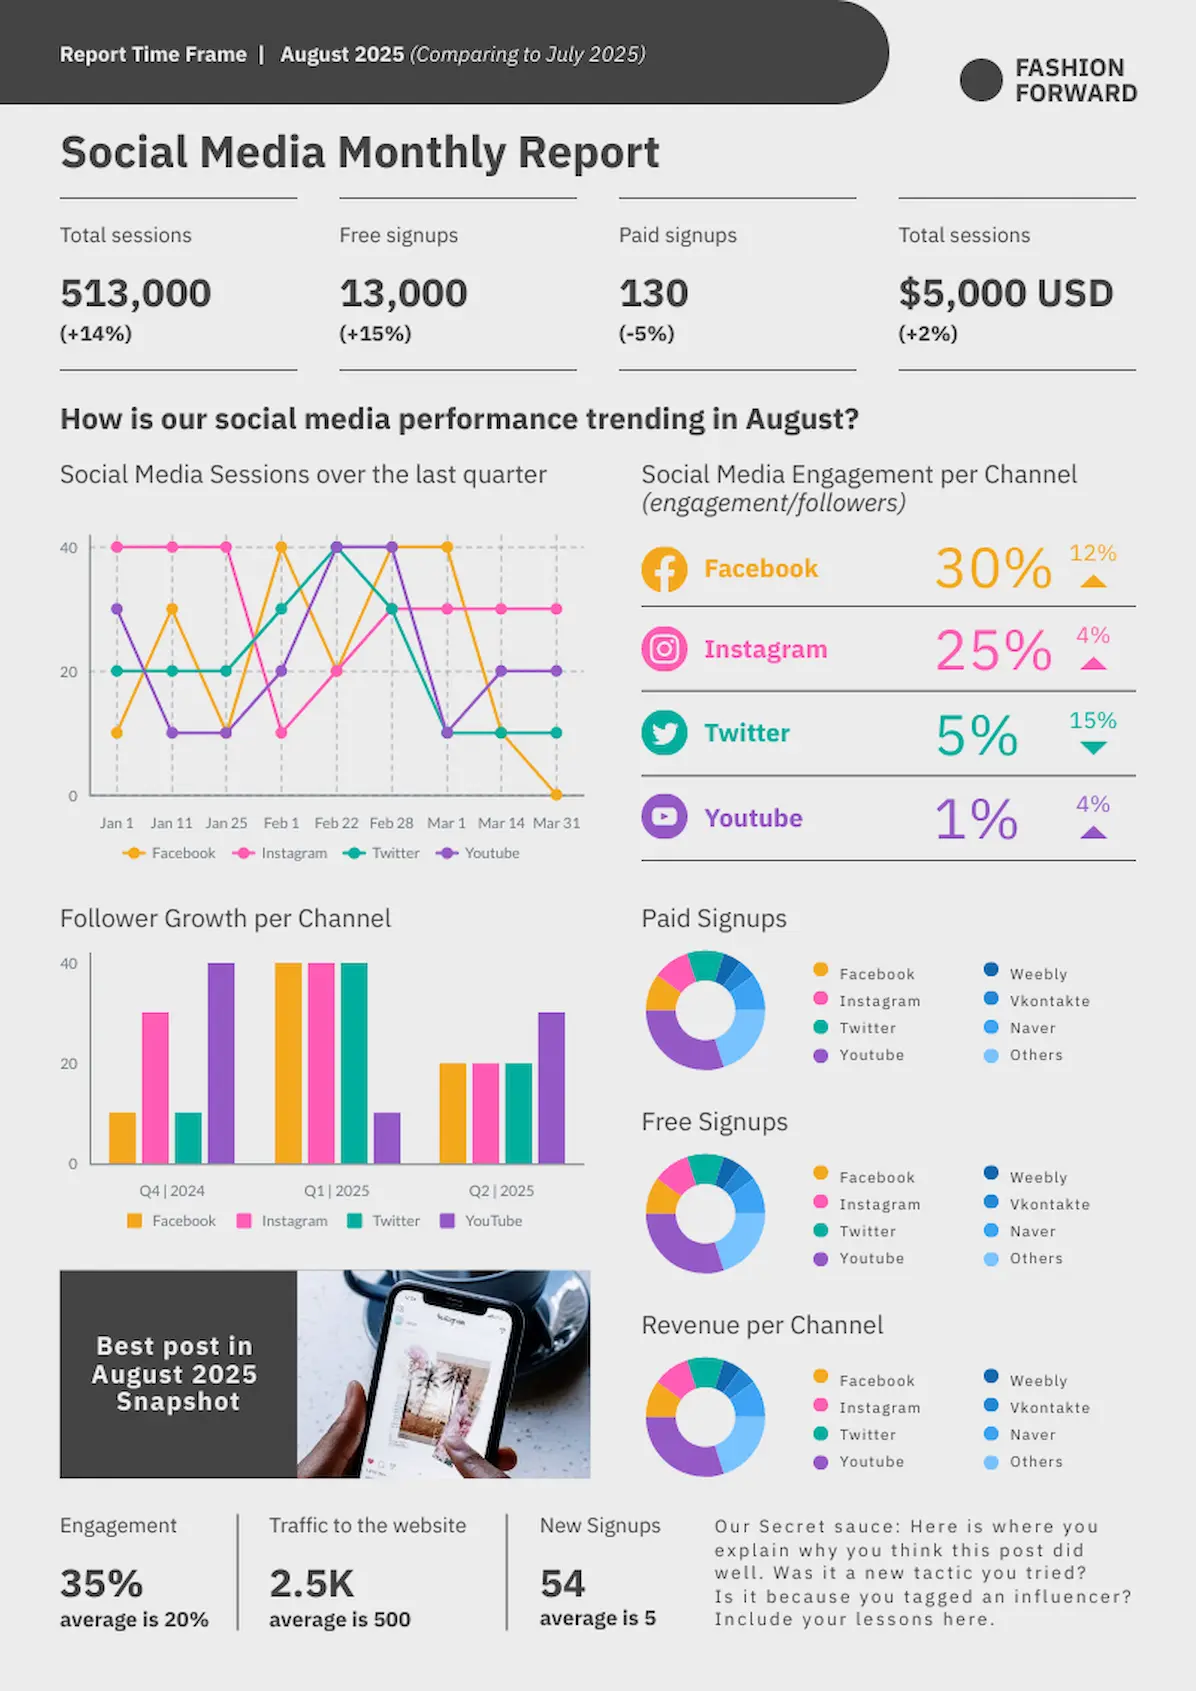
- When should I use this?: For sharing multiple data sets that function independently of each other.
- How much information should I include?: Enough charts, graphs and metrics to provide a comprehensive picture of your progress.
- Visual advantage over text: Provides a holistic, at-a-glance image of your work.
Infographic updates
Infographics are a great choice for project updates when you have a lot of data and need to describe complex progress metrics or milestones. They differ from dashboards in that they are story driven; a single narrative unites the entire presentation. To demonstrate, let’s examine an infographic focused on recruitment statistics.
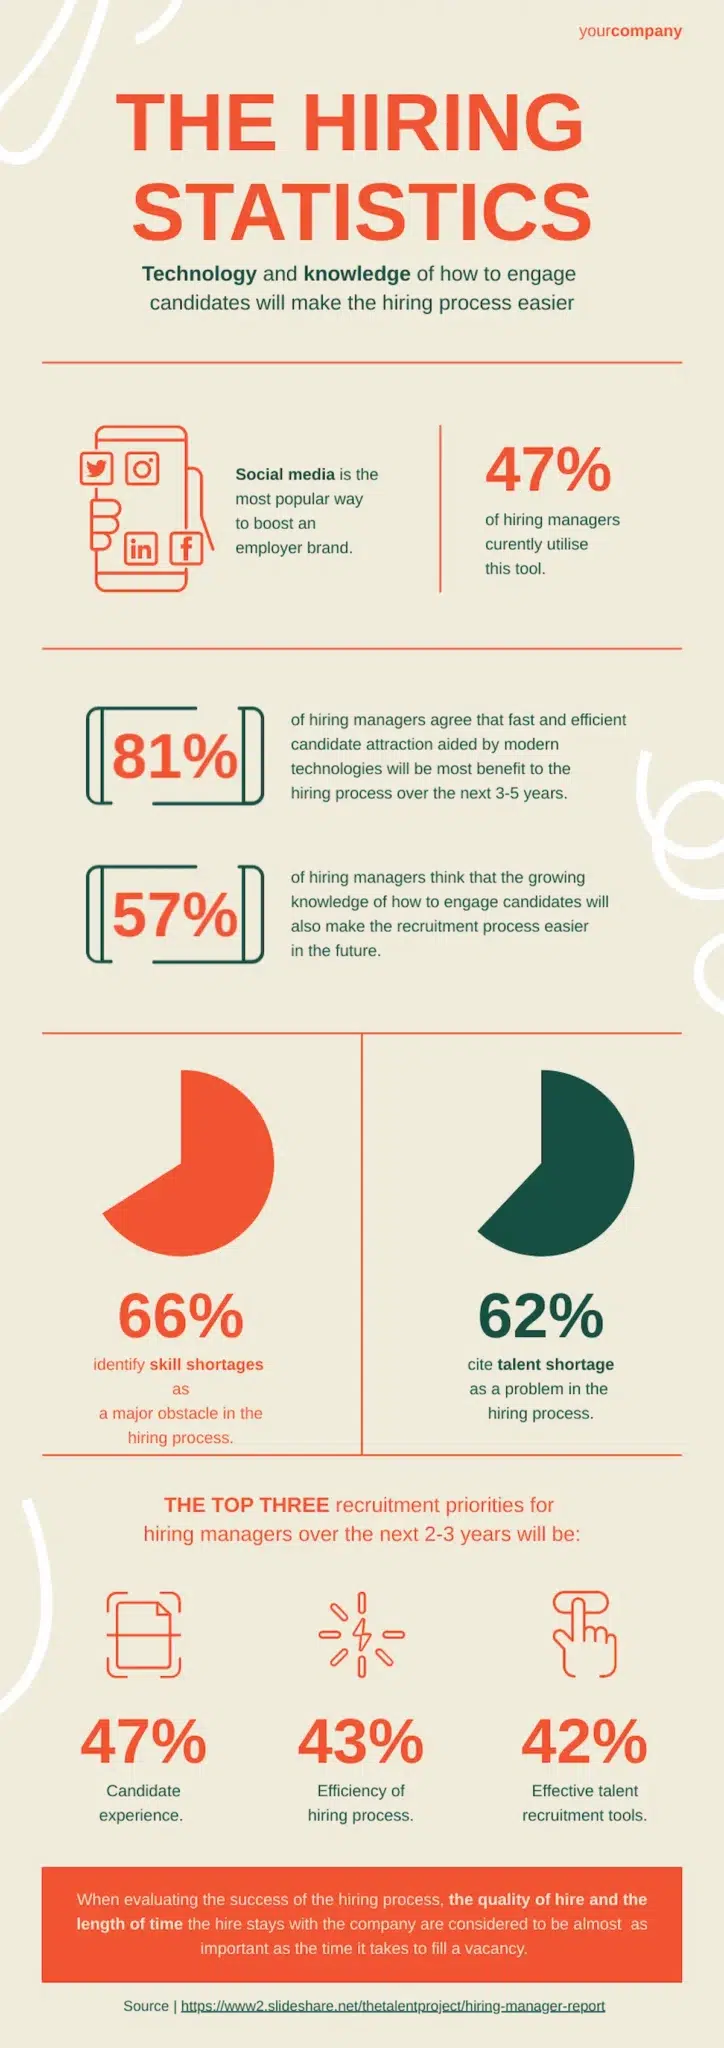
- When should I use this?: When you need to tell a persuasive story with your data.
- How much information should I include?: You need the RIGHT data to tell your story; quantity should take a back seat to quality.
- Visual advantage over text: Livens up a parade of dry facts and statistics.
Presentation slide deck updates
Everyone’s seen project updates delivered as slide deck presentations. Done well, a presentation-style update answers critical questions and identifies work already done, along with (potentially) work yet to be done, in an engaging format.
This consulting project roadmap presentation can be used at a kickoff meeting or to report progress during a project’s early stages. With a vibrant color palette and a breakdown of the project phases, the tempo of progress is carefully outlined.

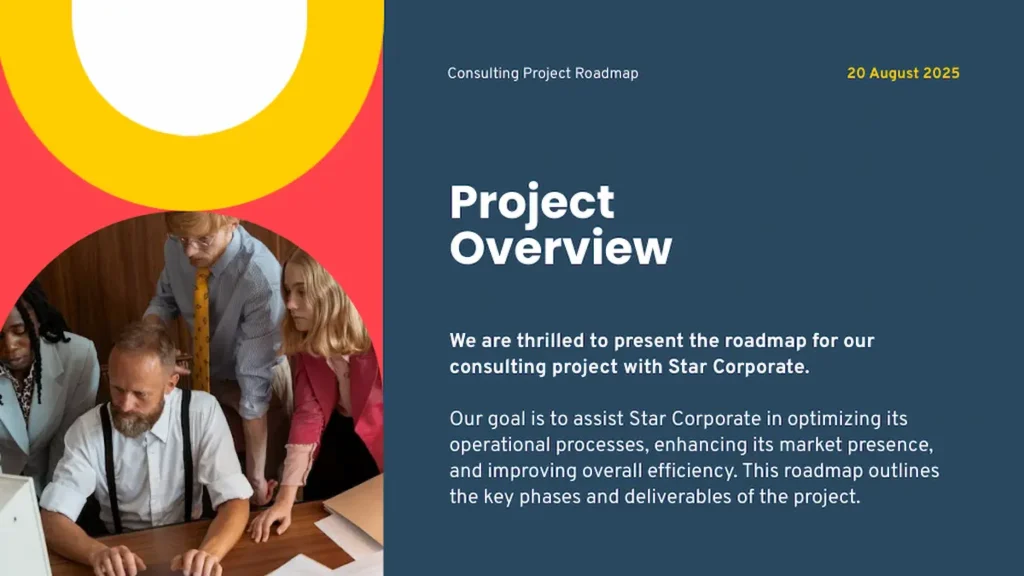
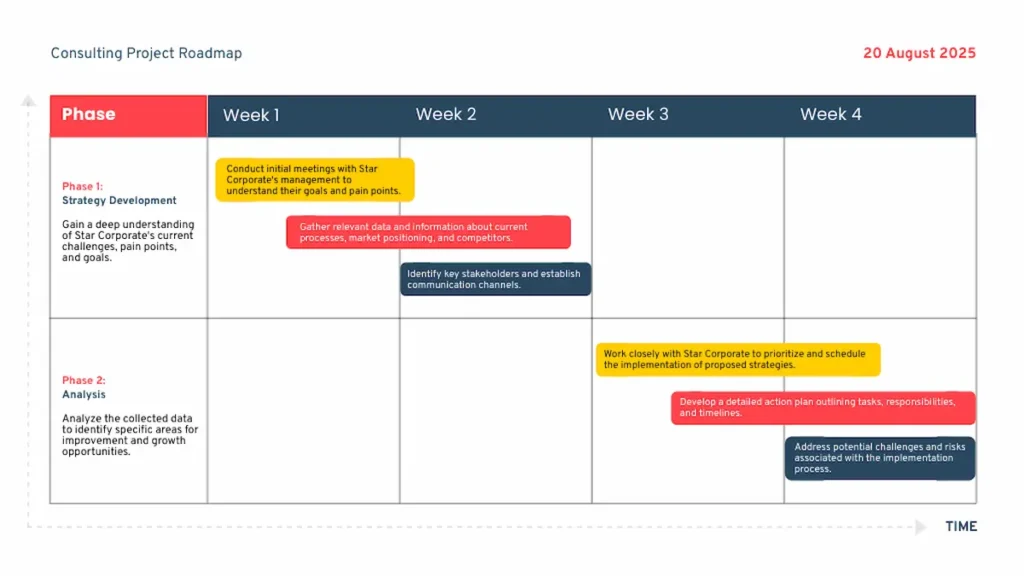
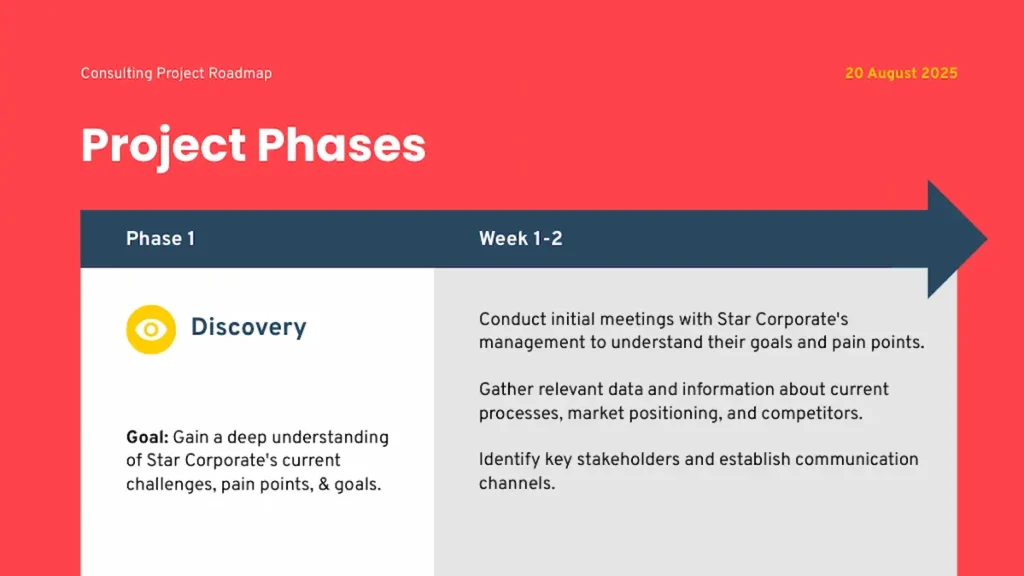
- When should I use this?: When you need to communicate progress with text, numbers and icons/images.
- How much information should I include?: In general, fewer slides are better, but complex updates may require a longer presentation.
- Visual advantage over text: No one wants to read a text-dense printed handout!
What information to share and when in your project update
Regardless of audience or chosen format, the frequency of your project updates will determine how much information to deliver.
Daily updates
If you provide daily progress reports, your choice of format can vary dramatically. What most daily updates have in common is that they provide minimal information. There’s no need to go into great detail when you’ll be providing another update tomorrow.
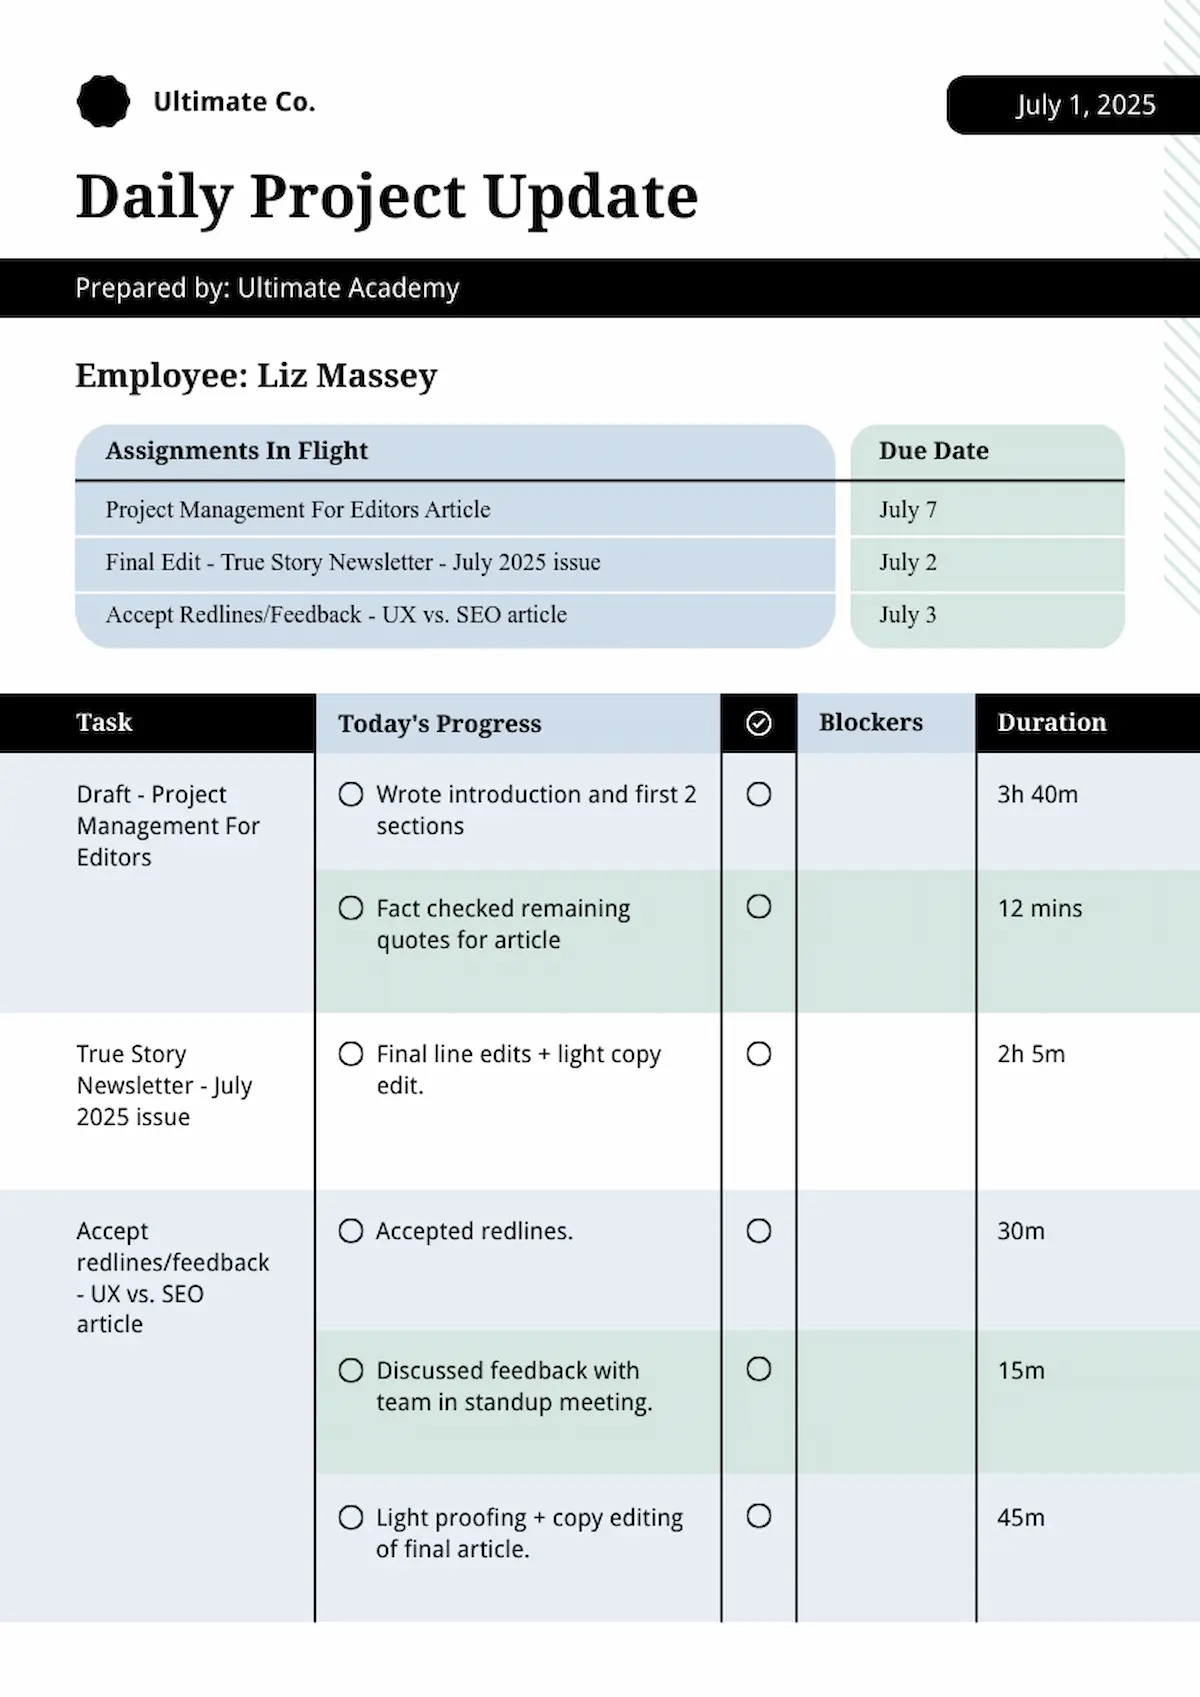
For example, a number of years ago, I worked for a manager who required me to provide a list of projects I had worked on that day, and let them know what I had gotten done. We both found my numbered list a sufficient report, but on days when I was busy, it did turn into a “wall of text.”
Piktochart’s modern coaching program planner template can be adapted into an easy daily update format. In less than five minutes, I was able to tweak the design to include sections for in-flight projects, time logs, and a small visual indicator (the check mark in the circle) column marking tasks completed that day.
Weekly updates
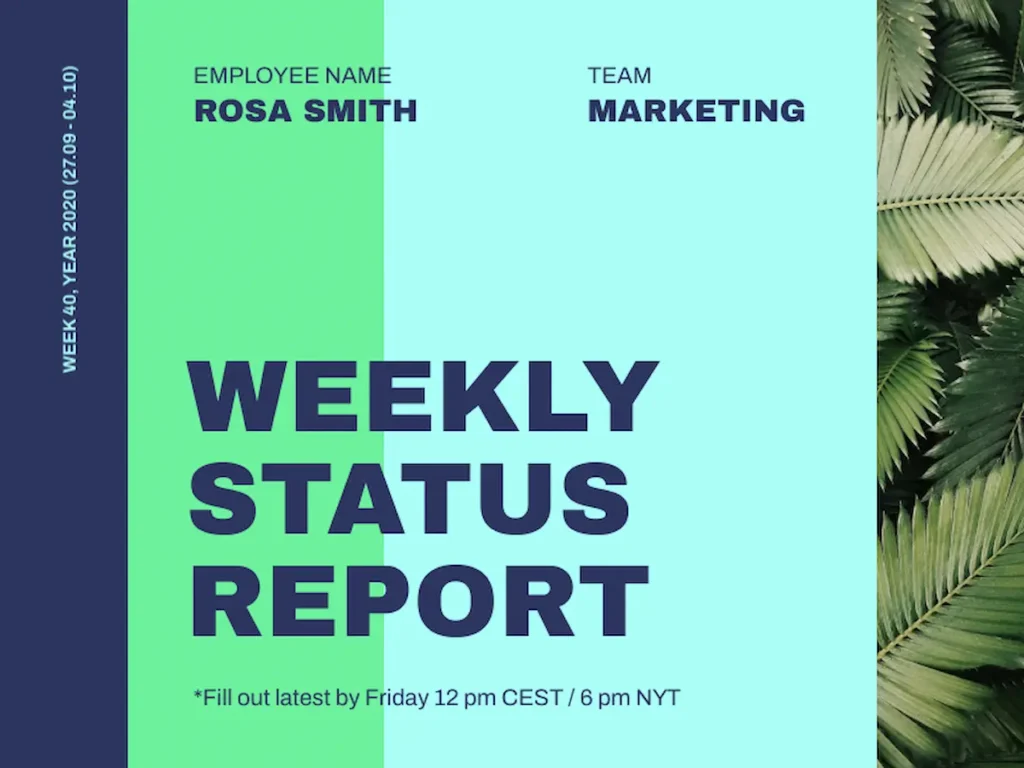
Zooming out from reporting daily to reporting weekly, the focus moves from bite-sized notes to more comprehensive discussions of progress and concerns about upcoming priorities.
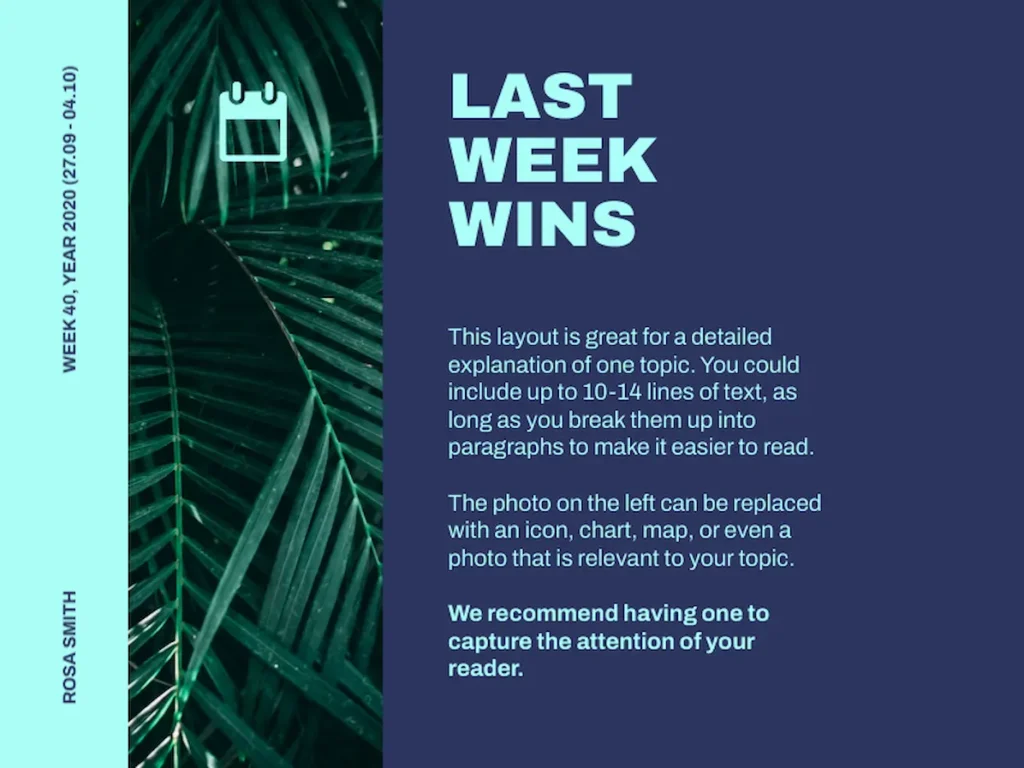
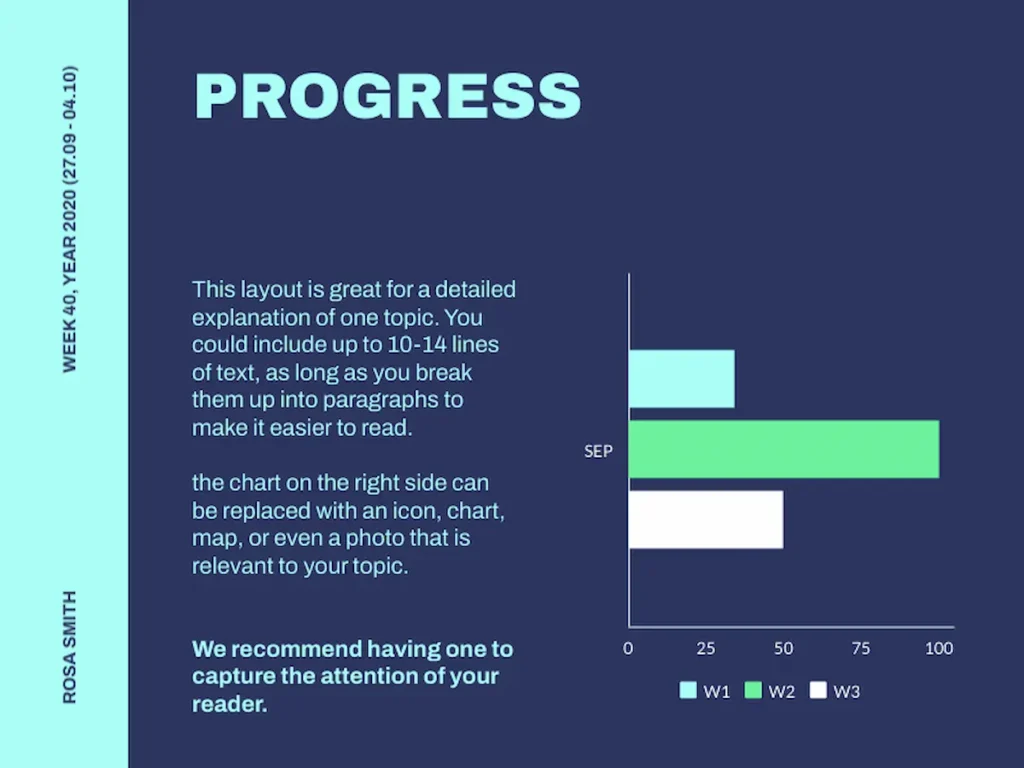
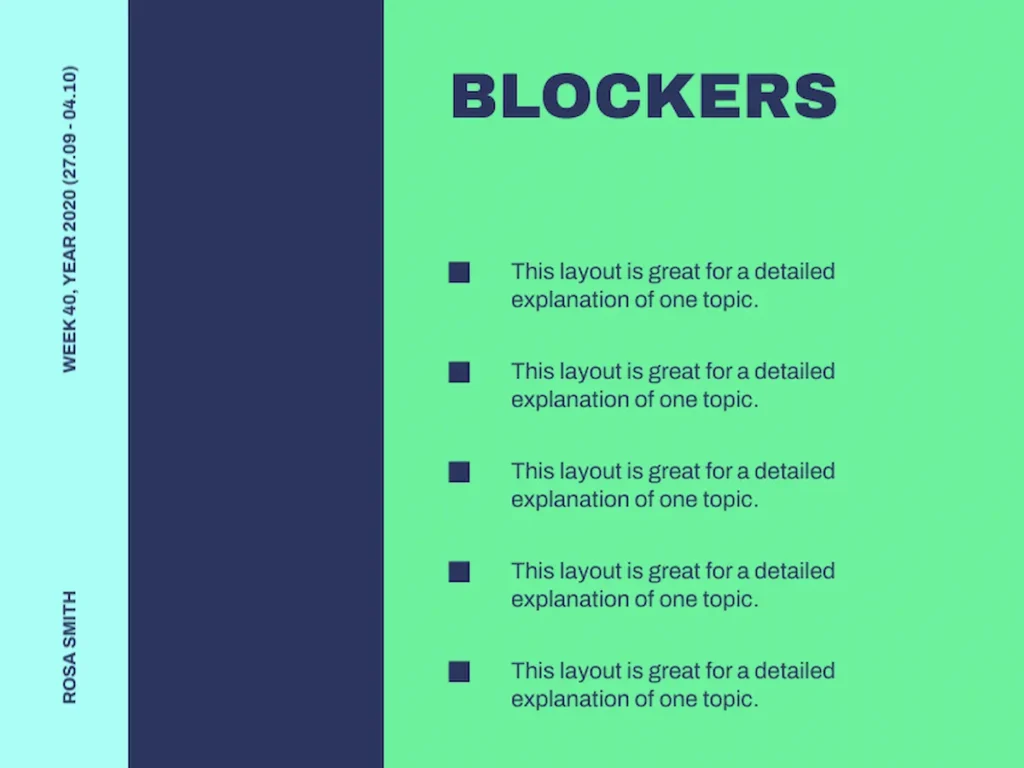
If you have weekly “standing meetings,” this presentation template for weekly status reports combines a pleasing (and calming!) color palette with pre-designed slides for delivering information on wins and visually representing progress with charts or graphs. It also has a slide template for talking about challenges (blockers).
Monthly updates
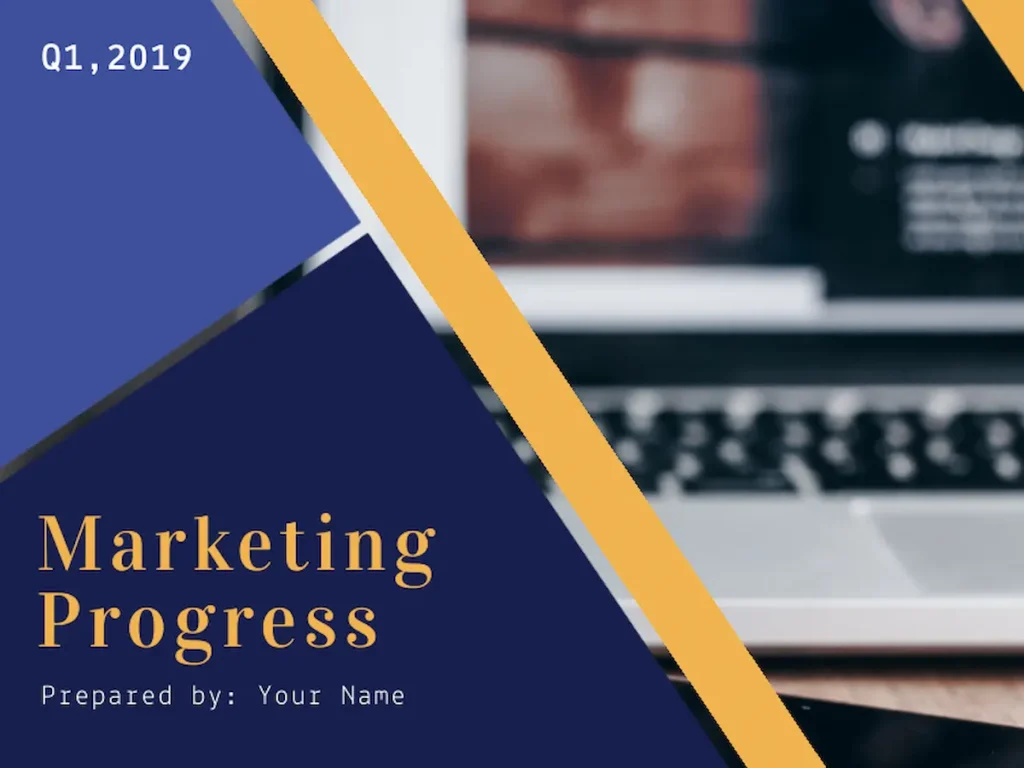
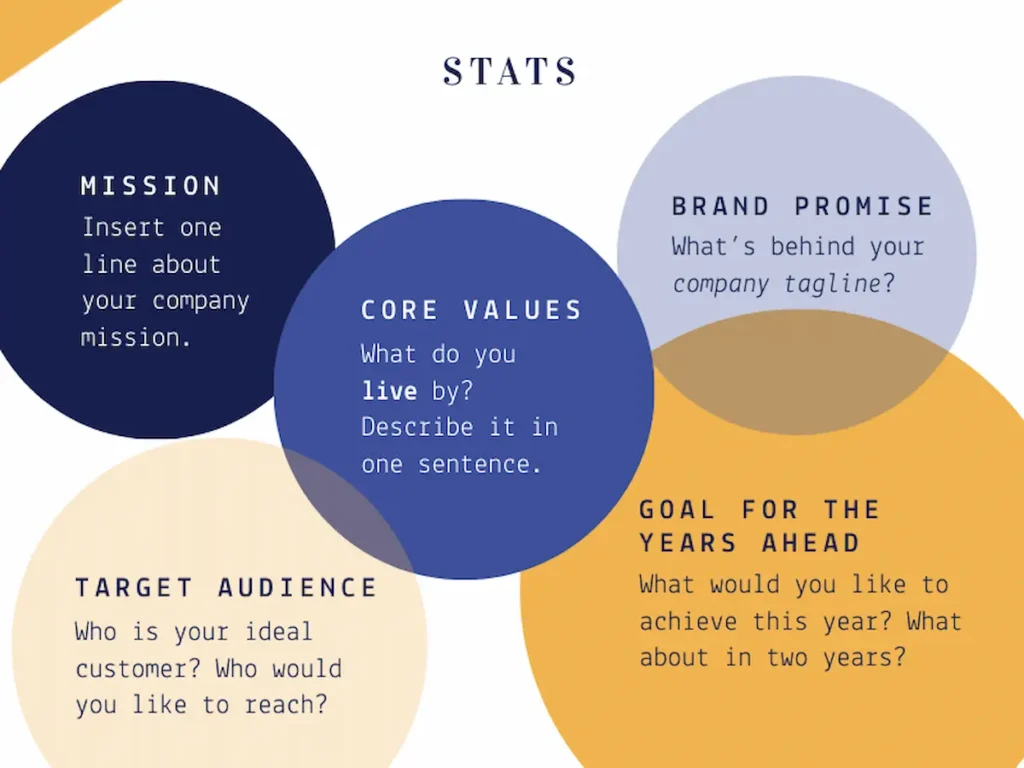
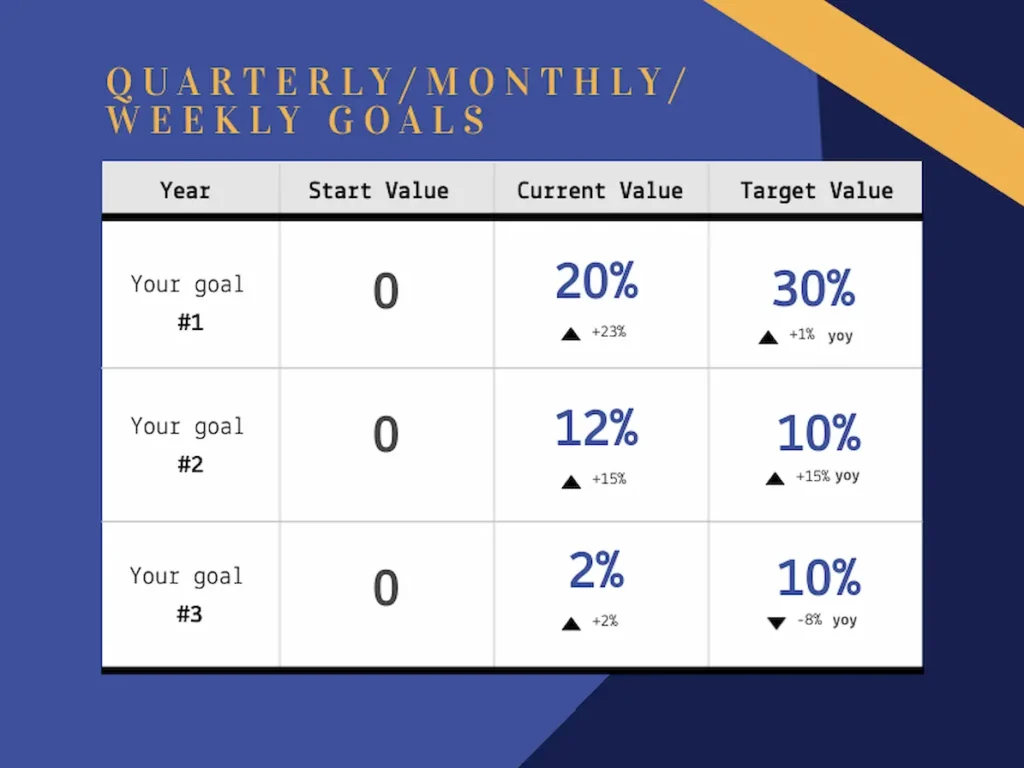
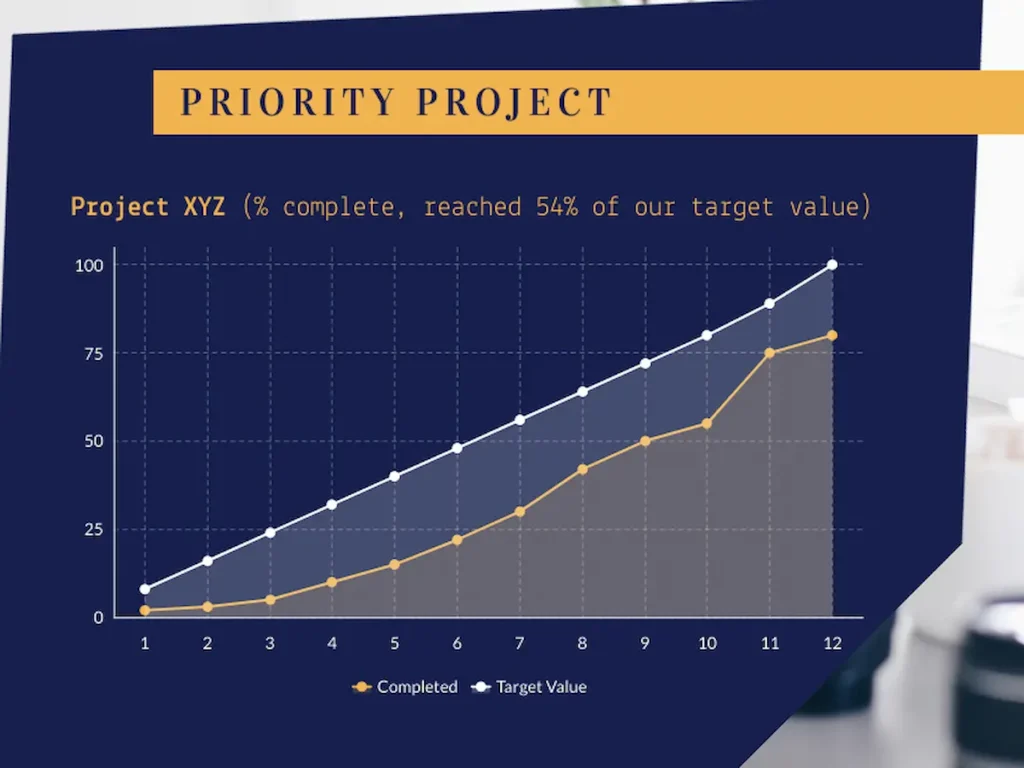
When your cadence for updates expands to monthly, it’s important to connect your progress to larger business goals. Piktochart’s monthly/quarterly template for marketing departments can be adapted to many teams within a company. I especially like the slide revisiting the mission, brand promise, and core values to connect the month’s work with the bigger picture. The template includes multiple slides to document progress with data visualizations.
Crisis communication updates
When your workplace or organization experiences a reportable crisis, communication updates must be clear, direct and solution-focused.
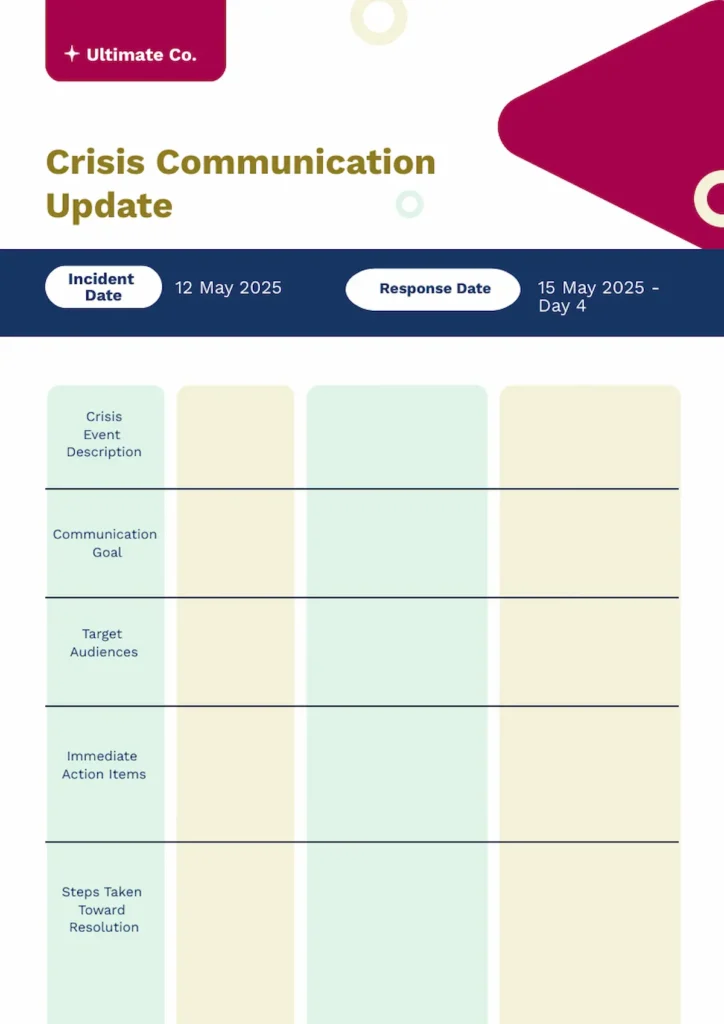
I adapted Piktochart’s minimalist training schedule template to provide an easy-to-read and easier-to-digest crisis communication. The template can be updated each day during the crisis, and the bottom two sections (immediate action items and steps taken toward resolution) keep the discussion on track to successfully navigate the incident.
Avoid information over- and undersharing in your updates
Information overload
Sometimes, in our haste to deliver as much information as possible about our progress, we perform an information dump. Instead of making us look productive, “info-dumps” make us look unfocused and disorganized. The way your information is chosen, sequenced and formatted can help your audience make sense of what you’re sharing, but at some point, the quantity of information you share will also play a role in how well your report is received.
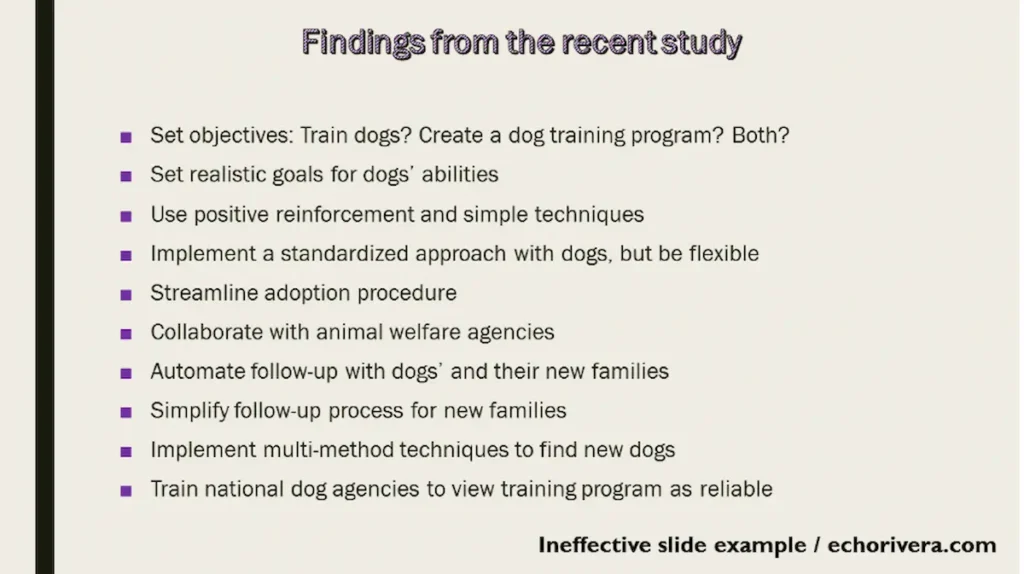
Consultant Dr. Echo Rivera has a perfect example of a slide crammed with far too many “useful” facts to actually be useful.
Tips to avoid oversharing:
- Consider your audience and level of granularity needed.
- Recognize the limits of your format, and use information that works well.
- Consider the frequency of your reporting, and limit data to fit the cadence.
Information gaps
Another pitfall when preparing a progress report is providing information that doesn’t tell a complete story. Lacking context, your audience may draw inaccurate conclusions about your work. Even worse, if key information is buried too deep, it may appear to your audience that it is being intentionally hidden (even if it is not).
Let’s look at an example from the Storytelling With Data blog that originally was designed as pie graphs comparing various regions’ performance, in terms of stages in the sales pipeline.
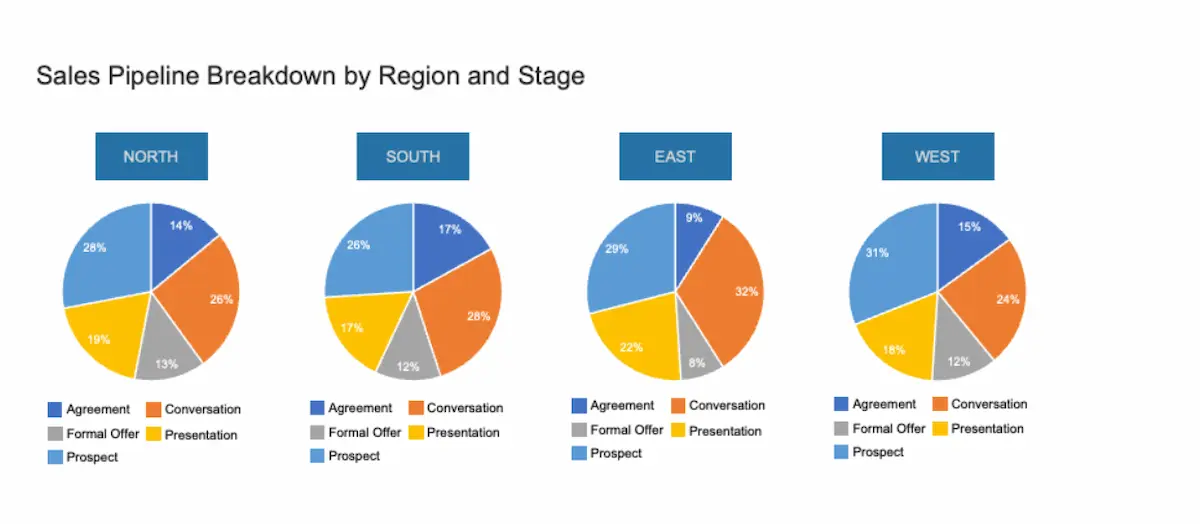
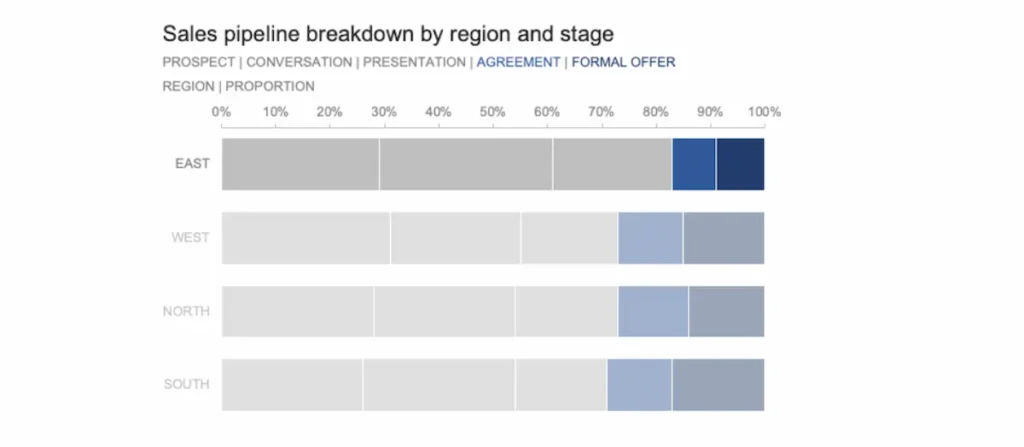
These are nice charts, but presenting the data this way obscures a significant finding: the eastern region has a smaller number of prospects in the formal offer or agreement stages. Changing the graphic to a stacked bar chart and taking steps to highlight the information we want to bring forward, the data is no longer hidden.
Tips to avoid information gaps:
- Ask for feedback to ensure your audience has the proper context.
- Make room for context. Curate your report information ruthlessly.
Provide well-structured content and a clear visual hierarchy highlighting key data points.
Make every project update count with Piktochart
Stop overwhelming stakeholders with walls of text. Start delivering updates they’ll actually read!
Piktochart transforms your data into stakeholder-appropriate visuals instantly. Choose from thousands of templates or use our AI Report Generator to match your update to your audience.
Create your free Piktochart account and discover what effective project communication looks like.
Frequently asked question about project updates
Can you provide an example of how to give an update on a project?
Absolutely. Let’s walk through decision-making for a project update on a partnership I might develop for my aspirational business, True North Resumes.
I’ve been offered a chance to update administrators of a local technical training program about my survey project promoting portfolio coaching as a critical part of searching for a job. That means that my audience is likely to be executives.
I know that executive-level stakeholders need takeaway points, not operational details, so I chose a one-page template focused on metrics familiar to leaders.
I chose the Exit Interview Dashboard because it offers an opportunity to provide high-level statistics on the popularity of portfolio coaching, as well as progress reporting.
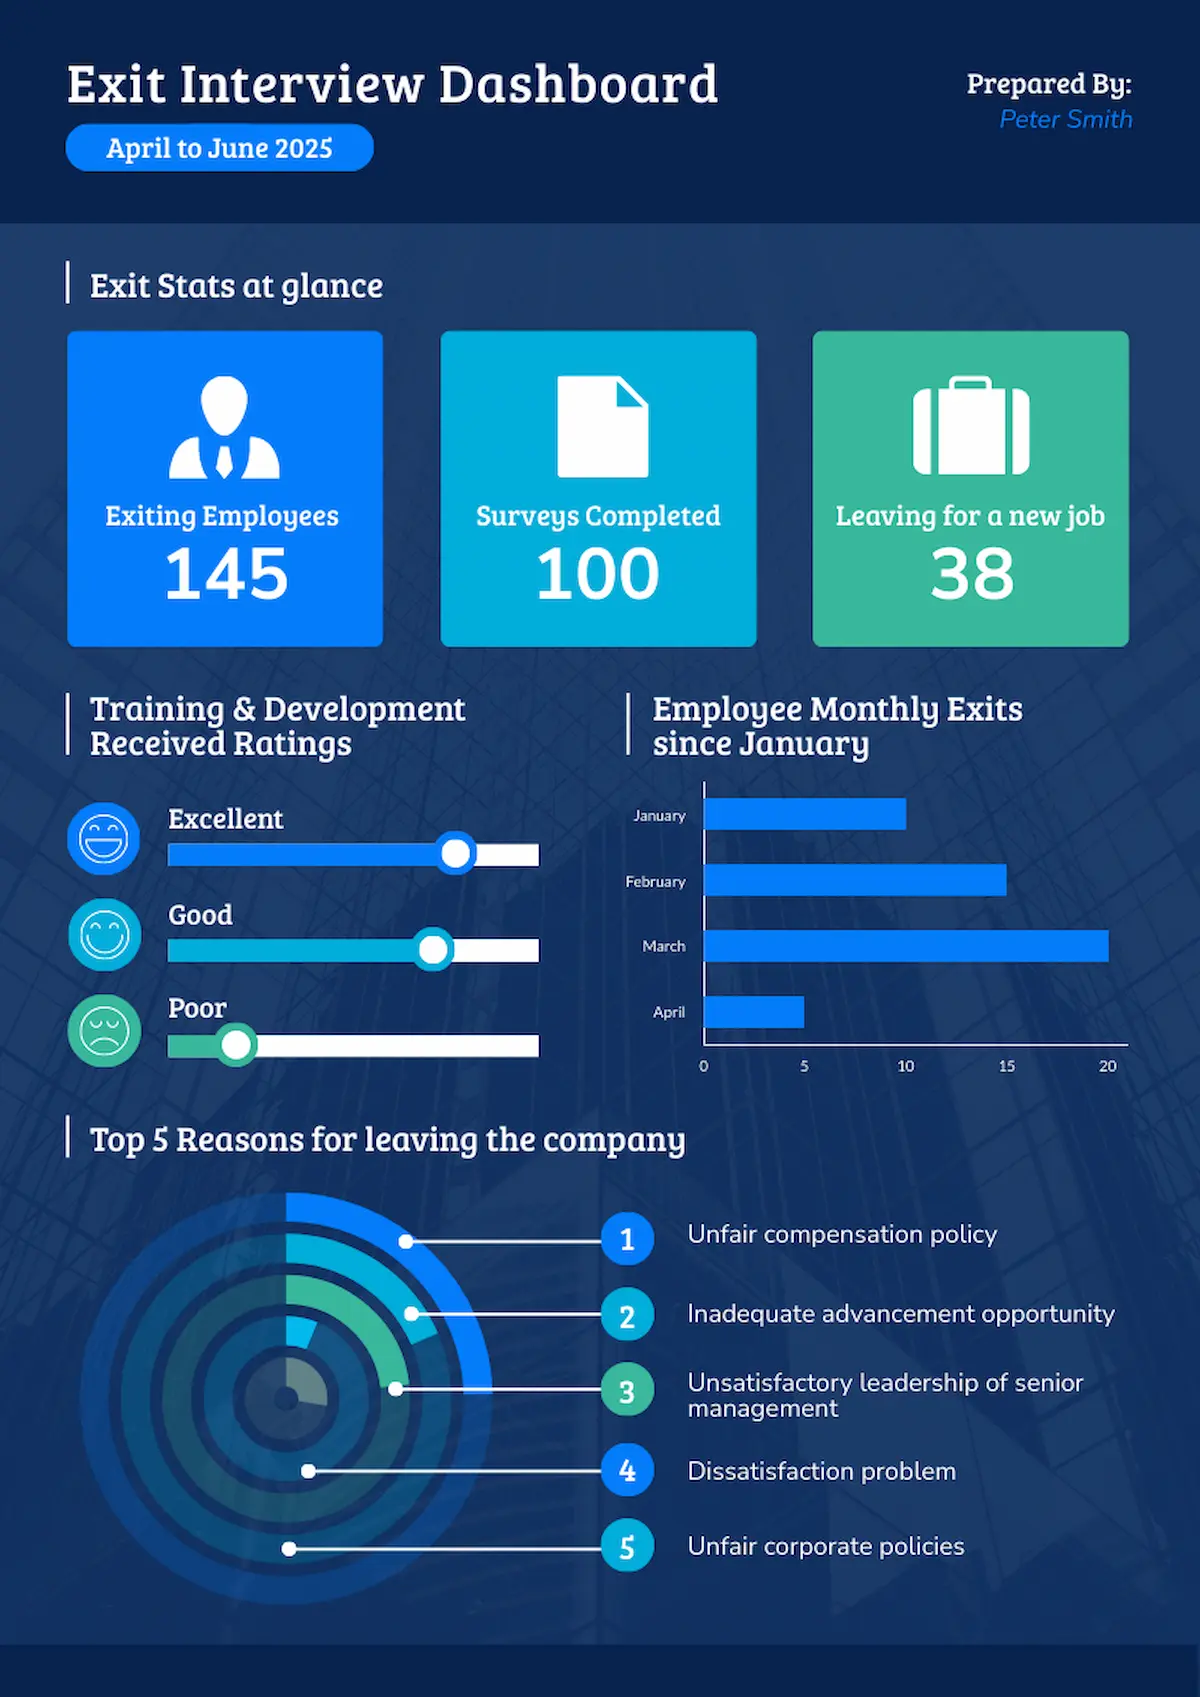
About 15 minutes after opening the template, I have my customized progress report ready.