
62% of adults say they celebrate Valentine’s Day. They say love makes people do crazy things, however, the holiday comes with added pressure for both men and women to live up to the hype. Every Valentine’s Day couples prepare well-thought out (or last minute) romantic gifts and plans.
Do you celebrate the most romantic day of the year? Whether you love it or hate it – here are 10 funny and interesting Valentine’s Day infographics for you to explore.
1. Valentine’s Day by numbers
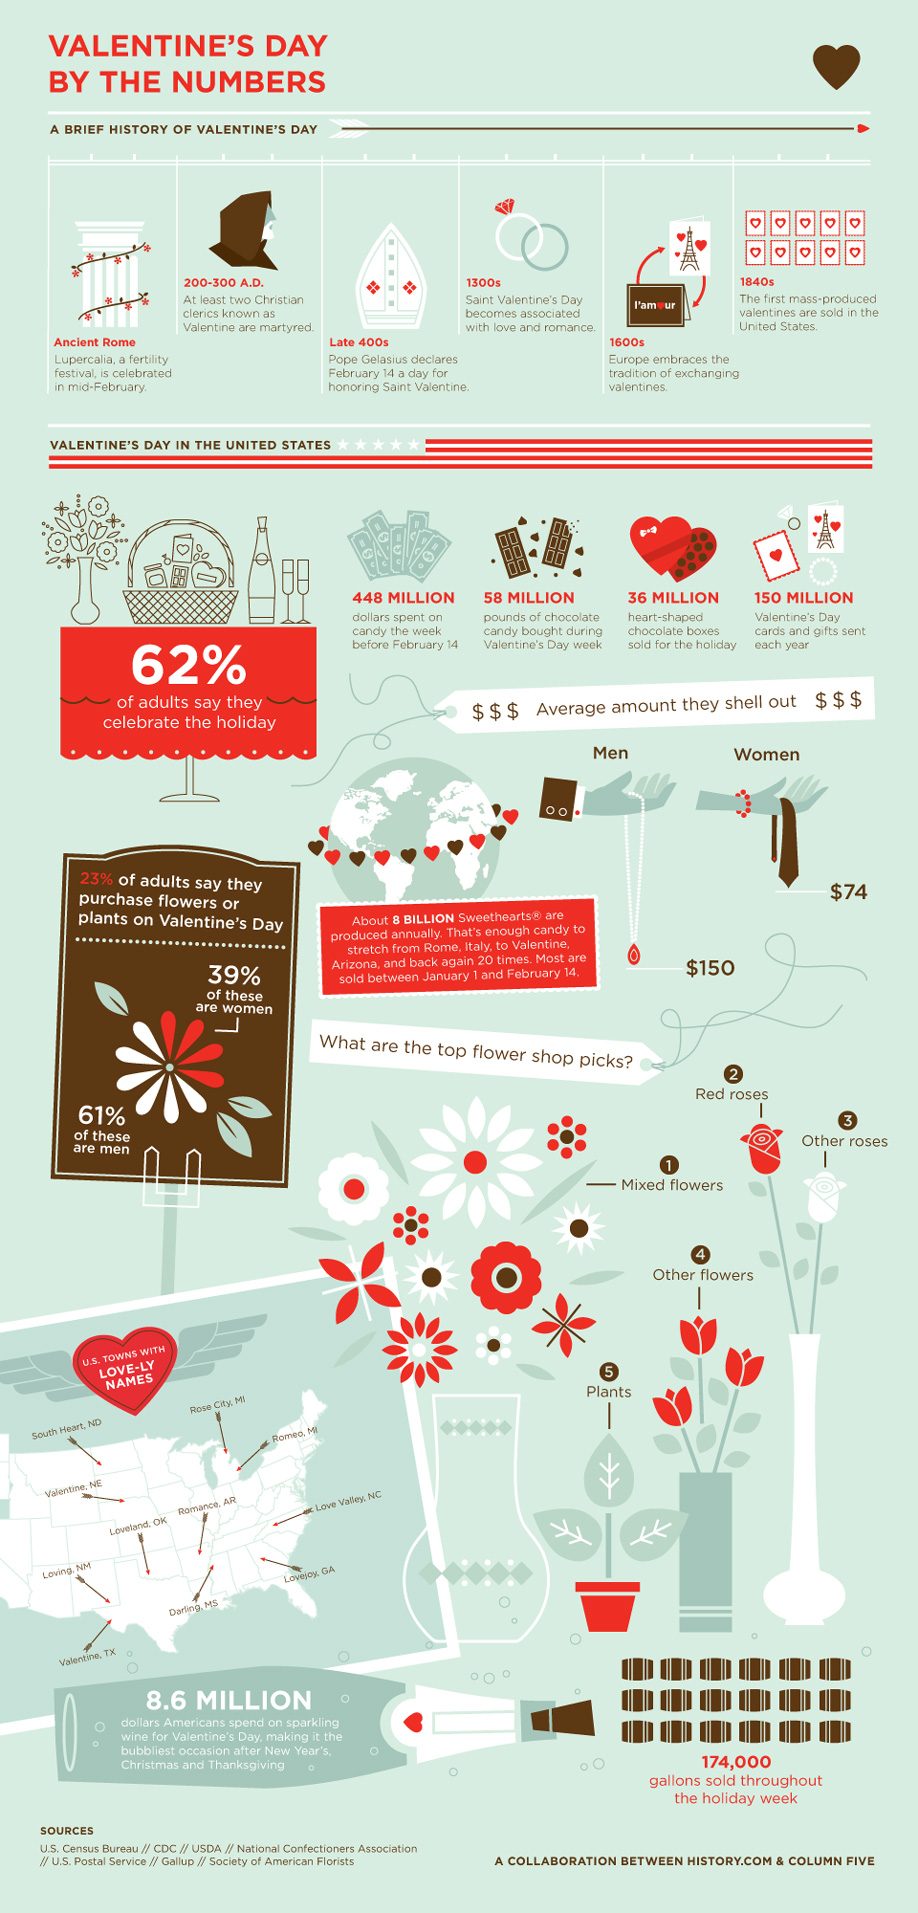
Source: Column five media
2. Valentine’s Day tradition around the world

Source: dailymail.co.uk
3. Valentine’s Day personas

Source: mediabistro.com
4. ‘I Love You’ in 50 different languages
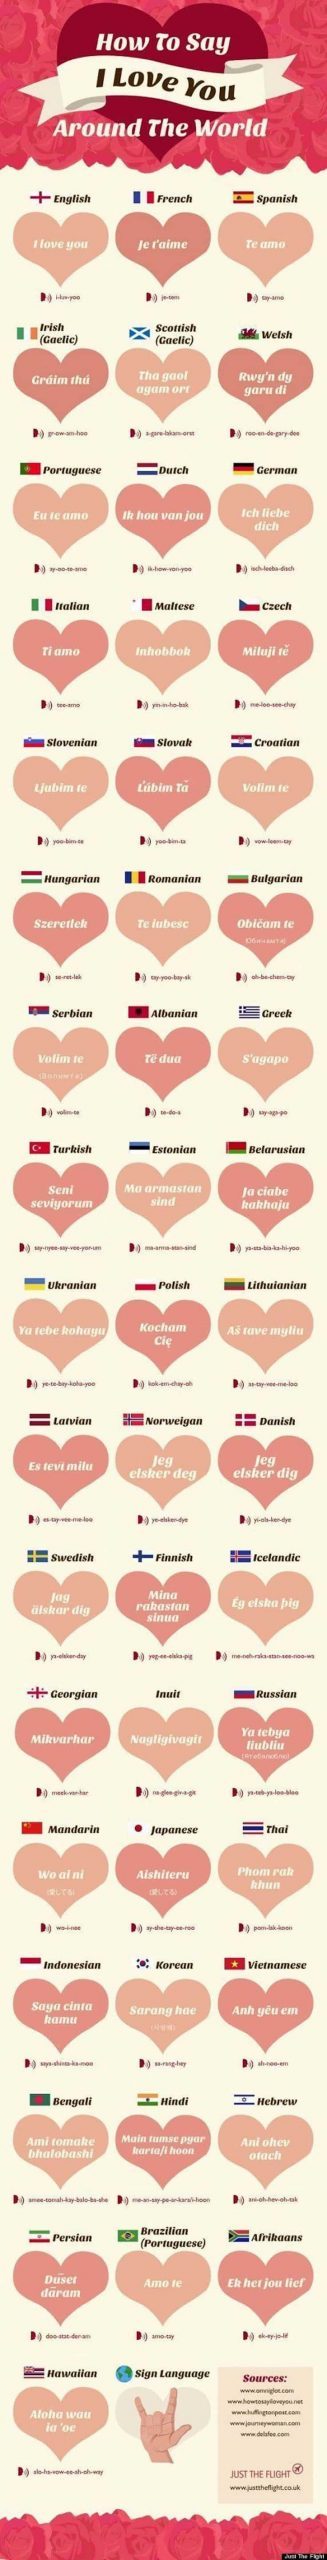
Source: huffingtonpost.com
5. State of Love Report in the US

Source: iqagency.com
6. Valentine Day and online dating
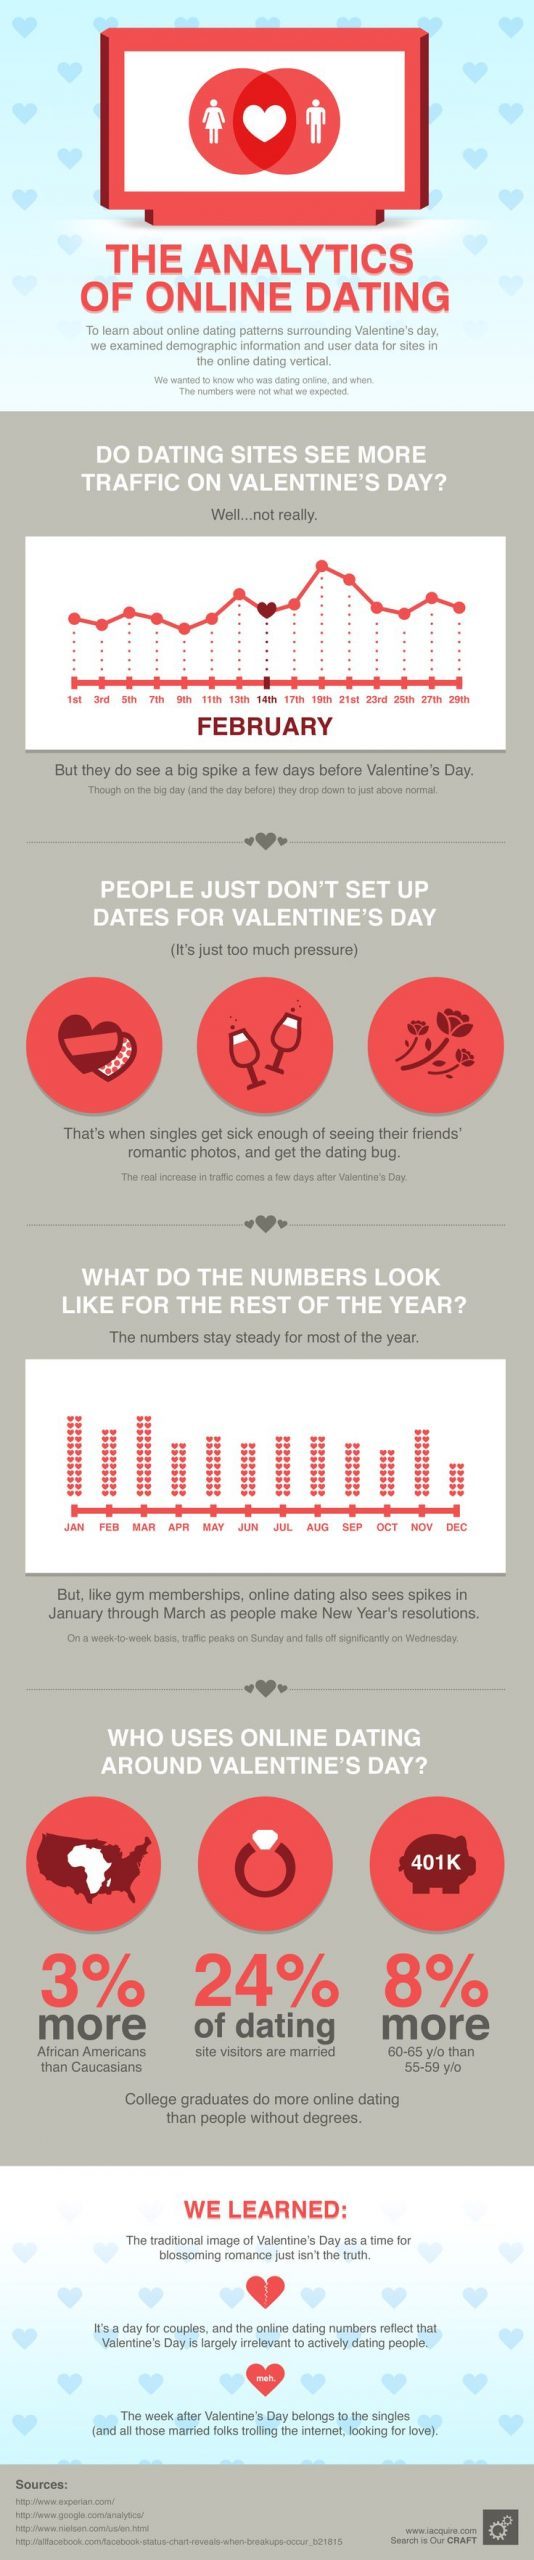
Source: iacquire.com
7. Facebook Valentine’s Day trends
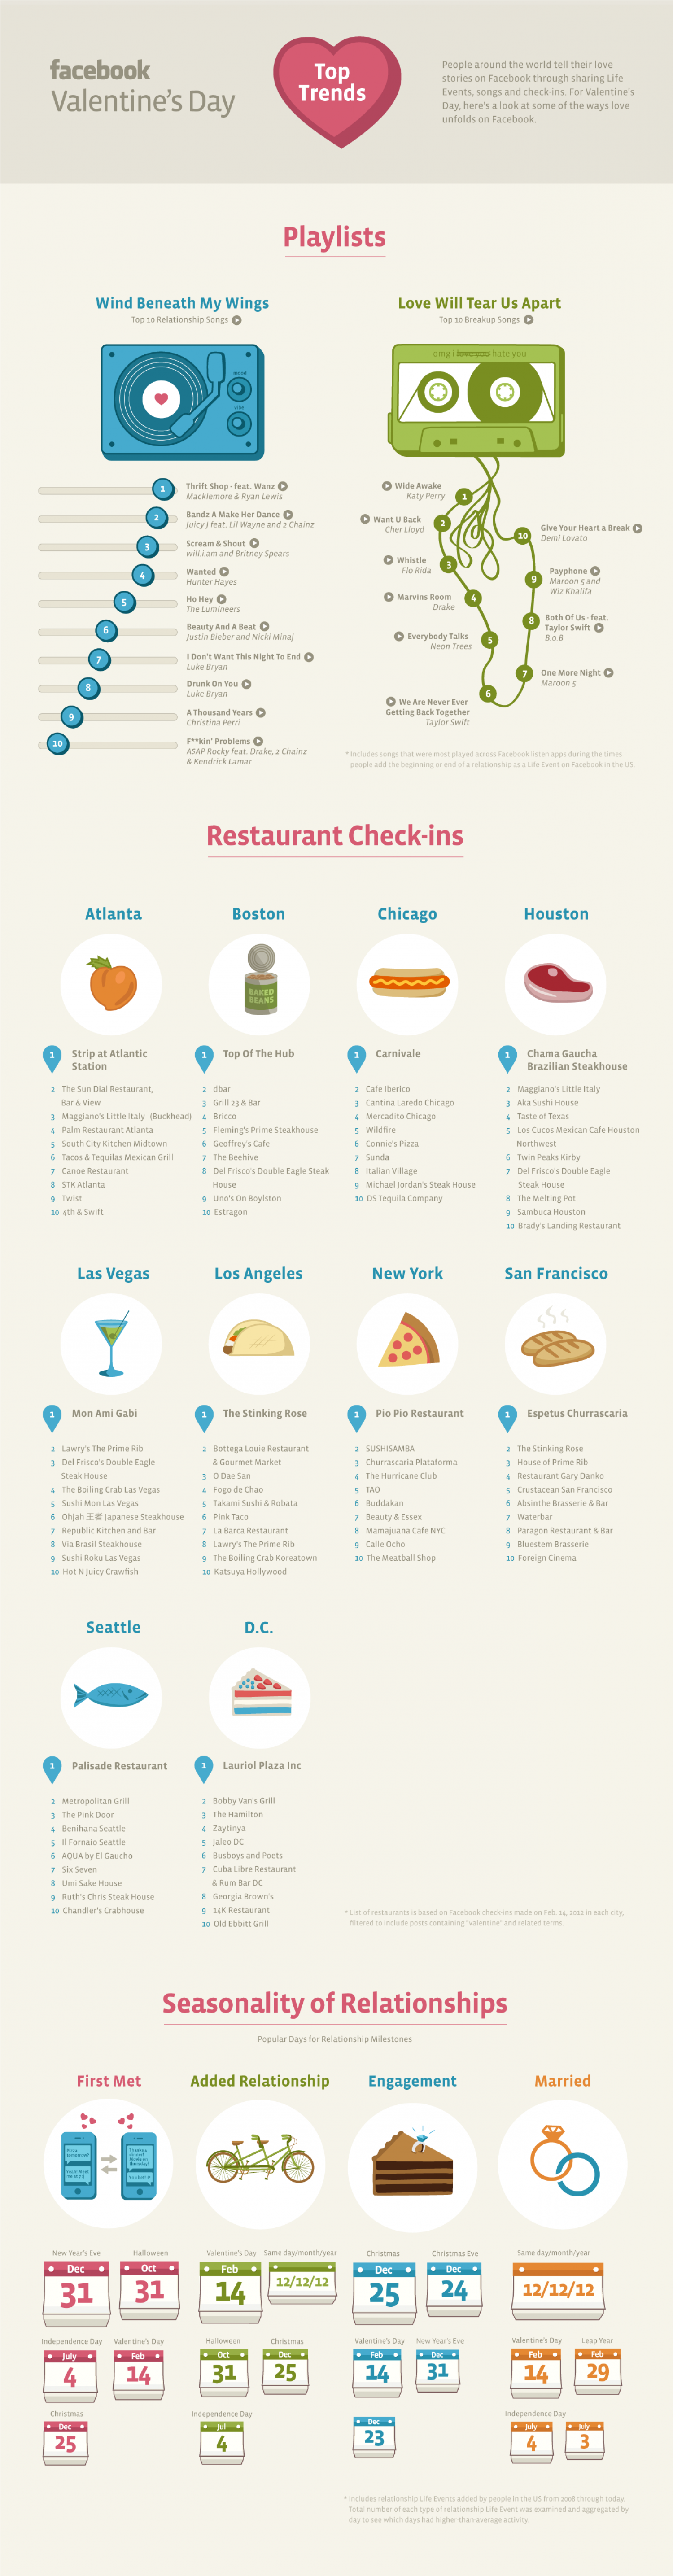
Source: Facebook
8. Romantic retreats
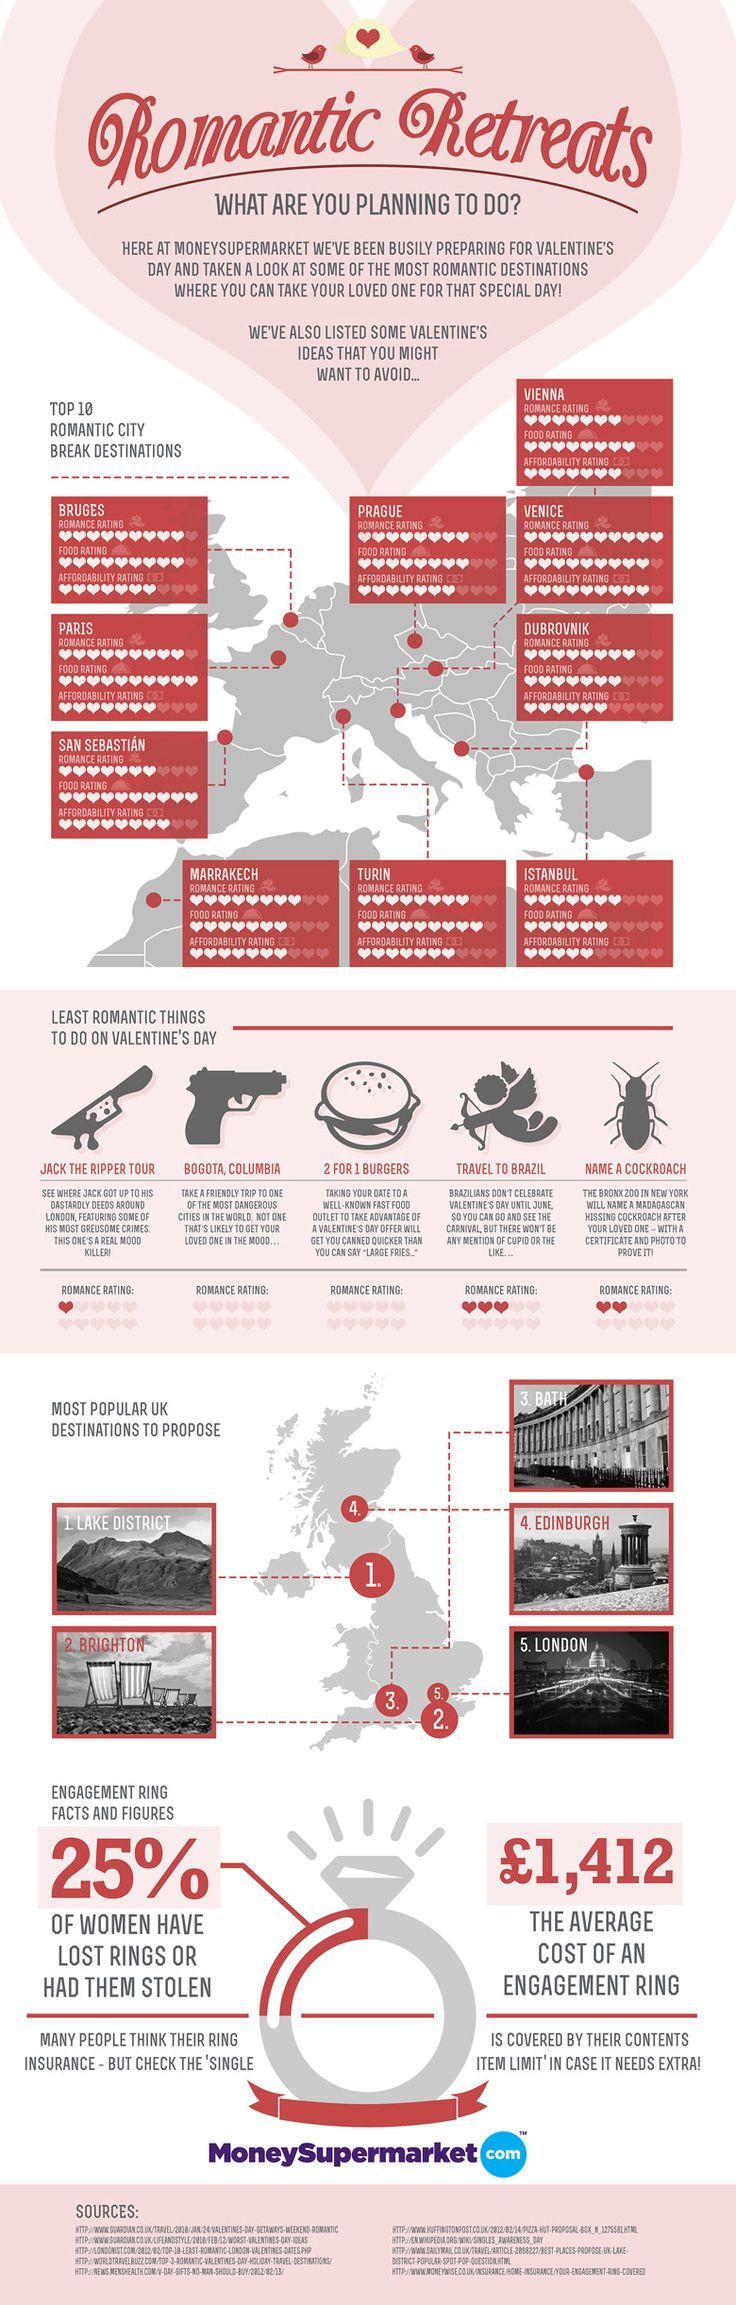
Source: Moneysupermarket.com
9. A fair Valentine?

Source: Fair Trade Vancouver
10. The Environmental Impact of Valentine’s Day

Source: Wine Enthusiast Magazine
About the author

Natalija Snapkauskaite is Growth hacker and Marketer of Piktochart. She joins Piktochart from Lithuania with a MSc. An adventuress at heart, she aspires to work in fast moving startup environment. Her goal is to eat lots of local food and learn some Chinese. Ni hao!