Customer Story
How Holland Bloorview Kids Rehabilitation Hospital Uses Piktochart to Improve Health Literacy
Lorraine Thomas
Family Support Specialist & Health Literacy Lead
- Company
- Company Website
- Business TypeHealthcare
- LocationCanada
- Friends with PiktochartSince 2018
Health literacy is becoming a piece of increasingly sought-after information in the wake of the pandemic. Hence, healthcare professionals need to find an effective way of informing the public and helping them to grow in awareness of their healthcare.
As part of our #PiktoChat series, Wilson had a brief chat with Lorraine Thomas, family support specialist and hospital lead for health literacy at Holland Bloorview Kids Rehabilitation, to discuss how her team uses Piktochart to improve health literacy among their patients.
WM (00:06):
Hello everyone, I hope you are well out there and thank you for tuning in to our #PiktoChat series. My name is Wilson and I’m a project specialist with Piktochart, and I’ll be your host for today’s #PiktoChat. #PiktoChat is a series of chat with leaders and entrepreneurs to share their knowledge and experience in using Piktochart.
Today, I’m delighted to be joined by Lorraine Thomas, a family support specialist and the hospital lead for health literacy with Holland Bloorview Kids Rehabilitation Hospital. The team at Holland Bloorview are avid users of Piktochart and we’ve had the wonderful privilege to collaborate with them on various projects. I’m so excited to be speaking with Lorraine today. Hello, Lorraine and welcome to our #PiktoChat. How are you doing over there?
LT (00:50):
Hi Wilson, I’m doing great. Thank you for having me here.
WM (00:55):
It’s so good to have you here with us today, Lorraine. Before we begin our #PiktoChat, I’m sure our audience would love to know you better. Would you like to introduce yourself further to us?
LT (01:06):
Hello, everyone. My name is Lorraine Thomas and I work at Holland Bloorview Kids Rehabilitation Hospital in Toronto, Canada. We are a pediatric rehabilitation center and a teaching hospital. Our focus is on children from birth to age 18. I work as a family support pain specialist in the family resource center. I’m also the hospital’s health literacy lead. My two roles of the family support specialist and health literacy lead really complement each other and I will explain why.
As a family support specialist, a lot of my work requires that I work with families and we try to identify the resources which will allow them to make the most informed decisions for their child’s healthcare and their family’s well-being. A really important part of our work is to make sure that the resources we recommend or easy to explain to families – that families can understand these resources and most importantly, they can act on the information provided. Because of health literacy, I’m really aware of the importance of getting those critical pieces of information presented in a way that makes sense to everyone.
At this point, you might be wondering what is health literacy? Health literacy can be defined as knowing when and where to find health information, understanding the health information, using health information to make informed choices about your care. The reason I’m so excited to talk to Piktochart today was because it presents a really great opportunity for well-designed information. Piktochart offers you the means to present information in a way that gets the attention of the user, allows them to get the information that they are receiving, and prompts them to say, “I can make a health literate decision.”
“Piktochart presents a really great opportunity for well-designed information and offers you the means to present information in a way that gets the attention of the user, allows them to get the information that they are receiving, and prompts them to say, “I can make a health literate decision.”
Lorraine Thomas, Family Support Specialist at Holland Bloorview Kids Rehabilitation Hospital
WM (03:13):
Well, thank you for giving us an introduction of yourself and Holland Bloorview, As with every guest on our #PiktoChat, I’m curious to ask this question, how did you first discover Piktochart?
LT (03:26):
That’s a really good question, Wilson. I was first introduced to Piktochart by my colleague, Melissa. She’s also a family support specialist at Holland Bloorview. Melissa is a really talented visual designer and she’s always looking for resources that will support our families.
From a design perspective, Piktochart really clicked because I saw this as an opportunity that will give our Holland Bloorview families a ready-made tool and this would allow them to advocate for the child and clearly communicate with care providers. And when you think about it, for many of our families, this often involves making sure that really complex pieces of health information are shared with care providers to ensure that the child’s needs are supported.
“From a design perspective, Piktochart really clicked because I saw this as an opportunity that will give our Holland Bloorview families a ready-made tool and this would allow them to advocate for the child and clearly communicate with care providers.”
Lorraine Thomas, Family Support Specialist at Holland Bloorview Kids Rehabilitation Hospital
Additionally, in my role as health literacy lead, I also review quite a few infographics. The principles of plain language and content design also apply. Just because something has a lot of graphics and colors and looks pretty doesn’t mean it’s conveying information that it is supposed to. I really appreciate that Piktochart provides accessible design templates and formats and this makes it easy for a family to create these types of resources on their own and also for care providers to design an infographic to show information for patients.
“I really appreciate that Piktochart provides accessible design templates and formats and this makes it easy for a family to create these types of resources on their own and also for care providers to design an infographic to show information for patients.”
Lorraine Thomas, Family Support Specialist at Holland Bloorview Kids Rehabilitation Hospital
WM (04:54):
Thank you so much for sharing about that and our team at Piktochart, we are so grateful for advocates like Melissa and yourself, and also the opportunity to collaborate with you all.
Now that we’ve learned about your perspective of Piktochart, let’s talk more about visual communication as a whole. Can you let us know why is visual communication so important for your role in the healthcare field?
LT (05:17):
For anyone who has been involved in healthcare, whether you’re a healthcare provider or a patient, we know health information can be really confusing. There are actually studies done that show that patients remember less than 1/3 of the information given to them at the first appointment.
Research also shows that 40-80% of the information given by healthcare providers is immediately forgotten and that 50% of the information that people remember is recalled incorrectly. This is really concerning on a number of levels. When you think of a family of a child with a disability, you are already stressed by any number of factors even under the best circumstances.
A well-designed infographic can help to filter out all that noise. In my professional opinion, anything that helps to reduce information overload and communicate important information in a way that is easily grasped is super important for our families. This is where Piktochart comes in.
“A well-designed infographic can help to filter out all that noise. In my professional opinion, anything that helps to reduce information overload and communicate important information in a way that is easily grasped is super important for our families. This is where Piktochart comes in.”
Lorraine Thomas, Family Support Specialist at Holland Bloorview Kids Rehabilitation Hospital
WM (06:29):
Thank you for giving us an insight, especially on the data that you have mentioned with the research. I fully agree with you and it’s stories like yours and Holland Bloorview that inspire our team at Piktochart to keep making visual communication easy and accessible.
On that note, how have visual communication and Piktochart benefited Holland Bloorview?
LT (06:51):
I’d love to answer the question. I know that I keep talking about health literacy but it’s so important. The way we process and understand information is affected by literacy, culture, language fluency and cognitive processing, emotional state, and stress to name a few. And we also know that people with higher literacy skills also gained from a plain writing approach. They will get the basic information they need and then they will seek more details if they wish.
When we talk about the ‘All About Me‘ template, I think this is the perfect example of combining some of the great features offered by Piktochart and this can also support the creation of health literate information. What was so great about the ‘All About Me’ template was that it was a collaborative effort and our Holland Bloorview families gave input.
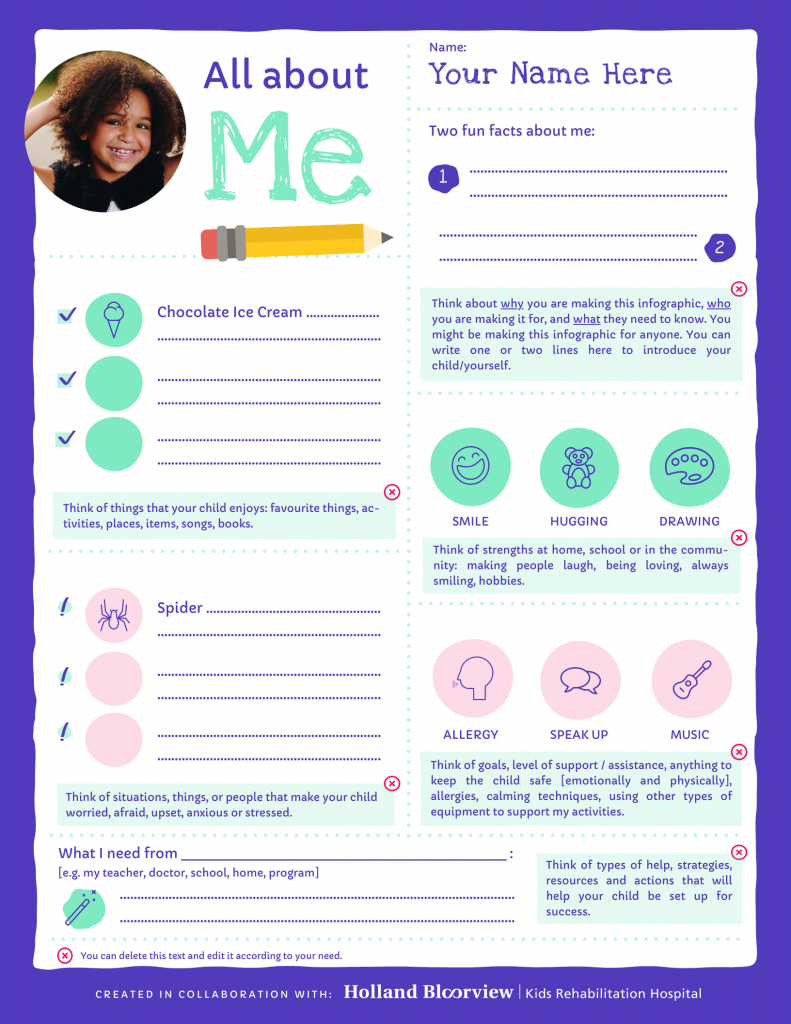
“The ‘All About Me’ template is the perfect example of combining some of the great features offered by Piktochart and this can also support the creation of health literate information. What was so great about the template was that it was a collaborative effort and our Holland Bloorview families gave input. The best type of templates are the ones that meet the unique needs.”
Lorraine Thomas, Family Support Specialist at Holland Bloorview Kids Rehabilitation Hospital
The best type of templates are the ones that meet the unique needs. It aligns with Holland Bloorview’s family-centered care values, where we work closely with families to understand their needs. So nothing about me without me. We’re very grateful to Piktochart for supporting us in this.
WM (08:10):
Similarly, for us as well at Piktochart, we’re so grateful for the opportunity to be able to collaborate with Holland Bloorview on the ‘All About Me’ template. And finally to wrap up if you could offer the three most important visual communication tips, what would that be?
LT (08:29):
First and foremost, I always say display the most important information first. I always say that imagine if your reader had two minutes to scan a document, what do you need them to remember? This goes back to my point about patients remembering less than 1/3 of the information given to them at the first appointment. So the ‘All About Me’ template is great because it lays it all out for you and makes it pretty intuitive. Even if you’re not strong on design, you can’t help but put the key pieces of information first.
My second suggestion and recommendation is to use culturally appropriate images. Avoid using images that require pop culture knowledge or are outdated. For example, the image of a rotary phone as opposed to a cell phone. I also appreciate that Piktochart provides graphics that are inclusive of different cultural backgrounds and diverse bodies. This is really important when you’re trying to engage your audience.
“I appreciate that Piktochart provides graphics that are inclusive of different cultural backgrounds and diverse bodies. This is really important when you’re trying to engage your audience.”
Lorraine Thomas, Family Support Specialist at Holland Bloorview Kids Rehabilitation Hospital
Last but not least, think of accessibility for all including those with visual impairments. When images or graphics are included with the infographic, those images must also be described if they convey an important meaning or message. Use graphics that have alt text or alternative text, so it can be read by a screen reader.
WM (10:01):
Thank you so much for sharing those visual communication tips with us, Lorraine. For all our listeners, you can also check out the ‘All About Me’ template which is- on our Piktochart editor and that can be used for free. Today, it was truly a pleasure to be speaking with you. Thank you for sharing your story with us that is so inspiring and also giving us a better insight on health literacy in this #PiktoChat.
If you’d like to get connected with Lorraine or myself, feel free to connect with us on LinkedIn. And if you’ve enjoyed this #PiktoChat episode, feel free to check out the rest of our episodes to hear more inspiring stories from various leaders and entrepreneurs. That’s the end of our #PiktoChat today and goodbye.
Infographic Templates Recommended for Healthcare Professionals


")
Ready to create an impressive infographic?
Join more than 14 million people who already use Piktochart to craft amazing visual stories.
More stories

How An Aspiring Entrepreneur Raised Funding For Her Startup With Piktochart

How Deborah Tan, Communications Manager at Revolut, Uses Piktochart to Create Content

How Affirm Creates Learning & Development Content With Piktochart