Welcome to June’s edition of What’s New at Piktochart! This month’s updates are all about removing steps between you and a finished design. Your AI generator is now integrated directly into your workspace, and visualizing documents is smarter than ever with automatic chart preservation.
Here’s how these changes help you create visuals faster.
What’s New in Piktochart?
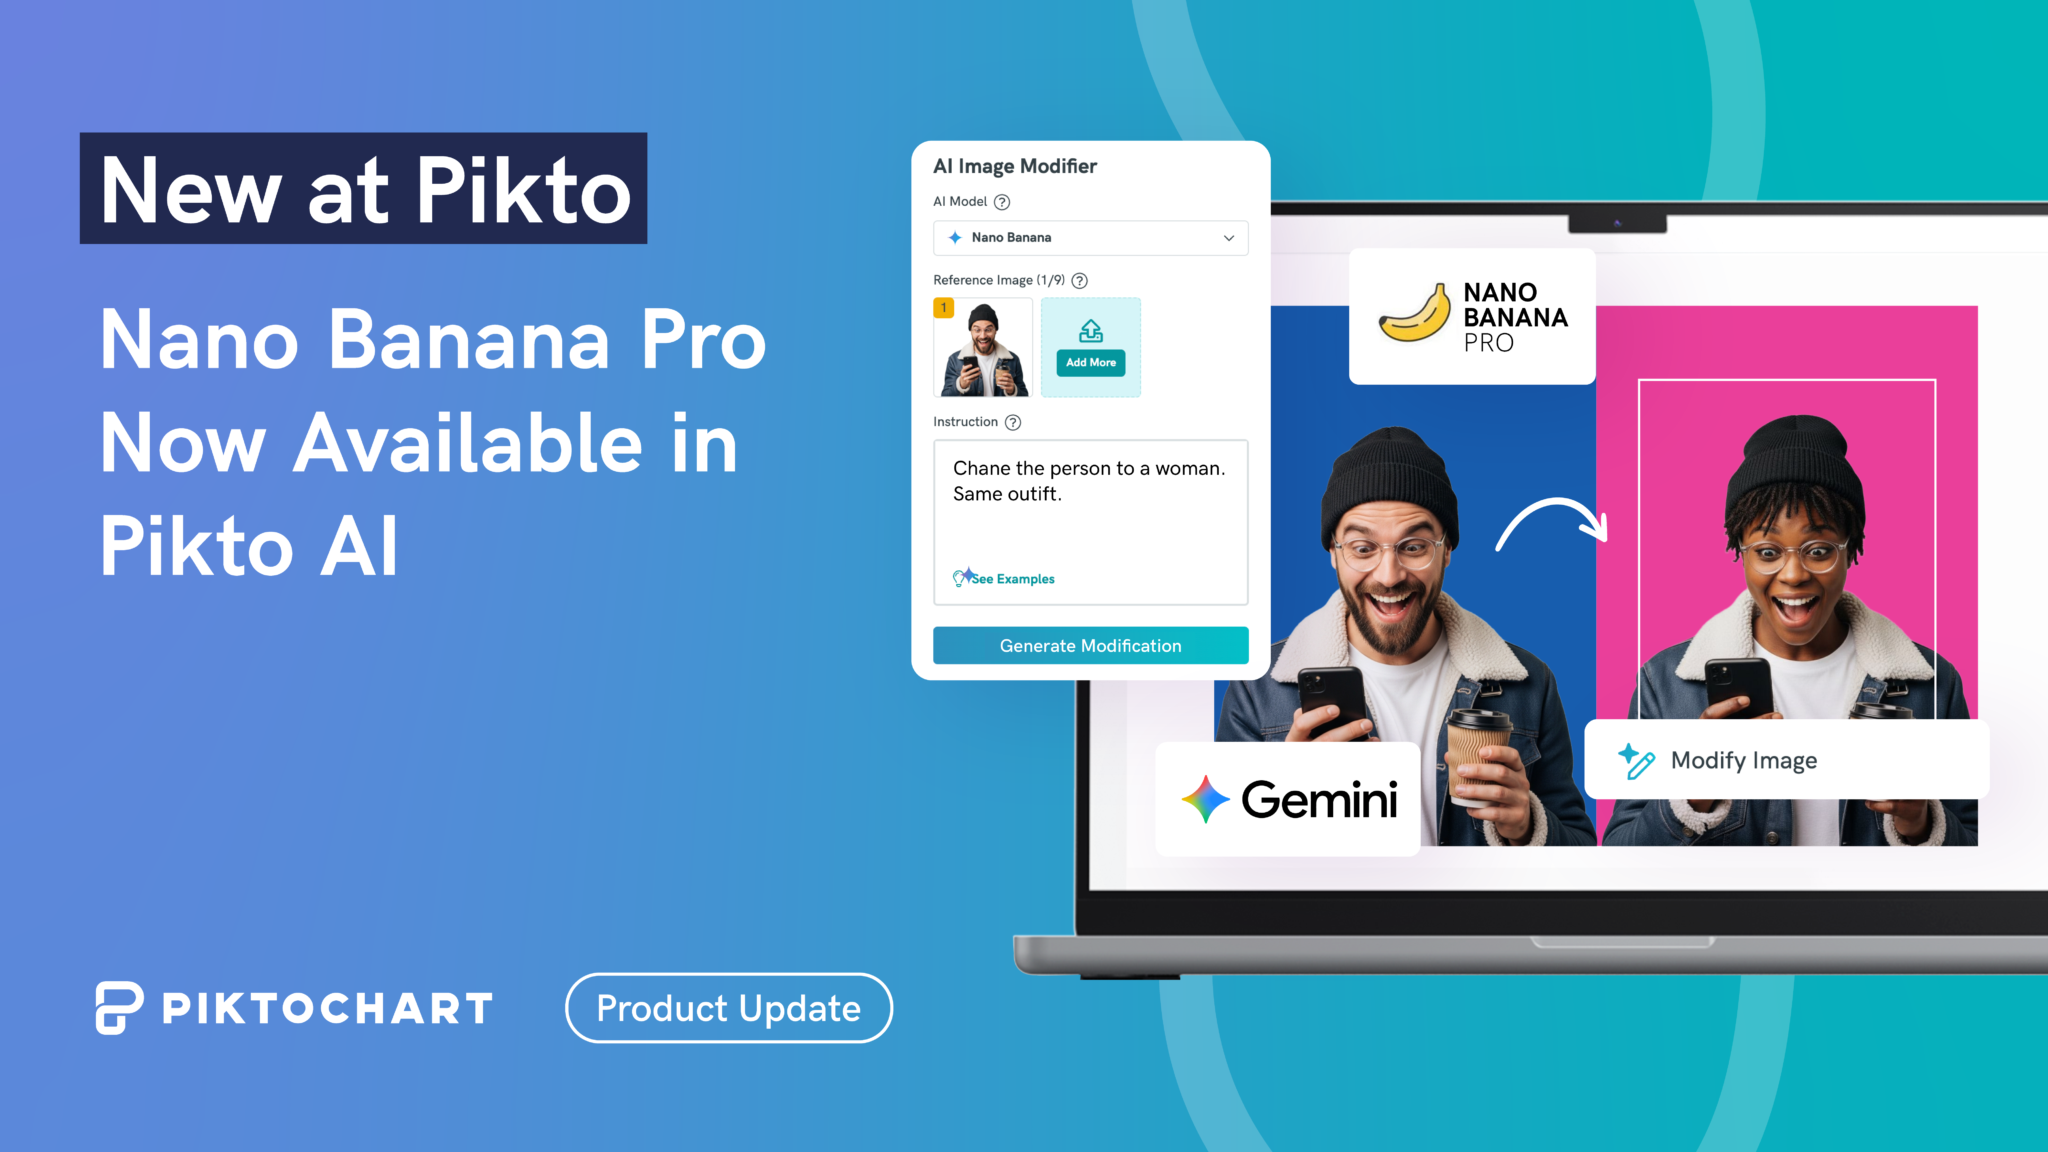
Pikto AI Generator is now a click away
We’ve integrated the Pikto AI generator directly into the main Piktochart application. This means no more switching tabs to generate a visual and accessing your templates.
Previously, you had to navigate away from your work to use AI. Now, you just need to click the “Create with AI” button to open the generator right wherever you are. And when you’re ready to go back to your workspace, you can head back from the main sidebar.
To help you get started, we also added a “Try These with AI” section on the dashboard. It offers sample prompts for different visual formats. When you select one, it opens the generator with the prompt and format pre-filled, making it simple to experiment with AI-powered creation.
The goal is a smoother, more connected experience for our users. We want to encourage visual creation by making AI technology more visible and accessible from the moment you log in.
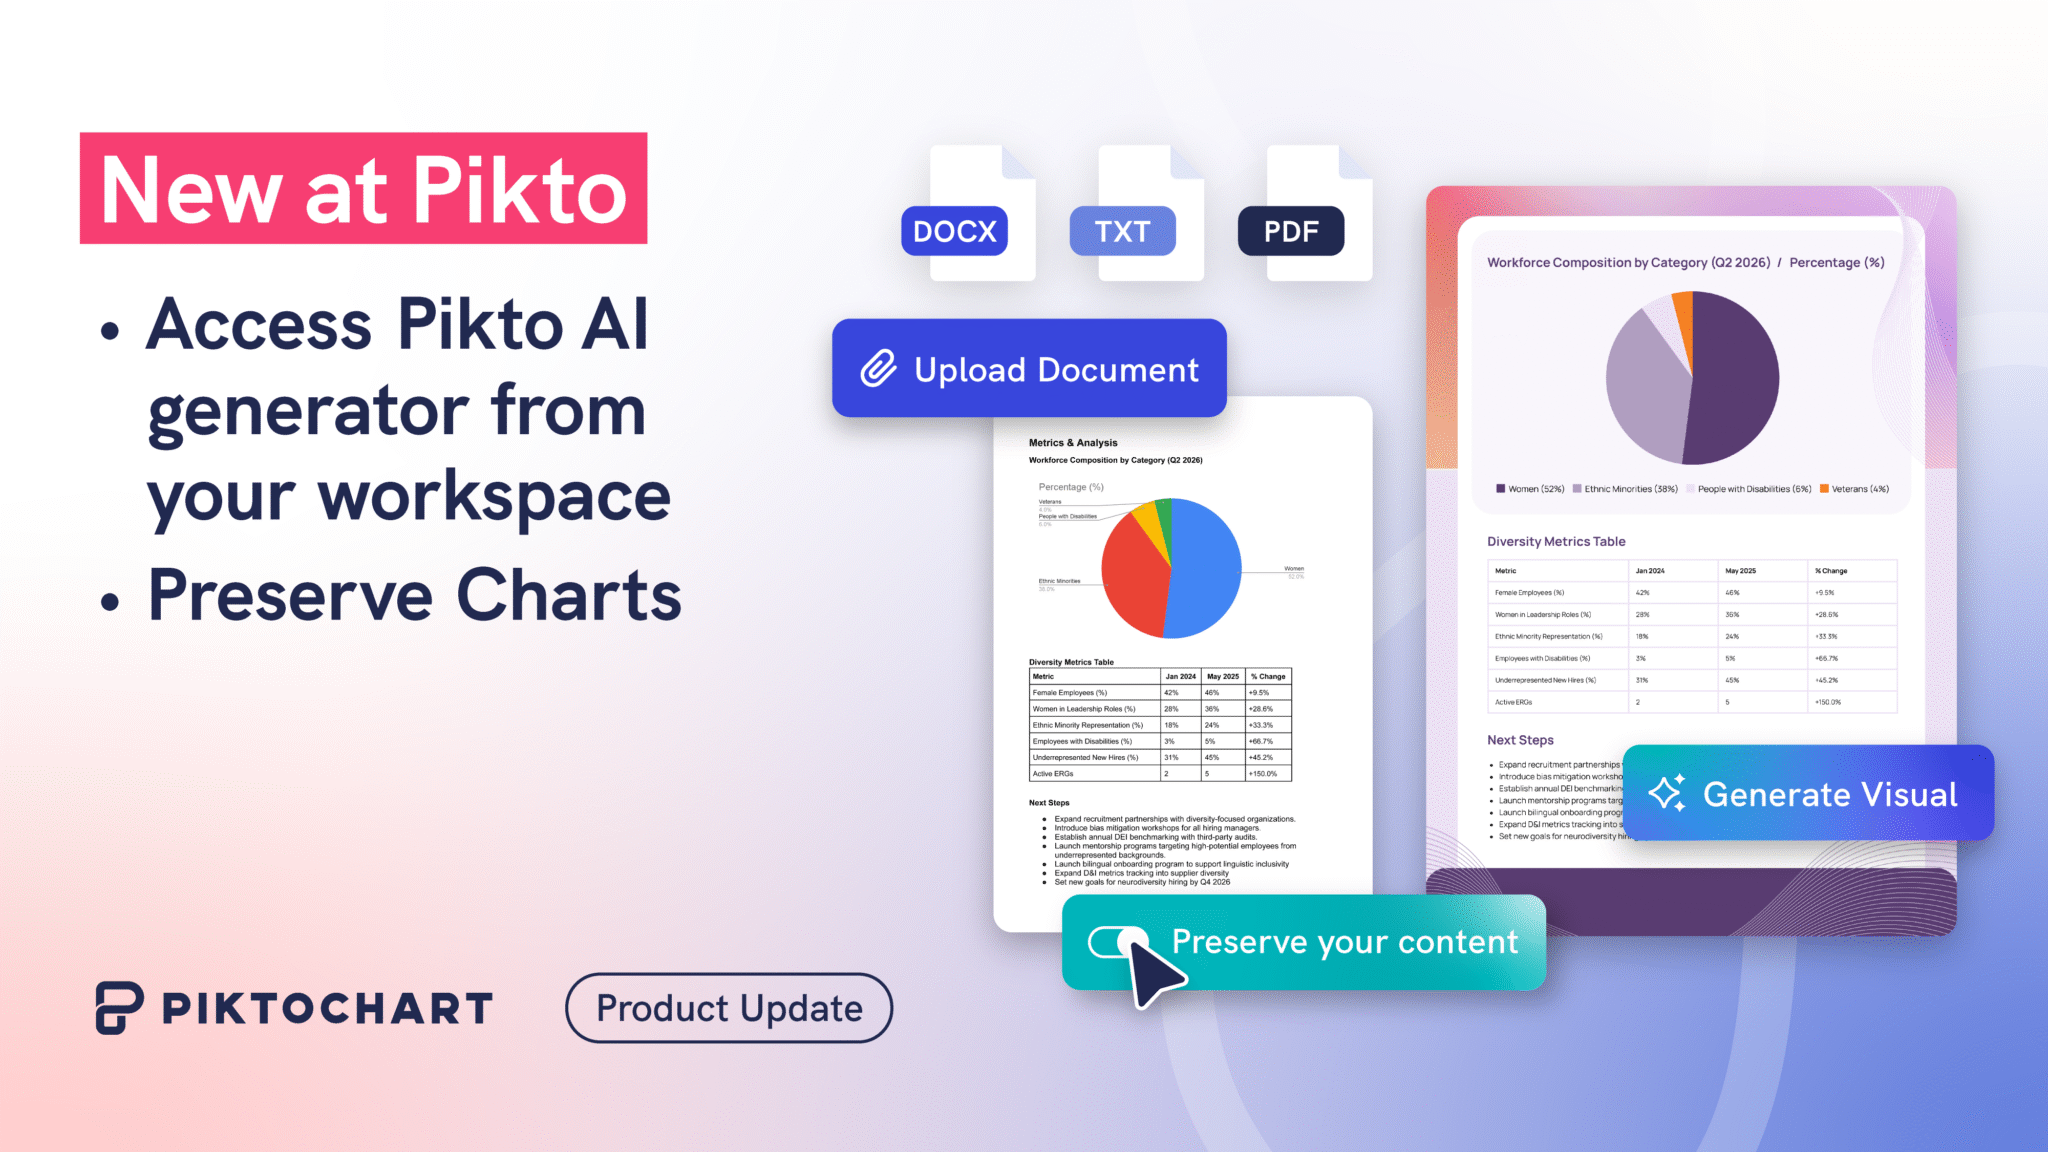
Stop Rebuilding Charts – Just Upload and Edit
Turning a report into an infographic used to mean manually recreating every chart. Not anymore.
Our Preserve Content feature gets a significant upgrade this month. When you upload a document, Pikto AI automatically preserves your charts and converts them into native, editable components.
This enhancement addresses a key part of repurposing content. Many reports and documents rely on charts to convey important data. Before, these charts had to be recreated manually. Now, charts from your uploaded files are automatically preserved and converted into native Piktochart chart components.
Because the charts are native to the editor, you can:
- Instantly adjust the data.
- Change the chart type (e.g., from a pie to a bar chart).
- Modify the appearance to match your design.
The chart colors will even adapt to your chosen template, keeping your branding consistent. This update gives you a complete visual starting point, saving you the tedious work of rebuilding your data from scratch.
Try out our Preserve Content feature to learn more.