
Most professionals spend more time formatting a chart than analyzing the data behind it. AI chart makers flip the process: paste your CSV or connect a spreadsheet, type a prompt, and receive a publication-ready visualization within seconds.
This guide reviews the best AI chart and graph makers for 2026. We cover standalone charting tools, LLM chatbots (yes, ChatGPT can build charts), and enterprise platforms with built-in AI. Each review includes pricing, supported data imports, export options, and a clear verdict on who the tool is for. Need your charts inside a larger visual like a report or infographic? Piktochart AI lets you generate and embed charts without switching apps.
This guide is updated for 2026 and reflects the latest pricing, feature additions, and new entrants in the AI chart generation space.
How to Create a Chart with AI
You do not need a data science background to generate professional charts with AI. The workflow is the same across tools: feed in data, describe what you want, and let the model do the heavy lifting.
1. Start with a question, not a dataset. What decision should this chart support? A sales trend, a budget breakdown, a demographic comparison? Pin down the question first; the chart type follows.
2. Get your data ready. Upload a CSV, connect a Google Sheet, or paste values directly. Remove empty rows and give every column a descriptive header. Messy input produces messy output.
3. Pick the right tool for the job. Quick one-off charts work well in ChatGPT or Gemini. Recurring reports with multiple visualizations suit dedicated platforms like Julius AI or Piktochart’s chart maker. Large-scale analytics teams will lean toward Tableau with Einstein or Power BI with Copilot.
If you want to test natural-language chart generation without paying, ChartAI gives you five free credits to type a plain-text description and receive a chart instantly. ChartGPT offers three free credits for the same workflow. For a more generous free tier, ChatGPT (free plan) can generate basic charts from conversational prompts, though export options are limited.
4. Prompt with precision. Vague prompts produce vague charts. Specify the chart type, the variables, the time range, and any formatting preferences. Example: “Line chart showing monthly website traffic from January to June 2026, with a secondary axis for conversion rate.”
5. Iterate fast. Swap a bar chart for a waterfall. Change the color palette. Add data labels. AI tools let you cycle through variations in seconds instead of minutes.
6. Export in the right format. PNG for presentations. SVG for web. PDF for printed reports. If the chart lives inside an infographic or a multi-page report, use a tool where chart creation and page layout happen in one place.
AI chart tools are not limited to creation. ChatGPT, Gemini, and Claude can all analyze an uploaded chart image, describe what it shows, flag misleading axis scales, and suggest improvements. If you already have a chart and need a second opinion on clarity, paste a screenshot into any of these LLMs before sending the visual to stakeholders.
Which AI Chart Makers Work with Excel Data?
Most AI chart tools accept .xlsx and .csv uploads, but the depth of Excel support varies. Piktochart, Julius.ai, and AppyPie all let you drag in a spreadsheet file and map columns to chart axes. ChartAI and ChartGPT work from typed or pasted data rather than direct file uploads, so you would need to copy values from your spreadsheet first.
For users who never want to leave Excel, Microsoft Copilot in Excel is the most native option: highlight a data range, open the Copilot sidebar, and type a prompt like “create a bar chart comparing Q1 and Q2 revenue by region.” The chart appears in your existing workbook with no file export or import required. For multi-sheet workbooks with pivot tables or complex formulas, enterprise BI tools like Power BI or Tableau handle the data pipeline more gracefully than standalone chart makers.
GraphMaker
GraphMaker is adept at what it’s name suggests. Its specialty is transforming complex data sets into visually stunning and easily interpretable charts and graphs.
Known for its user-friendly interface, it’s easy to create all sorts of data visualizations, ranging from line charts, bar charts, and pie charts.
The AI-driven analytics feature suggests the most effective way to present your data. This smart assistance helps in making complex decisions about data representation simpler, ensuring that your graphs accurately reflect the insights you intend to convey.
AppyPie
AppyPie is a well-known no-code app development platform. The AI graph maker creates data visualizations based on your prompt. Renowned for its simplicity and efficiency, it enables users to create charts and graphs with minimal effort.
You provide AppyPie with a prompt, and it’ll make a graph accordingly. Its drag-and-drop interface makes creating complex graphs simple.
The AI-powered insights are another key feature, offering helpful suggestions on how best to interpret and present your data. This means you get smart guidance to make your data more understandable and impactful.
The tool also includes a wide range of customizable graph templates. These templates save time and give you a starting point for your designs.
For those who need to make their reports and presentations more engaging, the tool’s interactive reporting feature is quite handy. It allows you to create reports that are not just static images but interactive, making your data presentations more engaging.
Appy Pie’s graph maker works across multiple platforms. This means you can easily share your graphs and collaborate with others, no matter where you or your team are working from. This multi-platform compatibility is great for teamwork and for sharing your work with others easily.
Pricing
AppyPie provides a basic free version, perfect for simple graph-making needs. Its premium plans start at $7.99/month, unlocking more templates and advanced features.
ChartAI
ChartAI is a simple AI-powered tool that leverages natural language processing to transform simple text inputs into detailed, valid Mermaid code. It brings a unique blend of simplicity and sophistication to the creation of charts and graphs.
The interface can seem overwhelming at first. On the left hand sidebar, you can choose from a range of templates. On the right hand side, you can edit the templates by writing more specific prompts for certain types of graphs and charts.
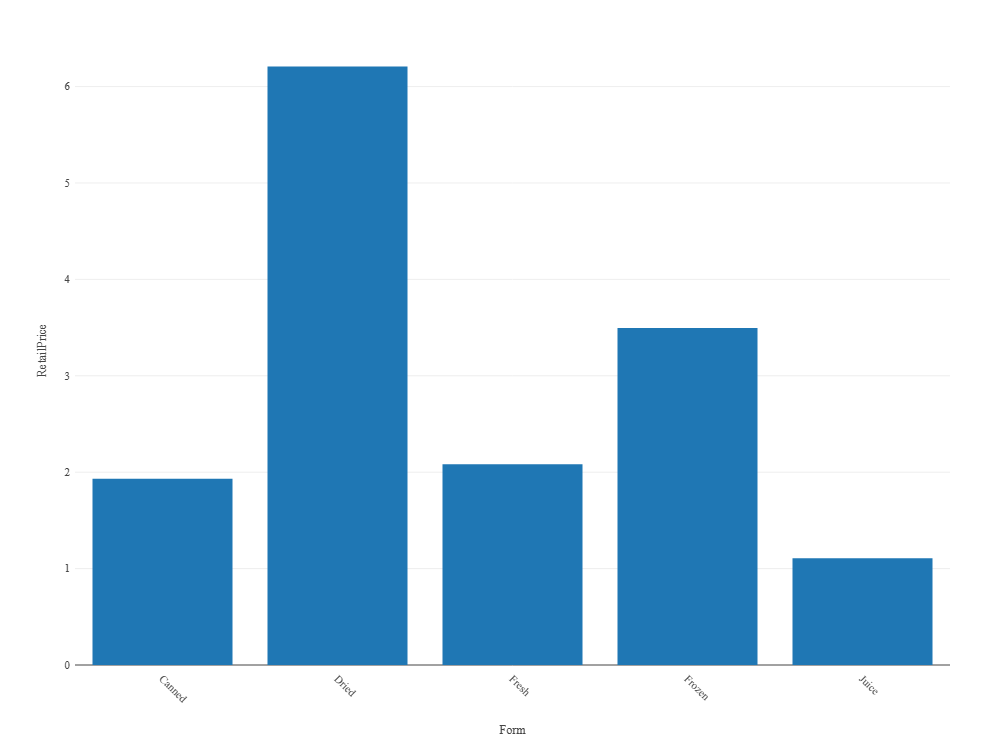
ChartAI interpreted instructions fairly well and created a bar chart without too many issues.
For non-coders or design beginners, the tool is great to quickly create a graph online. However, keep in mind that ChartAI generates Mermaid code, which is the output. If you prefer more coding formats, you might want to try other tools built on other programming languages.
Pricing
- 5 free credits
- 1,000 credits for $5
- Monthly subscription or one-off payment options available
Julius.ai is a chatbot that turns text prompts to charts. It’s more sophisticated and takes an interative approach. You’re given 20 credits for free to create one or two charts and graphs.
Making a graph took slightly longer than other tools, but only because it would finetune and give suggestions. You’re asked to link or upload a dataset from various sources, like a CSV file or a Google Sheets doc. After that, it’ll ask more questions on how you want to visualize the data.
Using Julius.ai was straightforward. The response isn’t rapid, as it takes time for the AI to process your requests, but the output was pretty good for the minimal input you provide. There are other statistical models you can create for more complex visualizations.
If you’re open to paying for a versatile artificial intelligence tool to create beautiful charts from large datasets, you might find a good use case for Julius.
Pricing
- Basic Plan for $17.99/month, suitable for moderate use with 250 messages per month.
- Essential Plan for $37.99/month, for more extensive use with unlimited messages.
- Pro Plan for $49.99/month, includes all features of the Essential plan, plus premium support and early access to new features.
Since its initial launch, Julius.ai has expanded well beyond chart generation. The platform now supports Python execution in-browser, statistical modeling (regression, correlation, hypothesis testing), and automated data cleaning workflows. File upload limits have increased to 50 MB on paid plans, making it viable for mid-sized datasets. Compared to standalone chart tools like ChartAI or ChartGPT, Julius bridges the gap between visualization and analysis: you can explore your data, run calculations, and generate charts in a single conversational thread. The trade-off is speed; Julius takes longer per request because it runs actual code behind the scenes rather than rendering a template.
ChartGPT
ChartGPT is a data visualization tool that has uses a chatbot to generate charts. It’s a free-form text box, so you can ask it to create any type of graph based on your requirements.
The online graph maker is created by a solo developer and made mostly with Typescript.
It works for the most part. You receive three free credits to test the tool.
However, there were a few shortcomings. I found that more complex instructions can often break the tool, which means a wasted credit. You also cannot customize the graphs after it’s made one, so you’ll need to finetune your inputs.
For simple charts and graphs, this can make quick work when you need to insert something basic into your presentation.
Developers can also use ChatGPT or Claude to generate d3.js, Chart.js, or Plotly code from a natural-language description of the desired visualization. Paste your dataset into the prompt, specify the library, and the LLM returns working code you can drop into a web project. This approach gives full design control but requires enough front-end knowledge to debug the output.
Pricing and Accessibility
- Works on a credit basis
- Starts from 20 credits for $5
- Scaling pricing, up to 260 credits and more for $80
Microsoft Copilot in Excel
Microsoft Copilot in Excel is not a standalone chart maker. It is an AI assistant embedded inside the spreadsheet you are already working in. Highlight a data range, open the Copilot sidebar, and type a natural-language prompt such as “show quarterly revenue by product line as a clustered bar chart.” Copilot generates the chart directly on your worksheet.
The biggest strength is zero context-switching. Your data stays in Excel, the chart updates when the underlying cells change, and you can copy the visual straight into a PowerPoint deck with one click. For teams embedded in the Microsoft 365 ecosystem, this eliminates the export-import friction that comes with every other tool on this list.
The limitations are real, though. Copilot in Excel requires a Microsoft 365 Copilot license ($30/user/month on top of your existing 365 subscription). Chart customization is more limited than in dedicated tools: you can change colors and labels, but complex formatting still requires manual Excel chart editing. And if your data lives outside Microsoft (Google Sheets, Airtable, a standalone CSV), you need to import it into Excel first.
Best for: Teams already paying for Microsoft 365 who want AI chart generation without adding another tool to the stack.
Can AI Generate Full Dashboards?
A single chart answers one question. A dashboard answers several at once, combining multiple visualizations, filters, and KPIs on a single screen. Most of the tools reviewed above produce individual charts, not full dashboards.
For AI-generated interactive dashboards, Tableau (with Einstein Copilot), Power BI (with Copilot), and Looker (with Gemini integration) are the leading options. Each can auto-suggest dashboard layouts based on a connected dataset, although they require enterprise licenses and a learning curve that goes beyond a casual chart request.
If you need a static dashboard-style layout without the enterprise overhead, Piktochart report templates let you arrange multiple charts, metrics, and text blocks on a single page and export as PDF or PNG. It is not interactive, but for monthly summaries, board decks, and client reports, a well-designed static dashboard often communicates more clearly than a cluttered interactive one.
What is the best AI graph generator?
When exploring the realm of AI graph generators, selecting the best tool hinges on a blend of several key factors. Here’s a balanced overview of considerations to guide you in making an informed decision.
- Use Case: Different AI graph generators cater to varied needs. For instance, tools like Google Sheets AI excel in business and academic applications due to their simplicity and integration with other Google services. Meanwhile, specialized tools like Julius.ai or ChartGPT might be more suited for users requiring advanced data analysis or the ability to convert text descriptions into charts.
- Types of Data Sets: The nature of your data plays a crucial role. Some tools are adept at handling large, complex datasets, offering detailed analysis and predictions, while others might be better for straightforward, smaller-scale visualizations.
- Level of Customization: The extent to which you can tailor the output varies widely. Tools like ChartGPT and Julius.ai offer varying degrees of customization in terms of visual aesthetics and data representation styles. Choose a tool that aligns with your need for personalization.
- Pricing: Budget considerations are paramount. While some AI graph generators offer free versions with basic functionalities (like Google Sheets AI), others may require a subscription for advanced features. It’s important to assess the cost against the value provided.
- Ease of Use: If you’re not well-versed in data science or programming, you’ll likely prefer a tool with an intuitive interface and straightforward functionality. Tools that require less technical expertise can be more appealing for a broader user base.
- Integration Capabilities: Consider how well the tool integrates with other software and platforms. Seamless integration can significantly streamline your workflow, especially if you are already using related tools or platforms.
Tableau’s Einstein Copilot can generate charts from natural-language questions against connected datasets, and it excels at exploratory analysis across large databases. Power BI Copilot, built into the Microsoft 365 ecosystem, works best for teams already using Excel and SharePoint because it pulls data directly from those sources. Both require paid enterprise licenses and are overkill for one-off charts, but they are the strongest options for organizations that need governed, repeatable dashboards at scale.
If your goal is data storytelling rather than a standalone chart, look for tools that combine visualization with narrative layouts. Piktochart lets you place AI-generated charts inside report templates with supporting text, callout boxes, and branded headers, turning a single data point into a full visual story. Flourish and Datawrapper are other options purpose-built for scrollable, annotated data narratives.
If you’re planning on inserting your charts and graphs within a larger visual, such as a report or infographic, why not use Piktochart AI to speed up the process? You can create long-form visuals in seconds from a single prompt that’s designed with expert templates to make it look sharp.
Once you’ve picked a report or infographic that you like, you can add charts or graphs from within our editor in seconds. Don’t take our word for it – give it a try for yourself!
Frequently Asked Questions About AI Chart Makers
Can ChatGPT create charts and graphs?
Yes. ChatGPT generates charts through its Advanced Data Analysis (formerly Code Interpreter) feature. Upload a CSV or Excel file, describe the visualization you need, and ChatGPT writes and executes Python code to produce the chart. It supports bar charts, line graphs, scatter plots, histograms, and more. The main limitation: you cannot edit the output directly in a visual editor; every change requires a new prompt. For recurring reporting workflows or brand-consistent visuals, a dedicated chart tool gives you more control.
What is the best free AI chart generator?
It depends on your use case. For a single chart from a text prompt, Venngage and GraphMaker offer free tiers with no sign-up friction. Google Sheets includes built-in AI chart suggestions at no cost if you already store data there. ChatGPT’s free plan (GPT-4o mini) can produce basic charts, though the paid plan handles larger files and more complex prompts. Piktochart’s chart maker includes a free plan where you can create charts and drop them straight into reports or presentations.
What data formats do AI chart generators accept?
Most tools accept CSV and Excel (.xlsx) files. Several platforms connect directly to Google Sheets, Airtable, or SQL databases. ChatGPT and Claude accept file uploads in CSV, Excel, JSON, and plain-text table formats. Enterprise platforms like Tableau and Power BI support hundreds of native connectors, from Salesforce to Snowflake.
What export formats are available?
Common exports include PNG (for presentations), SVG (for web pages), and PDF (for print). Tools like Julius AI and Graphy add interactive HTML embeds. If your chart needs to live inside a larger design, platforms like Piktochart AI let you build the chart and the surrounding layout in one workspace and export the finished piece as a single file.
Are AI-generated charts accurate?
AI chart tools plot the data you provide; they do not fabricate numbers. Accuracy depends on your input data quality and how clearly you write the prompt. Common pitfalls include mislabeled columns, date-format mismatches, and ambiguous instructions (asking for “revenue” when your spreadsheet has both gross and net columns). Always verify axis labels, scales, and totals before sharing.
Can I use AI charts in PowerPoint or Google Slides?
Yes. Most AI chart makers export PNG or SVG files you can paste into any slide deck. Some tools offer direct integrations: MagicSlides exports to Google Slides, and Microsoft Copilot in Excel generates charts you can move into PowerPoint with a single click. Piktochart exports finished visuals as PowerPoint files, preserving chart layers.