Piktochart vs Canva
A side-by-side look at pricing, AI features, infographic depth, and team workflows for marketers, HR teams, educators, and consultants choosing between the two. Last updated: May 2026.


Why teams switch from Canva to Piktochart
Canva and Piktochart both help non-designers build visuals, but they pull in different directions. Canva is the broad design tool — social media, presentations, t-shirts, posters, video, whiteboards — built for breadth. Piktochart is the focused choice for marketers, HR teams, educators, and consultants who need infographics, reports, and AI-generated data visuals out the door fast. This page lays out where each tool wins, what each costs in 2026, and how to decide.
Three patterns show up in switcher conversations and across G2 and Capterra reviews of Canva.
The editor is broad, not focused. Canva supports more than 250 design types — social media, presentations, t-shirts, business cards, video, whiteboards, websites. That breadth is the reason Canva is everywhere. It’s also the reason teams who mostly need infographics and reports report wading through menu items they never use. Piktochart’s editor stays focused on the deliverables non-designers actually ship at work: infographics, reports, posters, internal comms.
AI usage is metered tightly on the free plan. Canva’s free tier includes 200 uses of Standard AI tools and 20 uses of Premium AI tools per month. Heavier AI usage requires Canva Pro or the AI Pass add-on. Piktochart’s free plan includes 60 AI credits a month with no time limit, and the AI generators are tuned to the data-visual workflow specifically — infographics, reports, posters, banners, flyers.
Pricing math on small teams. Canva Business is $10/month annual but the plan has a 3-seat minimum, putting the floor at $30/month for any team. Piktochart Pro is $15/month, or $10/month when billed annually, and the free plan covers most occasional users, so a team of one paid seat plus three free collaborators works out cheaper than Canva’s small-team floor.
Canva is still the right call for plenty of teams — see When to choose Canva over Piktochart below. But if your day-to-day output is data visuals, internal comms, marketing infographics, or HR one-pagers, Piktochart is usually the cheaper and faster path.
Piktochart vs Canva at a glance
| Piktochart | Canva | |
|---|---|---|
| Free plan | Forever free, 60 AI credits/month, all templates, collaboration included | Free plan, limited Premium content, 200 Standard AI / 20 Premium AI uses per month |
| Pro plan | Pro: $15/month or $10/month billed annually | $15/month |
| Team / Business plan | Business: $20/member/month or $17/member/month billed annually | $10/month (annual, 3-seat minimum — $30/month floor) |
| Best for | Infographics, reports, marketing visuals, HR comms, data viz | Broad design needs — social, presentations, video, print, merch |
| AI generation | AI infographic, report, poster, banner, flyer generators | Canva AI (Magic Studio, Magic Design, Magic Write, image gen) |
| Design types | Infographics, reports, posters, presentations, social | 250+ design types including video, whiteboards, websites, t-shirts, business cards |
| Education plan | Education pricing (K-12 and higher ed) | Canva for Education — free for K-12 teachers and students |
| Print services | No native print | Canva Print (business cards, posters, merch — fulfilment built in) |
| Free-plan collaboration | Yes | Yes |
| Templates | Infographic and report-heavy library | Massive cross-format library (one of the largest on the web) |
 An editor built for infographics, not everything
 Canva is built for breadth — social media graphics, t-shirts, business cards, whiteboards, video, and dozens of other design types. That breadth is great when you need a one-stop tool. It’s also a lot of menu to navigate when all you wanted was a quarterly infographic or a data report. Piktochart trims the editor to what infographic and report makers actually use, so first drafts ship in an afternoon.
 AI generators tuned for reports and infographics
 Piktochart’s AI generators are built for the deliverables non-designers actually ship — AI infographic generator, AI report generator, AI poster, AI banner, AI flyer. The free plan includes 60 AI credits each month with no time limit. Canva AI is broader and powerful, but priced into the Pro and Business tiers for serious volume.
 Pricing math on small teams
 Canva Pro is $15/month for one creator. Canva Business is $10/month annual with a 3-seat minimum, so the floor is $30/month even for a team of three. Piktochart Pro is $15/month or $10/month when billed annually, and the free plan keeps every template open with 60 AI credits a month — useful when most of your team doesn’t need a paid seat.
Did you know that 85% of Facebook users watch videos without sound? That’s why video captions are crucial for any social media video. Piktochart Video automatically transcribes your videos and adds subtitles to them in over 60 languages.
Get access to all assets and templates
With Canva, you only get access to all images, icons, and illustrations if you have a paid account. With Piktochart, you get access to all templates from the get go and pricing is transparent if the illustration/icon is Pro. No hidden fees or being surprised about extra charges!
Try Piktochart for free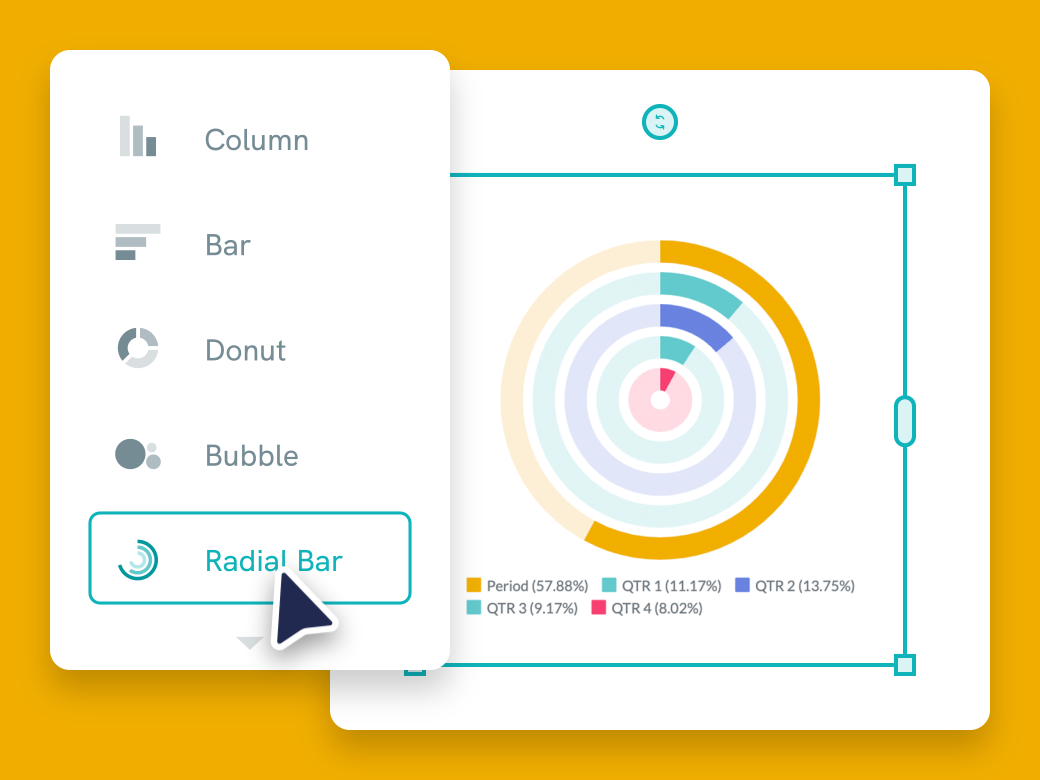
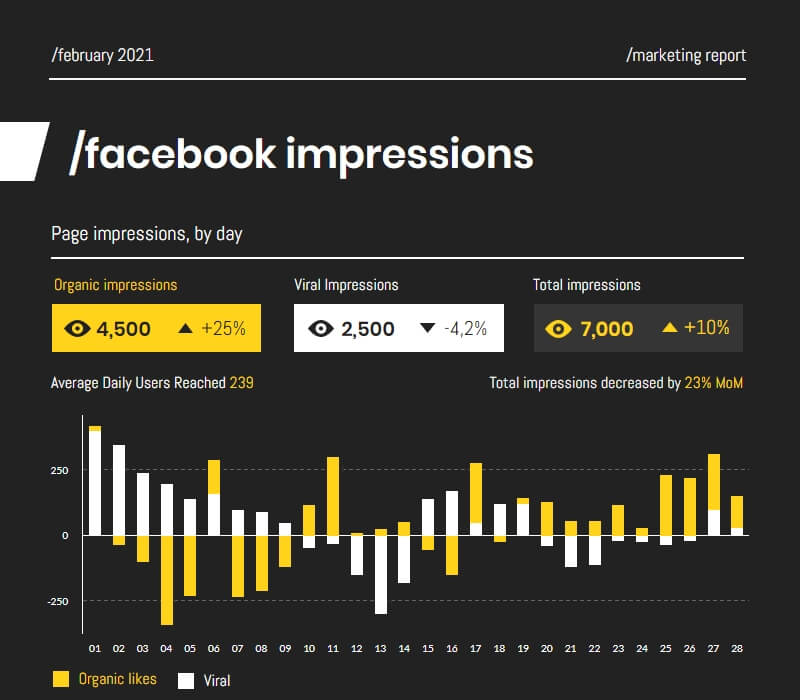
Visualize your data like a pro
Canva is great if you want to design a wedding invitation yourself. Piktochart, on the other hand, focuses more on the communication that goes on inside a business every day. From reporting on progress, to visualizing standard operating procedures or making a company announcement. Link up a Google sheet to your graphic and display the data in a variety of charts and graphs. Line graphs, bar charts, pie charts… All of them can be customized to your liking.
Try Piktochart for free
Optimize videos for social media
Although Canva also offers a video editor, Piktochart Video optimizes your videos for social media. Unlike Canva, Pichtochart Video automatically transcribes your videos and adds subtitles in over 60 languages to them. Our video editor is also as easy to use as a doc. You edit your trim, edit, and customize your videos by simply editing the text of the transcript. Videos edited, cropped, and transcribed with Piktochart Video will keep viewers engaged even if they scroll through their social media feeds without sound.
Try Piktochart for freeWhat real users say about Piktochart and Canva
4.4 / 5 across 162 reviews on G2
“It has such a vast selection of presentation types and styles. Their AI feature is really great, and the infographic option is very easy to put together. I also like how simple it is to upload your document.”
Yarisa W.
Verified G2 reviewer
“I like it because it has many templates that save me time, as I only have to choose the most suitable one for my purpose and fill it with the information I want. Additionally, I can edit videos, and not only that, but videos can also be transcribed into any language.”
Andrea V.
Verified G2 reviewer
“I’ve been using it since 2014 for projects that we don’t want to outsource to a graphics studio. It gives you a great tool to set the presentations, infographics and social media posts. And the result of your work is simply beautiful and pleasing to the eye.”
Jakub J.
Verified G2 reviewer
Quotes verbatim from G2. Read all 162 reviews on G2.
Piktochart is right for you if…
✔ You value communication more than just having a pretty graphic
Piktochart focuses on getting the message across in the shortest time possible, not just helping you create a nice visual. The editor is focused and we aim to personalize the experience as much as possible for you so that you can easily customize your graphics without spending hours.
✔ You have to communicate information internally or to clients
Piktochart is focused on business communication. That includes reporting, visualizing SOPs, creating social media posts, and internal communication.
✔ You need to collaborate with colleagues
Teamwork makes the dream work. With Piktochart you make sure everyone stays on the same page. Share you visual, leave comments, and work together to create visuals that get the message across.
✔ You’re not a designer
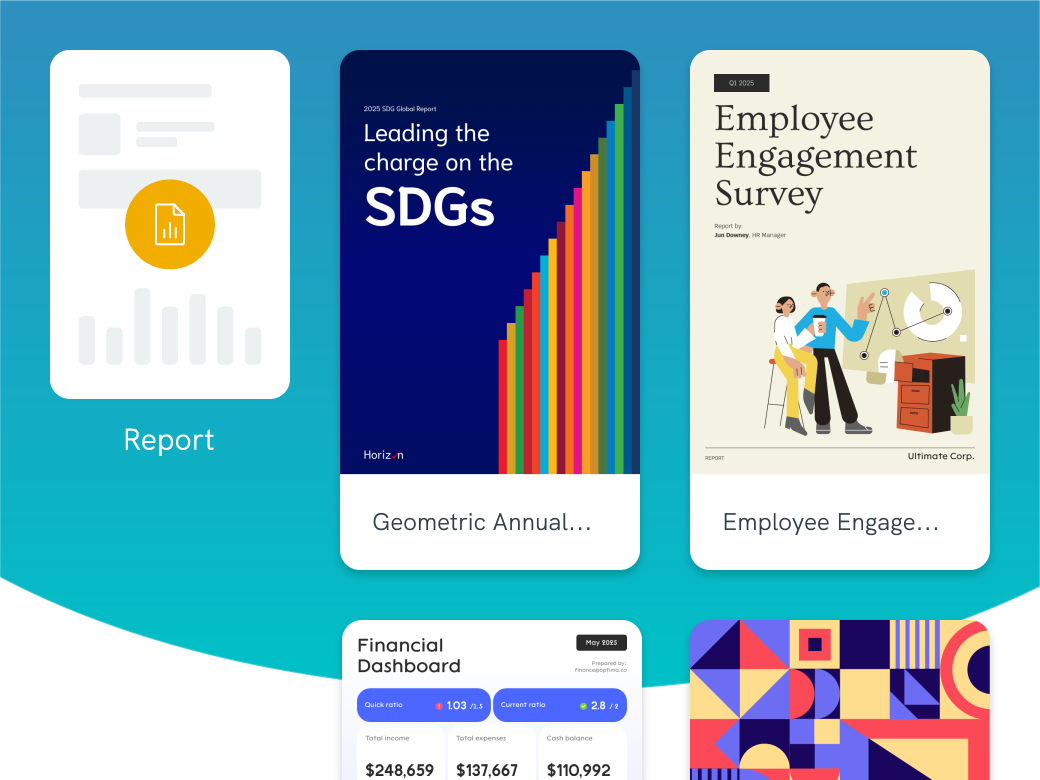
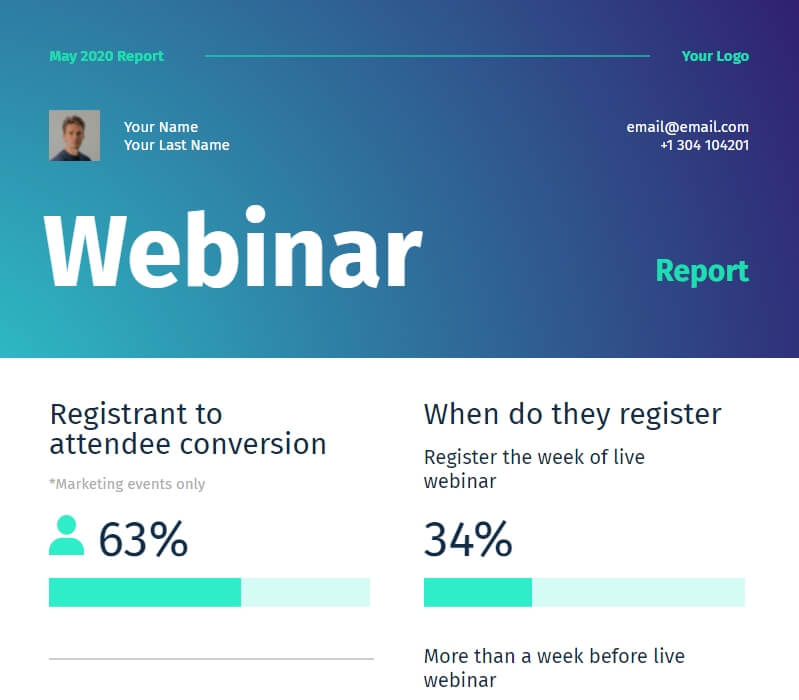
Piktochart has plenty of in-depth, comprehensive templates made by professional designers. Our designers have researched each template so that it’s not cookie-cutter lorem ipsum information that is regurgitated everywhere.
What you can do with Piktochart

Customize to your brand in seconds
Want your brand colors in your visual content? No problem! With Piktochart Pro, you get access to Brand Assets. Upload your logo and Piktochart will automatically upload your brand colors for you. You can then use these brand colors every time you create your brand visuals.
Try Piktochart for free
Integrate into your current workflow
With Piktochart, you don’t have to overhaul your entire workflow. Download your visual content in PNG and PDF formats and share them with your colleagues via email. You can also download your presentations as a PPT file and use Powerpoint to present.
Try Piktochart for free
Turn complex data into a clear, catchy visual
With Piktochart, your data will never be boring again. You get access to all the tools you need to professionally visualize your data. Copy-paste your data into our graph maker, upload a CSV , Excel file, or link up a Google sheet and turn complex data into a clear graphic that gets your message across. Choose between different types of charts & graphs to present your data in a clear and understandable way. Create bar chart, pie chart, comparison chart, interactive dashboard, and more with just a few clicks.
Try Piktochart for free
Edit your videos like a text document in +60 languages.
Video editing feels complex and daunting? With Piktochart Video, it’s as quick and straightforward as editing text. Automatically transcribe your videos in different languages. Our video-to-text converter within Piktochart Video supports over 60 languages. This way, you can make your videos accessible to a global audience. Automatically add subtitles, crop video to optimize for different aspect ratios with one click, and cut out any filler words by editing the transcript. All in a matter of minutes.
Try Piktochart for freeCheck out some of our templates


When to choose Canva over Piktochart
Both Piktochart and Canva are strong visual design tools, depending on what you need. Here are three scenarios where Canva could be the better fit:
You need a single tool for many design types. Canva supports more than 250 design types — social media graphics, presentations, video, websites, t-shirts, business cards, whiteboards, mood boards. If your team produces across all of those, Canva’s breadth is the right answer. Piktochart concentrates on infographics, reports, posters, and presentations rather than trying to cover everything.
You’re an educator or you work in K-12. Canva for Education is free for K-12 teachers, students, and qualifying schools, with the full Pro feature set unlocked. That’s a strong package for classroom use, and Canva has invested heavily in the education segment for years. Piktochart offers education pricing too, but Canva for Education is a more developed program.
You need print fulfilment built in. Canva Print produces business cards, posters, flyers, t-shirts, and merch and ships them — order, design, fulfil, all in one place. If physical print is a regular need, Canva removes a step. Piktochart focuses on digital deliverables and exports for external print partners rather than running its own print pipeline.
Canva’s brand reach, breadth of design types, and education and print programs are real strengths. If those map to how your team works, Canva earns the seat. If your output is concentrated on infographics, reports, and data visuals — and you’d rather spend less time navigating an editor that does everything — Piktochart is the more focused fit.
How to switch from Canva to Piktochart
Switching design tools is rarely the blocker people fear it will be. Most teams move over in a single afternoon. Five steps:
- Export your existing Canva designs as PDF or PNG. Use Canva’s download options to grab clean copies of anything you might want to reference or rebuild in Piktochart.
- Create a free Piktochart account. No card needed. The free plan keeps every template open and gives you 60 AI credits each month so you can test before paying.
- Pick a Piktochart template close to your usual Canva layout. The library covers infographics, reports, posters, presentations, and social.
- Drop your brand into Piktochart’s brand kit. Logo, hex codes, fonts, applied across every new design.
- Invite your team. Collaboration is included on Pro plans (and on the free plan).
Most teams report a working first design inside a single afternoon, and a fully migrated brand kit within a week.